DC Promise Neighborhood Initiative: Needs ... - Urban Institute
DC Promise Neighborhood Initiative: Needs ... - Urban Institute
DC Promise Neighborhood Initiative: Needs ... - Urban Institute

You also want an ePaper? Increase the reach of your titles
YUMPU automatically turns print PDFs into web optimized ePapers that Google loves.
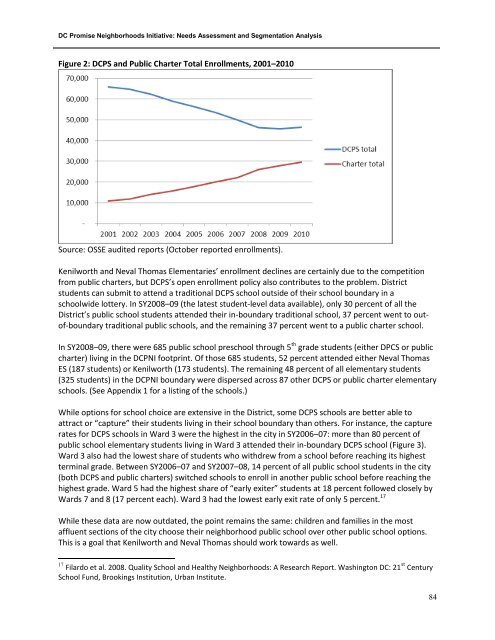
<strong>DC</strong> <strong>Promise</strong> <strong>Neighborhood</strong>s <strong>Initiative</strong>: <strong>Needs</strong> Assessment and Segmentation AnalysisFigure 2: <strong>DC</strong>PS and Public Charter Total Enrollments, 2001–2010Source: OSSE audited reports (October reported enrollments).Kenilworth and Neval Thomas Elementaries’ enrollment declines are certainly due to the competitionfrom public charters, but <strong>DC</strong>PS’s open enrollment policy also contributes to the problem. Districtstudents can submit to attend a traditional <strong>DC</strong>PS school outside of their school boundary in aschoolwide lottery. In SY2008–09 (the latest student-level data available), only 30 percent of all theDistrict’s public school students attended their in-boundary traditional school, 37 percent went to outof-boundarytraditional public schools, and the remaining 37 percent went to a public charter school.In SY2008–09, there were 685 public school preschool through 5 th grade students (either DPCS or publiccharter) living in the <strong>DC</strong>PNI footprint. Of those 685 students, 52 percent attended either Neval ThomasES (187 students) or Kenilworth (173 students). The remaining 48 percent of all elementary students(325 students) in the <strong>DC</strong>PNI boundary were dispersed across 87 other <strong>DC</strong>PS or public charter elementaryschools. (See Appendix 1 for a listing of the schools.)While options for school choice are extensive in the District, some <strong>DC</strong>PS schools are better able toattract or “capture” their students living in their school boundary than others. For instance, the capturerates for <strong>DC</strong>PS schools in Ward 3 were the highest in the city in SY2006–07: more than 80 percent ofpublic school elementary students living in Ward 3 attended their in-boundary <strong>DC</strong>PS school (Figure 3).Ward 3 also had the lowest share of students who withdrew from a school before reaching its highestterminal grade. Between SY2006–07 and SY2007–08, 14 percent of all public school students in the city(both <strong>DC</strong>PS and public charters) switched schools to enroll in another public school before reaching thehighest grade. Ward 5 had the highest share of “early exiter” students at 18 percent followed closely byWards 7 and 8 (17 percent each). Ward 3 had the lowest early exit rate of only 5 percent. 17While these data are now outdated, the point remains the same: children and families in the mostaffluent sections of the city choose their neighborhood public school over other public school options.This is a goal that Kenilworth and Neval Thomas should work towards as well.17 Filardo et al. 2008. Quality School and Healthy <strong>Neighborhood</strong>s: A Research Report. Washington <strong>DC</strong>: 21 st CenturySchool Fund, Brookings Institution, <strong>Urban</strong> <strong>Institute</strong>.84