The Wealth Beneath Our Feet - full report (6.4 MB ... - Venture Taranaki
The Wealth Beneath Our Feet - full report (6.4 MB ... - Venture Taranaki
The Wealth Beneath Our Feet - full report (6.4 MB ... - Venture Taranaki

Create successful ePaper yourself
Turn your PDF publications into a flip-book with our unique Google optimized e-Paper software.
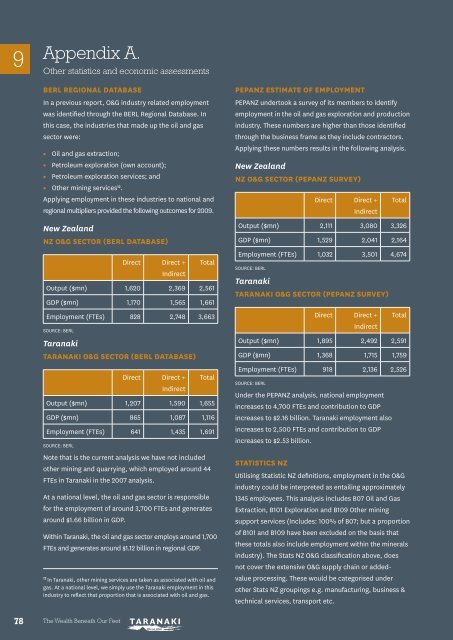
9Appendix A.Other statistics and economic assessmentsBERL Regional DatabaseIn a previous <strong>report</strong>, O&G industry related employmentwas identified through the BERL Regional Database. Inthis case, the industries that made up the oil and gassector were:••Oil and gas extraction;••Petroleum exploration (own account);••Petroleum exploration services; and••Other mining services 12 .Applying employment in these industries to national andregional multipliers provided the following outcomes for 2009.New ZealandNZ O&G Sector (berl database)Direct Direct +IndirectTotalOutput ($mn) 1,620 2,369 2,561GDP ($mn) 1,170 1,565 1,661Employment (FTEs) 828 2,748 3,663Source: BERL<strong>Taranaki</strong><strong>Taranaki</strong> O&G Sector (berl database)Direct Direct +IndirectTotalOutput ($mn) 1,207 1,590 1,655GDP ($mn) 865 1,087 1,116Employment (FTEs) 641 1,435 1,691Source: BERLNote that is the current analysis we have not includedother mining and quarrying, which employed around 44FTEs in <strong>Taranaki</strong> in the 2007 analysis.At a national level, the oil and gas sector is responsiblefor the employment of around 3,700 FTEs and generatesaround $1.66 billion in GDP.Within <strong>Taranaki</strong>, the oil and gas sector employs around 1,700FTEs and generates around $1.12 billion in regional GDP.12In <strong>Taranaki</strong>, other mining services are taken as associated with oil andgas. At a national level, we simply use the <strong>Taranaki</strong> employment in thisindustry to reflect that proportion that is associated with oil and gas.PEPANZ Estimate of employmentPEPANZ undertook a survey of its members to identifyemployment in the oil and gas exploration and productionindustry. <strong>The</strong>se numbers are higher than those identifiedthrough the business frame as they include contractors.Applying these numbers results in the following analysis.New ZealandNZ O&G Sector (pepanz SURVEY)Direct Direct + TotalIndirectOutput ($mn) 2,111 3,080 3,326GDP ($mn) 1,529 2,041 2,164Employment (FTEs) 1,032 3,501 4,674Source: BERL<strong>Taranaki</strong><strong>Taranaki</strong> O&G Sector (PEPANZ SURVEY)Direct Direct + TotalIndirectOutput ($mn) 1,895 2,492 2,591GDP ($mn) 1,368 1,715 1,759Employment (FTEs) 918 2,136 2,526Source: BERLUnder the PEPANZ analysis, national employmentincreases to 4,700 FTEs and contribution to GDPincreases to $2.16 billion. <strong>Taranaki</strong> employment alsoincreases to 2,500 FTEs and contribution to GDPincreases to $2.53 billion.STATISTICS NZUtilising Statistic NZ definitions, employment in the O&Gindustry could be interpreted as entailing approximately1345 employees. This analysis includes B07 Oil and GasExtraction, B101 Exploration and B109 Other miningsupport services (Includes: 100% of B07; but a proportionof B101 and B109 have been excluded on the basis thatthese totals also include employment within the mineralsindustry). <strong>The</strong> Stats NZ O&G classification above, doesnot cover the extensive O&G supply chain or addedvalueprocessing. <strong>The</strong>se would be categorised underother Stats NZ groupings e.g. manufacturing, business &technical services, transport etc.78<strong>The</strong> <strong>Wealth</strong> <strong>Beneath</strong> <strong>Our</strong> <strong>Feet</strong>