
Create successful ePaper yourself
Turn your PDF publications into a flip-book with our unique Google optimized e-Paper software.
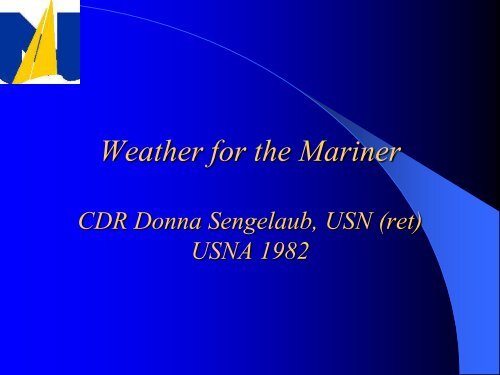
<strong>Wea<strong>the</strong>r</strong> <strong>for</strong> <strong>the</strong> <strong>Mariner</strong>CDR Donna Sengelaub, USN (ret)USNA 1982
My Point?• Click to link to BT Global Challenge video• www.youtube.com• BT Global Challenge 2000
Decisions Affected by <strong>Wea<strong>the</strong>r</strong>:Crew• Clothing.– Foul Wx gear– Tech vests• Meals.• Sea sickness medicine?• Crew Training and Experience• Crew Rotation. Who can stand watch?– Navigation or Helm or Deck?
Decisions Affected by <strong>Wea<strong>the</strong>r</strong>:Equipment• Sail combination?• Reef , change head sail or rig storm sails?• Missile hazards – are things lashed down orstowed properly?• Is equipment in good repair?• Is RACOR filter bowl clear of debris?
Decisions Affected by <strong>Wea<strong>the</strong>r</strong>:Navigation• Should you alter your route?– Go outside Long Island vs through New York City• Are you Offshore?– Should you stay on track or head closer to shore?• Are you in a Narrow Channel?– If <strong>the</strong> wind increases in strength or shifts in directioncan you navigate safely?– If visibility decreases can you navigate safely?
Decisions Affected by <strong>Wea<strong>the</strong>r</strong>:Departure Time and Date• Departure time and date may very well be<strong>the</strong> most important decision you make!
<strong>Wea<strong>the</strong>r</strong> Tools Available On• Barometer• Wind Instruments• Clouds and sea surfaceNavy 44• <strong>Wea<strong>the</strong>r</strong> facsimile – prints onboard wea<strong>the</strong>r charts• VHF radio -- local area broadcasts• SSB radio -- HF wea<strong>the</strong>r broadcasts• Satellite phone or cell phone• Reeds Nautical Almanac – provides wea<strong>the</strong>r faxschedules and frequencies
<strong>Wea<strong>the</strong>r</strong> Tools Available On Navy44Barometer
<strong>Wea<strong>the</strong>r</strong> Tools Onboard Navy 44• Chapter on <strong>Wea<strong>the</strong>r</strong> Fundamentals• Provides <strong>Wea<strong>the</strong>r</strong> Fax Frequecies• Provides photos of cloud types• Provides photos of wind and sea state• Herb Hilgenberg contact info
The goal of this lecture is to beThe goal of this decipher lecture <strong>the</strong> is wea<strong>the</strong>r to make chart. senseof wea<strong>the</strong>r in<strong>for</strong>mation you have available.
Typical chart receivedonboard a Navy 44 via<strong>the</strong> wea<strong>the</strong>r fax.Conditions off shore0600 UTC 04 Mar 2008
Forecasted Conditions OffshoreValid 0000 UTC 05 Mar 2008
Nautical <strong>Wea<strong>the</strong>r</strong> Sayings• Red sky at night, sailor’s delight. Red skyin <strong>the</strong> morning, sailor take warning.• Mackerel skies and mare’s tails make tallships carry low sails.• First rise after very low indicates astronger blow.• What do <strong>the</strong>y mean?!!
Marine <strong>Wea<strong>the</strong>r</strong> Thumb Rules• Be aware that your boat is moving relative to movingwea<strong>the</strong>r systems.• <strong>Wea<strong>the</strong>r</strong> in<strong>for</strong>mation is perishable in<strong>for</strong>mation! Updateand assess regularly. Make it a watch turnover item.• Clouds are <strong>the</strong> mariner’s best visual indicator ofchanging wea<strong>the</strong>r.• Pay attention to changes in cloud <strong>for</strong>mation and <strong>the</strong>direction from which clouds approach.
Marine <strong>Wea<strong>the</strong>r</strong> Thumb Rules• Pay attention to <strong>the</strong> speed and direction of <strong>the</strong> wind.• Pay attention to <strong>the</strong> sea surface conditions and how itchanges over time. Gradually increasing ripples on <strong>the</strong>water are first indication of increasing wind.• Long parallel streaks in <strong>the</strong> water where foam and debrisline up (called Langmuir Circulation) runs parallel with<strong>the</strong> wind and is a good indicator of true wind direction.
Marine <strong>Wea<strong>the</strong>r</strong> Thumb Rules• <strong>Wea<strong>the</strong>r</strong> systems (High/Low pressure centers) in <strong>the</strong> midlatitudesmove from west to <strong>the</strong> east in a band of windcalled <strong>the</strong> prevailing Westerlies.
Marine <strong>Wea<strong>the</strong>r</strong> Thumb Rules• Low and High pressure centers generally move insequence. High pressure replaced by low pressure andlow pressure replaced by high pressure.• Low Pressure systems are associated with storms and highpressure systems serve to block <strong>the</strong>se storms.
Marine <strong>Wea<strong>the</strong>r</strong> Thumb RulesWarm, moist air fuels low pressure. There<strong>for</strong>ewarm currents such as <strong>the</strong> Gulf Stream cancause dying low pressure systems movingoffshore to explosively redevelop.
Marine <strong>Wea<strong>the</strong>r</strong> Thumb Rules• Changes in air pressure, wind direction, humidityand temperature are excellent indicators ofchanging wea<strong>the</strong>r.• If temperature and dew point differ by 5 degreesexpect fog. If temperature and dew point differ by3 degrees or less expect rain.• Use Buys Ballot’s law to locate general locationof high and low pressure centers.
<strong>Wea<strong>the</strong>r</strong> Fundamentals• Air Masses• Pressure• Wind• Fronts and <strong>Wea<strong>the</strong>r</strong>• Clouds
Air Masses• Air masses are vast bodies of air with uni<strong>for</strong>mtemperature and moisture• Air is modified based upon it’s source region or ino<strong>the</strong>r words, where <strong>the</strong> temperature and moisturecontent modify <strong>the</strong> air.• Modified to be:• Cold or warm• Continental (dry air) or Maritime (moist air)
Air Masses• The types of air masses are:– Arctic• very cold and dry– Continental polar• cold and dry– Continental tropical• Hot and dry– Maritime tropical• (always warm and moist)
Can you pick out <strong>the</strong>5 types of air masses? Air MassesInfrared temperature gradientshowing air masses andair mass boundaries
PressureJet Stream moves pressure centerswestward and causes <strong>the</strong>m to meander northand south.Two Types:– HighPressure– Low Pressure
Pressure• The Earth is alwaysthrowing <strong>the</strong>atmosphere out ofbalance and Mo<strong>the</strong>rNature is always tryingto restore balance.• Lows and Highs actlike gears to pull hotair toward <strong>the</strong> polesand cold air toward <strong>the</strong>equator.
Low Pressure• Air circulates around low pressurecenters counter clockwise and pulls<strong>the</strong> surrounding air inward like avacuum (or <strong>the</strong> drain in a bath tub)• Air converges at <strong>the</strong> center of lowpressure and rises to <strong>for</strong>m clouds.• Associate low pressure with stormsor deteriorating wea<strong>the</strong>r• Low pressure centers are <strong>the</strong>anchoring points <strong>for</strong> fronts.• 950 mb is a very deep low pressure system(results in an intense storm)• 988 mb is a moderately deep low pressuresystem
High Pressure• Air circulates around high pressurecenters clockwise and deflects <strong>the</strong> airoutward.• High pressure is a mound of densesinking air.• High pressure tends to block or deflectapproaching bad wea<strong>the</strong>r• High pressure indicates fair and drywea<strong>the</strong>r• 1035 mb is a very strong high pressure center• 1012 is a moderately strong high pressure center
Pressure• Barometers are instrumentsthat measure air pressure.• Barometric pressure is oneof <strong>the</strong> best indicators ofimpending wea<strong>the</strong>r• Barometric pressure shouldbe logged hourly!
Pressure• Atmospheric pressure ismeasured ei<strong>the</strong>r:Outer scale on dialreads millibars– Millibars (preferred)• Outside scale of barometer• NOAA wea<strong>the</strong>r charts– Inches of mercury• Inside scale of barometerInner scale on dialReads inches of Hg
• Record hourly barometer readings• Note if pressure rises or falls• Rapidly, moderately or slowlyDate:Intrepid Hourly Status ReportsTime POSITION course / speed Battery Charge sail comb w ind baro (mb) w ater (gal) Fuel Engine Bilge ReeferLocal Latitude Longitude Dir/Vel day tank total w ater gal on/off hrs Strokes Temp[bank1] 11.7 12.0 12.3 12.6 12.9 13.2 13.5 13.8 14.1 14.4o' No' W [bank2] 11.7 12.0 12.3 12.6 12.9 13.2 13.5 13.8 14.1 14.4 mb on/off hrs[bank3] 11.7 12.0 12.3 12.6 12.9 13.2 13.5 13.8 14.1 14.4[bank1] 11.7 12.0 12.3 12.6 12.9 13.2 13.5 13.8 14.1 14.4o' No' W [bank2] 11.7 12.0 12.3 12.6 12.9 13.2 13.5 13.8 14.1 14.4 mb on/off hrs[bank3] 11.7 12.0 12.3 12.6 12.9 13.2 13.5 13.8 14.1 14.4[bank1] 11.7 12.0 12.3 12.6 12.9 13.2 13.5 13.8 14.1 14.4o' No' W [bank2] 11.7 12.0 12.3 12.6 12.9 13.2 13.5 13.8 14.1 14.4 mb on/off hrs[bank3] 11.7 12.0 12.3 12.6 12.9 13.2 13.5 13.8 14.1 14.4[bank1] 11.7 12.0 12.3 12.6 12.9 13.2 13.5 13.8 14.1 14.4o' No' W [bank2] 11.7 12.0 12.3 12.6 12.9 13.2 13.5 13.8 14.1 14.4 mb on/off hrs[bank3] 11.7 12.0 12.3 12.6 12.9 13.2 13.5 13.8 14.1 14.4[bank1] 11.7 12.0 12.3 12.6 12.9 13.2 13.5 13.8 14.1 14.4o' No' W [bank2] 11.7 12.0 12.3 12.6 12.9 13.2 13.5 13.8 14.1 14.4 mb on/off hrs[bank3] 11.7 12.0 12.3 12.6 12.9 13.2 13.5 13.8 14.1 14.4
Pressure and P`essure Trends• Watching barometric pressure trends is oneof <strong>the</strong> best indicators of impending wea<strong>the</strong>r• It is important to keep track of pressuretrends– use a 3 hour trend with a barometer• Rapid pressure changes• Over 6 mb fall (or rise) in 3 hours• Moderate pressure changes• 3-6 mb fall (or rise) in 3 hours• Slow pressure changes• 3 mb fall (or rise) in 3 hours
Pressure• Two types of air pressure:• High pressure• Think of high pressure as a mound or hill of air• Low pressure• Think of low pressure as a depression of airor water as it goes down <strong>the</strong> bath tub drain
Wind and Pressure• Wind is <strong>the</strong> result of high and low pressuredifferences and <strong>the</strong> atmosphere’s attempt toequalize <strong>the</strong> pressure differences.• air will always flow from high pressure (mound ofair) in toward low pressure (depression of air)
Wind and Pressure• The greater <strong>the</strong> pressure difference betweenhigh and low pressure, <strong>the</strong> greater <strong>the</strong> windspeed• Wind direction is always indicated from<strong>the</strong> direction <strong>the</strong> wind is blowing• For example, NE wind blows from <strong>the</strong> NE• A sou<strong>the</strong>rly wind blows from <strong>the</strong> south
Wind and Pressure• <strong>Wea<strong>the</strong>r</strong> charts are topographic charts of <strong>the</strong>atmosphere – made up of contours of hills,depressions and slopes (gradients).• These contours are called isobars and indicate <strong>the</strong>pressure gradient around a high or low pressurecenter.– Tightly packed isobars indicate a steep slope or strongwind gradient.• Isobars are indicated in millibars (mb) –– barometric pressure is lowest at <strong>the</strong> center of a low– barometric pressure is highest at <strong>the</strong> center of a high.
Wind and Pressure• Wind flows around <strong>the</strong> contours ofconstant pressure (isobars).• However… due to surface friction, windcross <strong>the</strong> isobars slightly.• Surface winds move clockwise aroundhigh pressure and are deflected outward.• Surface winds move counterclockwisearound a low and are pulled inwardacross <strong>the</strong> isobars.
The red arrow indicates your boat’s location.1. What is moving toward you, a high or a low?2. From what direction is <strong>the</strong> wind blowing?3. Where are <strong>the</strong> highest winds on this chart?
Buys Ballot Law• Its important to know where <strong>the</strong> lowpressure center is located.• This is thumb rule to use to locate <strong>the</strong> lowpressure system relative to your location.• Stand with <strong>the</strong> wind at your back• Turn 15 deg to your right• Low pressure will be to your left and high pressurewill be to your right• In o<strong>the</strong>r words <strong>the</strong> storm center is to your left andclear wea<strong>the</strong>r to your right
Air Masses and Frontal Systems• When two different airmasses collide, <strong>the</strong>boundary of <strong>the</strong> collisionis called a front.• Four types of fronts:– Cold front– Warm front– Stationary front– Occluded front
Air Masses and Frontal Systems• Four Types of fronts:– Cold front– Warm front– Occluded front– Stationary front
Cold Front• Cold Air pushes underneathwarm air and causes <strong>the</strong> airto rise violently and rapidly– Cold fronts move fast 20- 35kts– Generally move E-SE– <strong>Wea<strong>the</strong>r</strong> deteriorates rapidly– Approaching clouds seen 50-150 miles ahead of cold front
Cold Front <strong>Wea<strong>the</strong>r</strong>• Heavy rain• Thunder and lightning• Tornados• Hail• White Squall (Microburst)
Cold Front <strong>Wea<strong>the</strong>r</strong> Sequence• Winds steady from SW• Altocumulus (Ac) clouds (mid-levelpuffy clouds) on W or NW horizon• Barometer pressure falls• Clouds progressively lower andthicken• Cumulonimbus (Cb) clouds orThunderheads <strong>for</strong>m• Symbol to mark <strong>the</strong> boundary of <strong>the</strong>front is a line with blue triangles(cold air is behind <strong>the</strong> line)Cold front symbol
Cold Front <strong>Wea<strong>the</strong>r</strong>• Squalls: precede cold front by 5-6 hours– Intense black clouds– Violent gusty winds– Cold blast of wind several miles ahead of front
Cold Front <strong>Wea<strong>the</strong>r</strong> Sequence• As front passes, wea<strong>the</strong>r is as follows:– Wind veers (moves clockwise) from SW to W-NW– Barometer pressure at lowest– Rain or squall– Thunder and lightning– Rapid clearing of sky– Strong gusty winds from W-NW– Air temperatures become colder
Cirrus (Ci)Altocumulus (Ac)Cumulonimbus (Cb)Cumulus congestus (Cc)
Microburst Sequence
Warm Front• Warm air slides over cold air• Moves slowly 10-15kts• <strong>Wea<strong>the</strong>r</strong> deteriorates gradually• Approaching clouds seen from1000+ miles• Symbol marking <strong>the</strong> front is aline with red half circles (warmair is behind <strong>the</strong> line)
Warm Front <strong>Wea<strong>the</strong>r</strong>• Cirrus clouds (Ci) (high clouds) thicken to Cirrostratus(Cs) <strong>the</strong>n Altostratus (mid-level) clouds, <strong>the</strong>n Ns (lowdark rain clouds)• Steady light rain• Persistent fog• Barometer pressure falls
Warm Front <strong>Wea<strong>the</strong>r</strong> Sequence• Front passes gradually, less intense thancold front• Wind veers (rotates clockwise) from S-SEto SW• Drizzle and fog may persist• Rain and thick clouds diminish• Air temperatures become warmer
Nimbostratus (Ns)Altostratus (As)Cirrus (Ci)Cirrostratus (Cs)
Stationary Front• Occurs when <strong>the</strong> frontalboundary ei<strong>the</strong>r moves veryslowly or does not move• Notice that <strong>the</strong> symbol marking<strong>the</strong> stationary front is alternatingred half circle on <strong>the</strong> warm airside and blue triangles on <strong>the</strong>cold air sideStationary front symbol
Occluded Front• Occurs when cold frontovertakes <strong>the</strong> warm front• <strong>Wea<strong>the</strong>r</strong> is a combination ofcold steady, misty rain anddrizzle• Notice <strong>the</strong> symbol to mark<strong>the</strong> occluded front is a purplecombination of a cold andwarm front symbolOccludedFrontsymbol
Can you pick out <strong>the</strong> cold fronts, warm fronts, occluded fronts andstationary fronts?What type of wea<strong>the</strong>r is associated with each?How does <strong>the</strong> wind shift with each type of frontal passage?
Typical chart receivedonboard a Navy 44 via<strong>the</strong> wea<strong>the</strong>r fax.If you were going north,what kind of wea<strong>the</strong>rwould you expect?
Cape HatterasWarm moist air from ocean currents will add fuel tolow pressure systems moving offshore.There<strong>for</strong>e, <strong>the</strong> warm sector of <strong>the</strong> Gulf Stream cancause a dying low pressure system moving offshoreto explosively redevelop.Conditions <strong>for</strong> <strong>the</strong> “Perfect Storm”?
Nautical <strong>Wea<strong>the</strong>r</strong> Sayings• Red sky at night, sailor’s delight. Red skyin <strong>the</strong> morning, sailor take warning.• Mackerel skies and mare’s tails make tallships carry low sails.• First rise after very low indicates a strongerblow.
Clouds• To understand some of <strong>the</strong>se nauticalwea<strong>the</strong>r rhymes we need to talk aboutclouds• Clouds are a mariner’s best visual indicatorof changing wea<strong>the</strong>r.
Forecasting wea<strong>the</strong>r usingclouds• If clouds appear high and <strong>the</strong>n thicken(cumulo<strong>for</strong>m clouds) and lower, a cold frontis approaching.• If clouds appear high and <strong>the</strong>n flatten outand lower (strata<strong>for</strong>m clouds), a warm frontis approaching.
CloudsCirrus Ci(High - Mare’s Tails)
CloudsAltocumulus Ac(mackerel skies)
CloudsStratus(low flat)
Cloudscumulus Cu (heap)
Cumulonimbus Cb (Thunderheads)extreme vertical extent from surface to~ 20,000 - 35,000 ftanvil top indicates strong wind shear
CloudsCumulonimbus Cb
CloudsCumulonimbus Mammatus
CloudsCumulonimbus with waterspout
CloudsFogFog is a stratus cloud 50 ft or lessfrom <strong>the</strong> ground
Red Sky at NightSailor’s Delight• In evening sun sets in <strong>the</strong> west.• A clear sky shows <strong>the</strong> colors of <strong>the</strong>spectrum.• When sun is low in <strong>the</strong> sky <strong>the</strong> colors are <strong>the</strong>long wave colors red and orange.• <strong>Wea<strong>the</strong>r</strong> moves from west to east.• There<strong>for</strong>e, clear sky ( clear wea<strong>the</strong>r) ismoving east.
Red Sky in <strong>the</strong> Morning…Sailor Take Warning• In morning sun rises in <strong>the</strong> east.• A clear sky shows <strong>the</strong> colors of <strong>the</strong> spectrum.• When sun is low in <strong>the</strong> sky, <strong>the</strong> colors are <strong>the</strong> long wavecolors red and orange.• <strong>Wea<strong>the</strong>r</strong> moves from west to east.• There<strong>for</strong>e, clear skies in <strong>the</strong> east will be replaced bywea<strong>the</strong>r from <strong>the</strong> west.
“Mackerel Skies and Mare’s Tails:Make Tall Ships Carry Low Sails.”Mackerel Skies (Altocumulus or cirrocumulus Clouds) andMare’s Tails (Cirrus Clouds) indicate an approaching coldfront as warm air is rapidly pushed up in advance of <strong>the</strong>front.Mare’s tails(Cirrus)Mackerel Skies(altocumulusor cirrocumulus)
“First rise after a very low indicatesa stronger blow.”• Refers to <strong>the</strong> rise in barometricpressure following a period of lowpressure.• Wind is caused by <strong>the</strong> differencebetween high and low pressure and<strong>the</strong> atmosphere’s attempt toequalize <strong>the</strong> two.• The greater <strong>the</strong> pressuredifferences, <strong>the</strong> stronger <strong>the</strong> wind.Steep gradient behind thislow pressure center.Steep pressure gradient =high winds.
USN Official Use Only ResourcesNaval Atlantic Meteorology and Oceanography Center NLMOC(Norfolk,VA) (757) 444-7750Naval Atlantic Meteorology and Oceanography Detachment(Patuxent River, MD) (301) 342-3174Naval Atlantic Meteorology and Oceanography Detachment(Brunswick, ME) (207) 921-2356For Gulf Stream or Hurricane in<strong>for</strong>mationwww.nlmoc.navy.mil
O<strong>the</strong>r <strong>Wea<strong>the</strong>r</strong> ResourcesWeb Site Name Internet Address (URL) DescriptionNOAA OceanPrediction CenterNational HurricaneCenter and TropicalPrediction CenterNational Data BuoyCenterhttp://www.opc.ncep.noaa.gov/http://www.nhc.noaa.gov/http://www.ndbc.noaa.gov/Excellent source ofanalysis and <strong>for</strong>ecastcharts. Original sourceof wea<strong>the</strong>r fax chartsExcellent source of up-todatein<strong>for</strong>mation aboutexisting and developinghurricanes. Also hasmarine wea<strong>the</strong>r <strong>for</strong>tropical areas.Real time wea<strong>the</strong>rconditions at offshorebuoys, includinghistorical data andgraphical plots.Dial-a-Buoy.
Location of NOAA Buoys
Dial-A-BuoyCall 888-701-8992
Location of NOAA Buoys
Location of NOAA Buoys
Location of NOAA Buoys
VHF Radio• Local area broadcastsare prerecordedmessages provided byNOAA and providecurrent wea<strong>the</strong>r• NOAA provides localarea wea<strong>the</strong>r updateson channels 1-8.Wx button to access info quickly• Caution: local areabroadcasts are goodonly <strong>for</strong> a SPECIFICAREA at a SPECIFICTIME.Or dial wea<strong>the</strong>r info on VHF Channels 1-8
SSB or HF Radio• Voice Broadcasts are also located on HFfrequencies (Check Reeds Nautical Almanac<strong>for</strong> specific HF frequencies and times ofbroadcast)• Caution: <strong>Wea<strong>the</strong>r</strong> in<strong>for</strong>mation is perishable!• <strong>Wea<strong>the</strong>r</strong> broadcasts are good only <strong>for</strong> aSPECIFIC area at a SPECIFIC time.• Herb Hilgenberg– Begins broadcasts at 1600 EST– 12.359 MHz– Be<strong>for</strong>e voyage contact him by fax (905) 681-7114
Wind Warnings• Small Craft Warnings: 18 - 33 kts• A Small Craft Advisory is issued to alertoperators of small craft whenever sustainedwinds of 18 to 33 knots inclusive, and/or seasof 7 feet or greater, are ei<strong>the</strong>r ongoing or<strong>for</strong>ecasted to develop within <strong>the</strong> next 12 hours.
Wind WarningsGale Warnings: 34 - 47 kts• A Gale Warning is issued to alert allmariners whenever sustained winds of34 to 47 knots, associated with aextratropical system (not of tropicalorigin), are ei<strong>the</strong>r ongoing or <strong>for</strong>ecastedto develop within <strong>the</strong> next 12 hours.
Wind Warnings• Storm Warnings: 48 + kts.• Sustained winds above 48 knots ofextratropical (non-tropical) origin. Doesnot have closed cyclonic rotation.• Such storms are infrequent within <strong>the</strong>Chesapeake, however when <strong>the</strong>y dooccur, happen in fall or early spring.
Hurricane Warnings• Definite Closed Cyclonic (CCW) Rotation• Winds in this range associated with a systemdeveloping from a tropical depression wouldbe covered under aTropical Storm Warning(34 to 63 knots). Differs from a midlatitudes orextratropical storm in that it has a closedcyclonic (CCW) rotation
Hurricane Warnings• Tropical Depression >34 kts• Tropical Storm Warning 34-63 kts• Hurricane Warnings: 64 + kts
Hurricanes and Tropical Storms• Atlantic hurricane season lasts from June - Nov• Peak time frame <strong>for</strong> Atlantic August - October
Direction of travel -Navigable Semicircle:Hurricane BonnieFirst sign of a hurricane is<strong>the</strong> long period swell.Left side of <strong>the</strong> hurricane’s track.To determine dangerous semicirclefrom navigable semicircle,determine hurricane’s track andsuperimpose that track line over <strong>the</strong>storm.Dangerous Semicircle:Right side of <strong>the</strong> hurricane’strack.The most dangerous quadrantof ahurricane is <strong>the</strong> NE quadrant.
Onboard <strong>Wea<strong>the</strong>r</strong> ChartsHF Facsimile• <strong>Wea<strong>the</strong>r</strong> Charts can be accessedvia HF facsimile• Various wea<strong>the</strong>r charts aredisseminated on a set schedule byNOAA.• Reeds Nautical Almanac provides<strong>the</strong> schedule and HF frequenciesfrom which <strong>the</strong>se charts can beaccessed.• The Furuno <strong>Wea<strong>the</strong>r</strong> Facsimilemachine can be preprogrammed toautomatically access <strong>the</strong> HF signalat <strong>the</strong> time that <strong>the</strong>se charts arebroadcast.
<strong>Wea<strong>the</strong>r</strong> Charts• <strong>Wea<strong>the</strong>r</strong> charts are 2 dimensional depictionsof <strong>the</strong> atmosphere which is 3 dimensional.• They are also snapshots in time.• On a Navy 44 at sea, wea<strong>the</strong>r charts areobtained by wea<strong>the</strong>r facsimile.
<strong>Wea<strong>the</strong>r</strong> Charts• <strong>Wea<strong>the</strong>r</strong> Charts can be divided into two types:• Analysis Charts (charts that tell you what <strong>the</strong>wea<strong>the</strong>r did)• Prognostic (Forcasting) Charts (charts thattry to predict what <strong>the</strong> wea<strong>the</strong>r will do)
<strong>Wea<strong>the</strong>r</strong> Charts• When reading a wea<strong>the</strong>r chart it isimportant to first check:– Is it an analysis or prognostic chart?– If it is an analysis chart, how old is <strong>the</strong>analysis?– If it is a prognostic chart, when is <strong>the</strong> <strong>for</strong>ecastvalid?
<strong>Wea<strong>the</strong>r</strong> Chart Symbols
<strong>Wea<strong>the</strong>r</strong> Charts• Surface charts will be titled surface and cangive you in<strong>for</strong>mation regarding differentparameters• For example: surface pressure, surface winddirection
<strong>Wea<strong>the</strong>r</strong> Charts and Symbols• Surface wea<strong>the</strong>r charts will show cold,warm, occluded and stationary frontalboundaries• Wind barbs, which indicate wind directionand speed are also shown and look like
<strong>Wea<strong>the</strong>r</strong> Charts and Symbols• Wind barbs are located on surface analysischarts and give <strong>the</strong> wind and wea<strong>the</strong>rconditions that occurred at various wea<strong>the</strong>rstations
Deciphering Wind Barbs• Wind barbs are found on sfc analysis chartsand give in<strong>for</strong>mation regarding– cloud cover– wind direction– wind speed– Barometric pressure– Air temperature– Dew point
Deciphering Wind Barbs(each long barb 10 kts; short barb 5kts)Wind is from NE in this exampleWind direction and speedAir temp Barometric pressureCloud coverDew pointCloud typeFor Barometric Pressure:0153 means 1015.3 mb803 means 980.3 mb(place a 1 or 9 in front of firstdigit, whatever makes <strong>the</strong>number closest to 1000
Deciphering Wind BarbsWhat is <strong>the</strong> direction and speed of <strong>the</strong> wind?What is <strong>the</strong> temperature?What is <strong>the</strong> dewpoint?What is <strong>the</strong> pressure?What kind of wea<strong>the</strong>r can you expect?7776Cb803For Barometric Pressure:0153 means 1015.3 mb803 means 980.3 mb(place a 1 or 9 in front of firstdigit, whatever makes <strong>the</strong>number closest to 1000
<strong>Wea<strong>the</strong>r</strong> Charts and Wind• Around a low pressure center, wind blowsparallel, but slightly crosses <strong>the</strong> isobars intoward low pressure• Slightly inward and counterclockwise around a low• Around a high pressure center, wind blowsparallel, but slightly crosses <strong>the</strong> isobarsoutward from high pressure clockwise• Slightly outward and clockwise around a high
<strong>Wea<strong>the</strong>r</strong> Chart Symbols
Four Surface Analysis ChartsDaily0000Z 0600Z 1200Z 1800ZWest Atlantic Surface Analysis
Surface Forecast Charts <strong>for</strong> 24 hr 48 hr and 96 hr <strong>for</strong>ecasts
Heading south from Newport enroute to USNA…Would you have head seas or following seas?What sea heights would you expect along <strong>the</strong> track?
Remember what <strong>the</strong> bold 564 isoheightOn <strong>the</strong> 500 mb chart tells you aboutwind and seas along your track?
Forecast or Analysis?Is it current?
Upper Level <strong>Wea<strong>the</strong>r</strong> Charts• Upper Level Charts are good <strong>for</strong>ecasting tools because <strong>the</strong>y show <strong>the</strong>general upper level flow which is unimpeded by surface friction.• 500 mb chart available via wea<strong>the</strong>r fax. It shows <strong>the</strong> isoheightcontours (meters) of 500mb pressure.• The “bold” 5640 meter isoheight shows <strong>the</strong> sou<strong>the</strong>rn extent of:– <strong>the</strong> Beau<strong>for</strong>t Force 7 seas (13.5-19 ft) and winds (28-33 kts) inwinter– <strong>the</strong> Beau<strong>for</strong>t Force 6 seas (5-13 ft) and winds (22-27 kts) insummer.
5640 isoheight (bold line) shows <strong>the</strong> southward extent of <strong>the</strong>:Force 7 seas (13.5-19 ft) and winds (28-33kts) -- in winterForce 6 seas (5-13 ft) and winds (22-27kts) -- in summer
5640 isoheight (bold line) shows <strong>the</strong> southward extent of <strong>the</strong>:Force 7 seas (13.5-19 ft) and winds (28-33kts) -- in winterForce 6 seas (5-13 ft) and winds (22-27kts) -- in summer
Sea State• Sea State is determined by <strong>the</strong> following factors:– Fetch:• Size of <strong>the</strong> area over which <strong>the</strong> wind blows.– Duration:• Length of time <strong>the</strong> wind has been blowing.– Wind speed:• How hard <strong>the</strong> wind blows– Areas where <strong>the</strong>re are abrupt depth changes• such as Georges Banks off of <strong>the</strong> Grand Bands• The larger <strong>the</strong> fetch area <strong>the</strong> higher <strong>the</strong> waves.
Why is Sea State Important?• Because it’s <strong>the</strong> seas that will kill you!!!– 1 gal of water = approximately 8 lbs per gal– 1,000,000 gals of water with <strong>the</strong> <strong>for</strong>ce of windbehind it can destroy a concrete building.
These are <strong>the</strong> existingconditions off shore todayIf you were to head southfrom Newport enroute toUSNA, what kind ofwea<strong>the</strong>r would youexpect along your track?What o<strong>the</strong>r wea<strong>the</strong>rresources could you use tohelp predict <strong>the</strong>conditions and plan ahead?
Remember what <strong>the</strong> bold 564 isoheightOn <strong>the</strong> 500 mb chart tells you aboutwind and seas along your track?
Heading south from Newport enroute to USNA…Would you have head seas or following seas?What sea heights would you expect along <strong>the</strong> track?
Questions???