C:\Documents and Settings\Annet
C:\Documents and Settings\Annet
C:\Documents and Settings\Annet

Create successful ePaper yourself
Turn your PDF publications into a flip-book with our unique Google optimized e-Paper software.
MATC 1200 Class Notes Sec. 5.1 Exponential FunctionsYou already knew about b 2 b bb 3 b b bb n b bn timesHere the exponents are integers. Then we looked at rational exponents.b 1 2 bb 3 2 b 3b 4 3 3 b 4Now we want to look at b x where x is any real number.For example, 2 3 or 8 . If you put these into your calculator or SN, you will be able toevaluate them.DefinitionThe function fx b x where b 0, b 1 is called an exponential function.All the usual properties of exponents apply.1. b x b y if <strong>and</strong> only if x y.2. b x b y b xy3.b xb y b xy4. b x y b xy5. ab x a x b x6. a b x axb xProblem #17, Sec. 5.1Solve for x.6 2x 6 4Since the base b is the same on both sides of the inequality, the exponents are equal. So2x 4 <strong>and</strong> x 2.You will be using SN to do such problems.6 2x 6 4 , Solution is: x 2. 0 (SN: Compute/Solve Numeric)Problem #24, Sec. 5.13 xx2 1 , Solution is: x 0. 09 xThis is not completely correct.1 9 x 3 2 x 3 2x9 xSo if 3 xx2 3 2x then x x 2 2x.Now let’s solve this equation for x.x x 2 2x, Solution is: x 3. 0, x 0. 0Aha! There are two solutions.What do the graphs of exponential functions look like?5.1 1
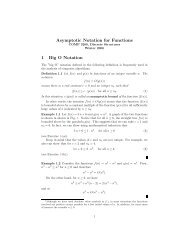
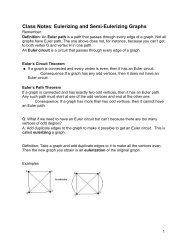
y54321-5 -4 -3 -2 -1 0 1 2 3 4 5y 2 x solid, y 3 x dashedThis is the graph of y 2 x <strong>and</strong> y 3 x . Note that they both go through the point 0, 1. Infact, the graphs of all exponential functions go through the point 0, 1. Why is that?Because when x 0, y b 0 1.If b 1, then the graph of y b x has the same general shape as those given above. Howcan we tell which is which? Well, when x 1, 2 1 2 so 1, 2 is a point on the graph ofy 2 x . Similarly, 1, 3 is a point on the graph of y 3 x .xy54321-5 -4 -3 -2 -1 0 1 2 3 4 5y 110x solid, y 14x dashed1Again, both graphs go through the point 0, 1. If x 1, 1 10 so 1, 10 is on the101graph of y x 1. Similarly, 1, 4 is a point on the graph of y x . If b 1, then the104graph of y b x has the same general shape as those given above.xDefinitionDefine a number e, called the natural exponential base ase lim nNote: e is just a number, like is a number.Evaluate it in SN.e 2. 718 281 828 459 045 235 4This is an approximation to the value of e.The exponential function1 1 nn5.1 2
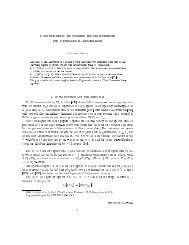
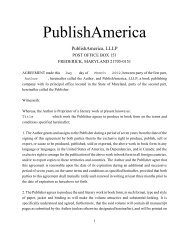
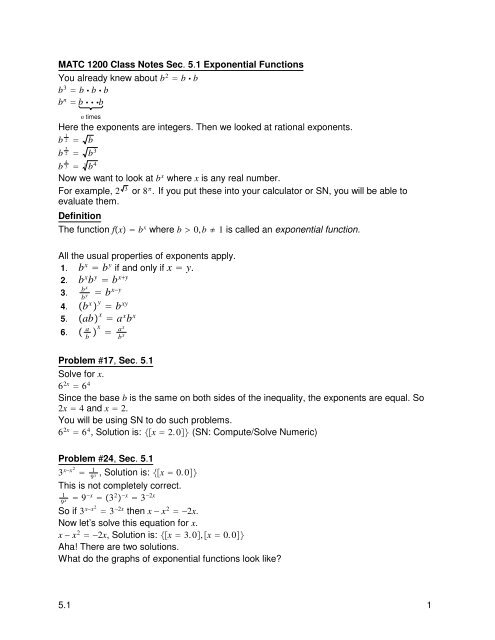
is called the natural exponential function.fx e xWhich of the graphs below is the graph of y e x ?e x 5y4321-5 -4 -3 -2 -1 0 1 2 3 4 5xy54y54332211-4 -2 0 2 4x-4 -2 0 2 4xIt is the one on the left because e 1. Incidentally, the graph on the left is the graph of 1 e x e x .Problem #37, Sec. 5.1Because of medical technology advances, the disability rates for people over 65 have beendropping rather dramatically. The functionRt 26. 3e 0.016t , 0 t 18gives the disability rate Rt, in percent, for people over age 65 from 1982 (t 0) through2000, where t is measured in years.1. What was the disability rate in 1982? In 1986? In 1994? In 2000?1982: R0 26. 31986: R4 24. 669 531 487 658 185 5291994: R12 21. 705 570 641 331 246 7692000: R18 19. 718 729 875 886 786 2272. Sketch the graph of R.26. 3e 0.016t5.1 3
y25201510500 10 20 30 40 50 60 70 80 90 100xProblem #42, Sec. 5.1The concentration of a drug in an organ at any time t (in seconds) is given byCt 0. 3t 181 e t60 if 0 t 2018e t60 12e t2060 if t 20where Ct is measured in grams/cubic centimeter (g/cm 3 ).1. What is the initial concentration of the drug in the organ?C0 02. What is the concentration of the drug in the organ after 10 sec?C10 18e 1 6 15. 0 0. 236 671 048 031 053 332 813. What is the concentration of the drug in the organ after 30 sec?C30 18e 1 2 12e 1 6 0. 759 771 176 140 032 736 334. What will be the concentration of the drug in the long run?lim tCt 05.1 4