

Urbanisation-in-Namibia
Urbanisation-in-Namibia
Urbanisation-in-Namibia

You also want an ePaper? Increase the reach of your titles
YUMPU automatically turns print PDFs into web optimized ePapers that Google loves.
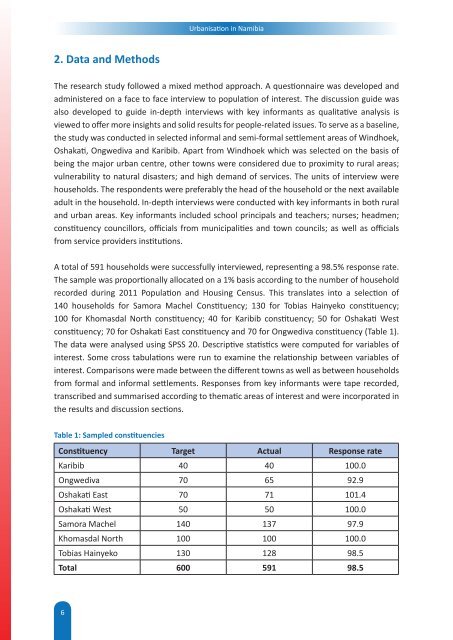
<strong>Urbanisation</strong> <strong>in</strong> <strong>Namibia</strong>2. Data and MethodsThe research study followed a mixed method approach. A questionnaire was developed andadm<strong>in</strong>istered on a face to face <strong>in</strong>terview to population of <strong>in</strong>terest. The discussion guide wasalso developed to guide <strong>in</strong>-depth <strong>in</strong>terviews with key <strong>in</strong>formants as qualitative analysis isviewed to offer more <strong>in</strong>sights and solid results for people-related issues. To serve as a basel<strong>in</strong>e,the study was conducted <strong>in</strong> selected <strong>in</strong>formal and semi-formal settlement areas of W<strong>in</strong>dhoek,Oshakati, Ongwediva and Karibib. Apart from W<strong>in</strong>dhoek which was selected on the basis ofbe<strong>in</strong>g the major urban centre, other towns were considered due to proximity to rural areas;vulnerability to natural disasters; and high demand of services. The units of <strong>in</strong>terview werehouseholds. The respondents were preferably the head of the household or the next availableadult <strong>in</strong> the household. In-depth <strong>in</strong>terviews were conducted with key <strong>in</strong>formants <strong>in</strong> both ruraland urban areas. Key <strong>in</strong>formants <strong>in</strong>cluded school pr<strong>in</strong>cipals and teachers; nurses; headmen;constituency councillors, officials from municipalities and town councils; as well as officialsfrom service providers <strong>in</strong>stitutions.A total of 591 households were successfully <strong>in</strong>terviewed, represent<strong>in</strong>g a 98.5% response rate.The sample was proportionally allocated on a 1% basis accord<strong>in</strong>g to the number of householdrecorded dur<strong>in</strong>g 2011 Population and Hous<strong>in</strong>g Census. This translates <strong>in</strong>to a selection of140 households for Samora Machel Constituency; 130 for Tobias Ha<strong>in</strong>yeko constituency;100 for Khomasdal North constituency; 40 for Karibib constituency; 50 for Oshakati Westconstituency; 70 for Oshakati East constituency and 70 for Ongwediva constituency (Table 1).The data were analysed us<strong>in</strong>g SPSS 20. Descriptive statistics were computed for variables of<strong>in</strong>terest. Some cross tabulations were run to exam<strong>in</strong>e the relationship between variables of<strong>in</strong>terest. Comparisons were made between the different towns as well as between householdsfrom formal and <strong>in</strong>formal settlements. Responses from key <strong>in</strong>formants were tape recorded,transcribed and summarised accord<strong>in</strong>g to thematic areas of <strong>in</strong>terest and were <strong>in</strong>corporated <strong>in</strong>the results and discussion sections.Table 1: Sampled constituenciesConstituency Target Actual Response rateKaribib 40 40 100.0Ongwediva 70 65 92.9Oshakati East 70 71 101.4Oshakati West 50 50 100.0Samora Machel 140 137 97.9Khomasdal North 100 100 100.0Tobias Ha<strong>in</strong>yeko 130 128 98.5Total 600 591 98.56