

Market Segmentation and IPO-Underpricing: The German Experience
Market Segmentation and IPO-Underpricing: The German Experience
Market Segmentation and IPO-Underpricing: The German Experience

Create successful ePaper yourself
Turn your PDF publications into a flip-book with our unique Google optimized e-Paper software.
<strong>Market</strong> <strong>Segmentation</strong> <strong>and</strong> <strong>IPO</strong>-<strong>Underpricing</strong>: <strong>The</strong> <strong>German</strong> <strong>Experience</strong><br />
However, this relationship is already tested with the gross proceeds per nominal capital as an<br />
explanatory variable.<br />
4.2. Empirical Findings<br />
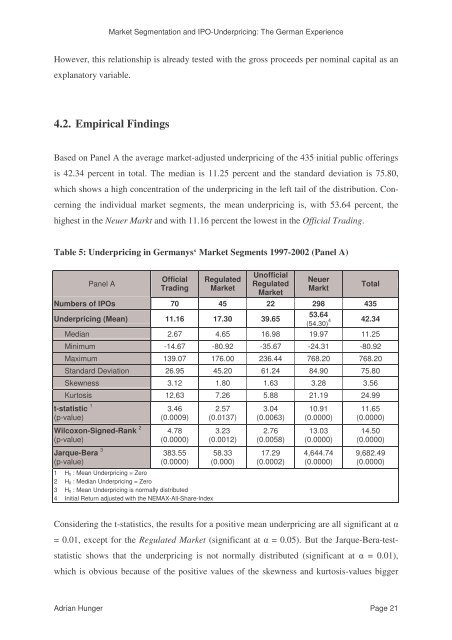
Based on Panel A the average market-adjusted underpricing of the 435 initial public offerings<br />
is 42.34 percent in total. <strong>The</strong> median is 11.25 percent <strong>and</strong> the st<strong>and</strong>ard deviation is 75.80,<br />
which shows a high concentration of the underpricing in the left tail of the distribution. Con-<br />
cerning the individual market segments, the mean underpricing is, with 53.64 percent, the<br />
highest in the Neuer Markt <strong>and</strong> with 11.16 percent the lowest in the Official Trading.<br />
Table 5: <strong>Underpricing</strong> in <strong>German</strong>ys‘ <strong>Market</strong> Segments 1997-2002 (Panel A)<br />
Panel A<br />
Official<br />
Trading<br />
Regulated<br />
<strong>Market</strong><br />
Unofficial<br />
Regulated<br />
<strong>Market</strong><br />
Neuer<br />
Markt<br />
Numbers of <strong>IPO</strong>s 70 45 22 298 435<br />
<strong>Underpricing</strong> (Mean) 11.16 17.30 39.65<br />
53.64<br />
(54.30) 4<br />
Total<br />
42.34<br />
Median 2.67 4.65 16.98 19.97 11.25<br />
Minimum -14.67 -80.92 -35.67 -24.31 -80.92<br />
Maximum 139.07 176.00 236.44 768.20 768.20<br />
St<strong>and</strong>ard Deviation 26.95 45.20 61.24 84.90 75.80<br />
Skewness 3.12 1.80 1.63 3.28 3.56<br />
Kurtosis 12.63 7.26 5.88 21.19 24.99<br />
t-statistic 1<br />
(p-value)<br />
Wilcoxon-Signed-Rank 2<br />
(p-value)<br />
Jarque-Bera 3<br />
(p-value)<br />
3.46<br />
(0.0009)<br />
4.78<br />
(0.0000)<br />
383.55<br />
(0.0000)<br />
1 H0 : Mean <strong>Underpricing</strong> = Zero<br />
2 H0 : Median <strong>Underpricing</strong> = Zero<br />
3 H0 : Mean <strong>Underpricing</strong> is normally distributed<br />
4 Initial Return adjusted with the NEMAX-All-Share-Index<br />
2.57<br />
(0.0137)<br />
3.23<br />
(0.0012)<br />
58.33<br />
(0.000)<br />
3.04<br />
(0.0063)<br />
2.76<br />
(0.0058)<br />
17.29<br />
(0.0002)<br />
10.91<br />
(0.0000)<br />
13.03<br />
(0.0000)<br />
4,644.74<br />
(0.0000)<br />
11.65<br />
(0.0000)<br />
14.50<br />
(0.0000)<br />
9,682.49<br />
(0.0000)<br />
Considering the t-statistics, the results for a positive mean underpricing are all significant at<br />
= 0.01, except for the Regulated <strong>Market</strong> (significant at = 0.05). But the Jarque-Bera-test-<br />
statistic shows that the underpricing is not normally distributed (significant at = 0.01),<br />
which is obvious because of the positive values of the skewness <strong>and</strong> kurtosis-values bigger<br />
Adrian Hunger Page 21