2 jamaica money market brokers limited annual report ... - Jmmb.com
2 jamaica money market brokers limited annual report ... - Jmmb.com
2 jamaica money market brokers limited annual report ... - Jmmb.com

You also want an ePaper? Increase the reach of your titles
YUMPU automatically turns print PDFs into web optimized ePapers that Google loves.
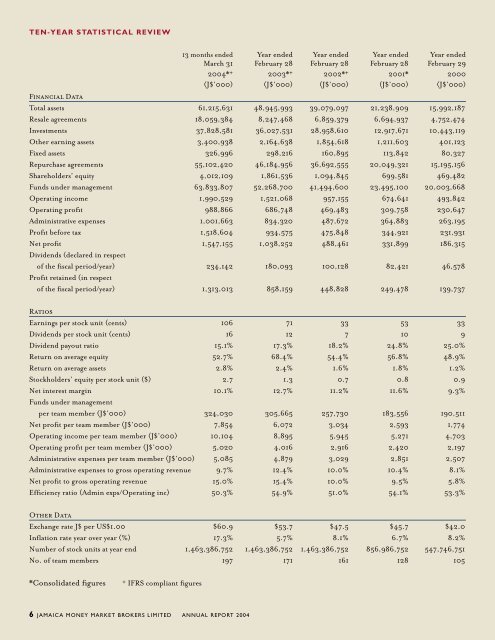
TEN-YEAR STATISTICAL REVIEW13 months ended Year ended Year ended Year ended Year endedMarch 31 February 28 February 28 February 28 February 292004*+ 2003*+ 2002*+ 2001* 2000(J$’000) (J$’000) (J$’000) (J$’000) (J$’000)Financial DataTotal assets 61,215,631 48,945,993 39,079,097 21,238,909 15,992,187Resale agreements 18,059,384 8,247,468 6,859,379 6,694,937 4,752,474Investments 37,828,581 36,027,531 28,958,610 12,917,671 10,443,119Other earning assets 3,400,938 2,164,638 1,854,618 1,211,603 401,123Fixed assets 326,996 298,216 160,895 113,842 80,327Repurchase agreements 55,102,420 46,184,956 36,692,555 20,049,321 15,195,156Shareholders’ equity 4,012,109 1,861,536 1,094,845 699,581 469,482Funds under management 63,833,807 52,268,700 41,494,600 23,495,100 20,003,668Operating in<strong>com</strong>e 1,990,529 1,521,068 957,155 674,641 493,842Operating profit 988,866 686,748 469,483 309,758 230,647Administrative expenses 1,001,663 834,320 487,672 364,883 263,195Profit before tax 1,518,604 934,575 475,848 344,921 231,931Net profit 1,547,155 1,038,252 488,461 331,899 186,315Dividends (declared in respectof the fiscal period/year) 234,142 180,093 100,128 82,421 46,578Profit retained (in respectof the fiscal period/year) 1,313,013 858,159 448,828 249,478 139,737RatiosEarnings per stock unit (cents) 106 71 33 53 33Dividends per stock unit (cents) 16 12 7 10 9Dividend payout ratio 15.1% 17.3% 18.2% 24.8% 25.0%Return on average equity 52.7% 68.4% 54.4% 56.8% 48.9%Return on average assets 2.8% 2.4% 1.6% 1.8% 1.2%Stockholders’ equity per stock unit ($) 2.7 1.3 0.7 0.8 0.9Net interest margin 10.1% 12.7% 11.2% 11.6% 9.3%Funds under managementper team member (J$’000) 324,030 305,665 257,730 183,556 190,511Net profit per team member (J$’000) 7,854 6,072 3,034 2,593 1,774Operating in<strong>com</strong>e per team member (J$’000) 10,104 8,895 5,945 5,271 4,703Operating profit per team member (J$’000) 5,020 4,016 2,916 2,420 2,197Administrative expenses per team member (J$’000) 5,085 4,879 3,029 2,851 2,507Administrative expenses to gross operating revenue 9.7% 12.4% 10.0% 10.4% 8.1%Net profit to gross operating revenue 15.0% 15.4% 10.0% 9.5% 5.8%Efficiency ratio (Admin exps/Operating inc) 50.3% 54.9% 51.0% 54.1% 53.3%Other DataExchange rate J$ per US$1.00 $60.9 $53.7 $47.5 $45.7 $42.0Inflation rate year over year (%) 17.3% 5.7% 8.1% 6.7% 8.2%Number of stock units at year end 1,463,386,752 1,463,386,752 1,463,386,752 856,986,752 547,746,751No. of team members 197 171 161 128 105*Consolidated figures+ IFRS <strong>com</strong>pliant figures6 JAMAICA MONEY MARKET BROKERS LIMITED ANNUAL REPORT 2004