How Satellite Images Provide Total Phosphorus Monitoring White ...
How Satellite Images Provide Total Phosphorus Monitoring White ...
How Satellite Images Provide Total Phosphorus Monitoring White ...

Create successful ePaper yourself
Turn your PDF publications into a flip-book with our unique Google optimized e-Paper software.
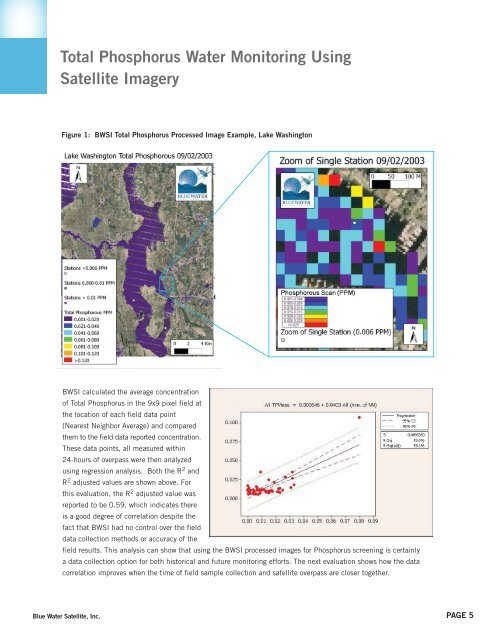
<strong>Total</strong> <strong>Phosphorus</strong> Water <strong>Monitoring</strong> Using<strong>Satellite</strong> ImageryFigure 1: BWSI <strong>Total</strong> <strong>Phosphorus</strong> Processed Image Example, Lake WashingtonBWSI calculated the average concentrationof <strong>Total</strong> <strong>Phosphorus</strong> in the 9x9 pixel field atthe location of each field data point(Nearest Neighbor Average) and comparedthem to the field data reported concentration.These data points, all measured within24-hours of overpass were then analyzedusing regression analysis. Both the R 2 andR 2 adjusted values are shown above. Forthis evaluation, the R 2 adjusted value wasreported to be 0.59, which indicates thereis a good degree of correlation despite thefact that BWSI had no control over the fielddata collection methods or accuracy of thefield results. This analysis can show that using the BWSI processed images for <strong>Phosphorus</strong> screening is certainlya data collection option for both historical and future monitoring efforts. The next evaluation shows how the datacorrelation improves when the time of field sample collection and satellite overpass are closer together.Blue Water <strong>Satellite</strong>, Inc.PAGE 5