A case history for soil improvement against liquefaction, Carrefoursa ...
A case history for soil improvement against liquefaction, Carrefoursa ...
A case history for soil improvement against liquefaction, Carrefoursa ...

You also want an ePaper? Increase the reach of your titles
YUMPU automatically turns print PDFs into web optimized ePapers that Google loves.
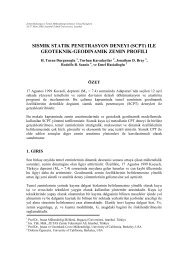
directions, indicating occasional lenses. A typical data from aCPT and a nearby borehole is given in Figure 1.Based on the results of boreholes and CPT tests, the sub<strong>soil</strong>within the site in general, consists of alternation of silty clay, siltand silty sand ranging between soft/loose to medium approximatelydown to the depth of 24.0 m below the ground surface.Below this depth, a gravelly clay layer with average SPT/N blowcount value in the order of 25 is encountered.In the geotechnical model based on the results of in situ tests,laboratory tests and CPTs, it was observed that, down to approximately3.5 m depth, the undrained shear strength values arein the order of s u = 35 kPa. Approximately between the depths of3.5 m and 12.0 m, a silty, clayey sand layer in loose to mediumdensity is encountered. Between the depths 12.0 m and 24.0 m, aclay layer is present having undrained shear strength value in the4 FOUNDATION ENGINEERING EVALUATIONS4.1 Bearing capacityBased on the shear strength model, the ultimate bearing capacity<strong>for</strong> shallow foundations and embankment without consideringthe primary and secondary settlements, is determined by;q net ~ 5 x s uwhereas, q net = 5 x 35 kPa = 175 kPa. There<strong>for</strong>e the allowable<strong>soil</strong> pressure is given as;q all = 70 kPaconsidering a safety factor of FS = 2.5 and without taking into0q c (MPa)0 5 10 15 20f s (kPa)0 100 200 300 400R f (%)0 1 2 3 4 5 6 7Soil DescriptionFillSPT blow count per300mm penetration0 10 20 30 40 50silty Clay5silty Sand10depth (m)15silty Claysandy Silt20silty Clay25GravellyClay30Figure 1. Typical <strong>soil</strong> profile determined by CPT and boringorder of s u = 50 kPa while a 2.0 m thick sand layer is found betweenthe depths of 16.0 m and 18.0 m. Based on the results ofboreholes and CPTs, the consistency increases from stiff to hardbelow 24.0 m depth. The identification properties of the <strong>soil</strong>s encounteredat the site are determined by laboratory tests andsummarised below in Table 1.Table 1. Identification test resultsProperty Sand ClayNatural water content, % * 35-68% passing #200 sieve 10-43 *Liquid limit * 39-83Plastic limit * 12-41Plasticity index * 16-46* not availableaccount the settlements.4.2 SettlementsThe settlement calculations are done both utilising CPT test datawhich enables detailed layering and also utilising the idealisedgeotechnical model. The settlement calculations are carried out<strong>for</strong> a strip foundation width of 4.0 m and a foundation base pressureof 50 kPa and also repeated <strong>for</strong> a 3.0 m high embankmentloading. The results obtained are summarised below in Table 2.It was also recommended in the foundation engineering reportthat the secondary settlements in the order of 10% of these givenvalues should be considered to be realised in the long term.Considering the structural and architectural criteria <strong>for</strong> theplanned structures, calculated settlement values are above the allowablelimits. The allowable settlements were determined asmaximum s = 5.0 cm under the foundations/slabs-on-grade andembankment loading. Ultimately, it was concluded that bothfoundations and slabs-on-grade and/or embankment loadingsshould be supported by <strong>soil</strong> <strong>improvement</strong> and/or deep foundationsystems.
Table 2. Summary of settlement analysesSettlement, cmAnalysisCPTsModelbased onLoading Strip Embankment Strip Embankmenttype foundationfoundationMinimum 12.1 20.2 - -Maximum 23.8 39.3 - -Average 18.7 37.1 16.7 32.9economical advantage because the excavation of the weak <strong>soil</strong>can be avoided. Also, high internal shearing resistance is pr o-vided within the pillar. These pillars act as oversize verticaldrains causing reduction of consolidation time. Schematic principleof the dynamic replacement method is illustrated in Figure2.Weightdropping4.3 Seismicity and risk of <strong>liquefaction</strong>The subject site is located within the first degree earthquakezone in Izmir with a high seismic activity. The <strong>soil</strong> <strong>liquefaction</strong>analyses are per<strong>for</strong>med based on the results of CPT and SPT,and the properties of the encountered sub<strong>soil</strong> in boreholes. Forthis purpose, a seismic risk analysis is utilised per<strong>for</strong>med previously<strong>for</strong> the subject region by Cetinkaya et al. (1993). Accordingly<strong>for</strong> the subject region,FillCompressible<strong>soil</strong>Refilling− Average maximum annual earthquake magnitude: M = 4.8− Most frequent annual magnitude: M = 4.6− Maximum magnitude <strong>for</strong> a return period of 100 years: M =8.4− Magnitude with an annual risk of R = 10%: M = 6.3 (designearthquake)− Bedrock accelerations <strong>for</strong> an epicentral distance to fault lineof 10 km is a = 0.5g, 20 km is a = 0.25g, and 40 km is a =0.12gConsidering that the subject site is located within 20 km distanceto potential fault lines, the maximum bedrock acceleration <strong>for</strong>the design earthquake was considered as 0.25g <strong>for</strong> a service lifeof 100 years. Furthermore, considering the bedrock is at verydeep level and the site is covered with weak alluvial deposits,<strong>soil</strong> amplification is expected during an earthquake and there<strong>for</strong>estructural units within the facility would be subject to accelerationgreater than a = 0.25g. Ultimately, the <strong>liquefaction</strong> analysesare per<strong>for</strong>med <strong>for</strong> ground acceleration values of a = 0.3g and0.4g considering the <strong>soil</strong> amplification effects. The susceptibilityof the sub<strong>soil</strong> <strong>against</strong> <strong>liquefaction</strong> under the earthquake loadingwas also predicted by the method suggested by Robertson (1988)utilising the CPT parameters. Analyses are done <strong>for</strong> the <strong>case</strong>s ofPGA (Peak Ground Acceleration) values a = 0.3g and a = 0.4gboth using the standard penetration blow counts, and CPT resultsseparately. As a result of these analyses, <strong>liquefaction</strong> potentialwas determined in the sand layer existing within the first 12.0 mdepth. Below this level, clayey and silty layers are present ingeneral which are not prone to <strong>soil</strong> <strong>liquefaction</strong>.Consequently, in order to prevent <strong>liquefaction</strong>, <strong>soil</strong> <strong>improvement</strong>was recommended to be implemented at the subject site.5 SOIL IMPROVEMENT WORKSIn the light of ground investigations, dynamic replacementmethod was chosen to be the best solution among the possibleground <strong>improvement</strong> techniques applicable, in terms of economy,time and effectiveness. Soil <strong>improvement</strong> works are realisedutilising dynamic replacement method by French companyof Menard Soltraitement.Dynamic Replacement (DR) is a method in which columns oflarge diameter are <strong>for</strong>med with granular material based on thetechniques developed <strong>for</strong> Dynamic Consolidation in highly compressibleand weak <strong>soil</strong>s. These columns of granular material arecalled “pillars”. This technique is similar to dynamic consolidationbut in this <strong>case</strong>, pounding is used to <strong>for</strong>m large diametergranular pillars through the soft clayey <strong>soil</strong>s to underlying densebearing stratum. This method combines the advantages of dynamicconsolidation with those of stone columns creating anFigure 2. Schematic principle of Dynamic Replacement methodThe equipment used <strong>for</strong> dynamic replacement is similar to thedynamic consolidation equipment i.e. heavy rigs and pounders.However, usually pounder with smaller area is used to facilitatethe penetration capacity (Menard Soltraitement 1999). Heavydynamic replacement (HDR) columns are made with bouldersand cobles using energies exceeding 400 tm per blow. The relationshipbetween the effective depth of attained <strong>improvement</strong>,the pounder weight and the height of the drop is expressed as belowin dynamic consolidation:D = (0.3 to 0.7)W × H(1)where D = maximum depth of <strong>improvement</strong> in meters; W = fallingweight in metric tons; and H = height of drop in meters(Mitchell & Gallagher 1998).Pre-excavation in dynamic replacement allows to constructdeeper columns especially in clays, enabling to obtain very goodresistance parameters even in soft compressible <strong>soil</strong>s when combinedwith HDR method. Construction control methods of dynamicreplacement operation at site are similar to those of dynamicconsolidation.Menard designed the <strong>soil</strong> <strong>improvement</strong> scheme including thequality control testing <strong>for</strong> <strong>Carrefoursa</strong> site in Izmir. For this purpose,the total area was divided into six different zones wheredifferent pillar types are constructed. The total area of the site is64,851 m 2 where the <strong>soil</strong> <strong>improvement</strong> is applied. The propertiesset initially <strong>for</strong> various types of pillars are given below in Table3.Table 3. Details of dynamic replacement schemeTreatment DR HDRPillar Type Type1Type1Type2Type3Type4Type5Grid, m 2 36 36 36 36 32 54Drop Height, 20 20 20 20 20 20mPounder 15 25 25 25 25 25Weight, tBlows per 20 22 22 22 20 3x22Pillar, b/pEnergy,tm/m 2 166.7 305.6 305.6 305.6 312.5 611.1The working plat<strong>for</strong>m level was at +1.50 m where the <strong>soil</strong> <strong>improvement</strong>application is per<strong>for</strong>med. After the <strong>soil</strong> improve mentworks are completed, the level is brought to +3.50 m.
5.1 Pilot tests in calibration areaThe Pilot Test is part of quality control program which was per<strong>for</strong>medbe<strong>for</strong>e commencing the <strong>soil</strong> <strong>improvement</strong> works and haspermitted to adapt the parameters of Dynamic Replacement(DR) and Heavy Dynamic Replacement (HDR) to the mechanicalproperties of the <strong>soil</strong>.The area in which the pilot tests were carried out is a squareof 450 m 2 (21.2 m x 21.2 m). Dynamic replacement pillars in thiszone were per<strong>for</strong>med according to 6.0 m x 6.0 m grid. Pilot zonetesting consisted of initial and final pressuremeter tests, heaveand penetration tests, grading and level monitoring. The detailedcharacteristics of the dynamic replacement equipment used inthe pilot area is given below :− Tamping unit : 500 tm crawler crane− Pounder weight : 25 tons− Pounder dimension : 1.85 m x 1.85 m – octagonal shape− Payloader <strong>for</strong> carrying the material <strong>for</strong> the pillars− Surveyor equipment <strong>for</strong> level measurementDuring the calibration works, settlement and heave values are estimated<strong>for</strong> each penetration. Pressuremeter tests (PMT) on pilotarea were realised down to a elevation of –11.0 m, with tests atevery meter from the level of +1.5 m to obtain limit pressure (Pl)values and pressuremeter modulus (E p ) values.Heave and penetration works are realised in order to determinethe optimal number of blows <strong>for</strong> each phase, to determinethe optimal volume of fill material to be put into the prints and tocheck that the pounder penetration is not a volume displacement,but effective compaction of the <strong>soil</strong>. Following parameters arerecorded: (a) diameter of print after each blow; (b) depth of printafter each blow; (c) levels of all benchmarks during the test aftertwo consecutive blows; (d) penetration of the pounder. Utilisingthese parameters, the crater volume is computed and correctedconsidering the heave volume by plotting effective penetrationvolume versus the number of blows.Consequently, the following parameters are adapted <strong>for</strong> the<strong>improvement</strong> scheme to be applied at the site.Full height of drop : 20.0 mNumber of blows : Pillars without pre-excavation(under slabs-on-grade): 15 blowsPillars with pre-excavation (under footings):20 blowsPhases of work :− Phase 1 : pillars under slabs-on-grade without excavation− Phase 2 : pillars <strong>for</strong> footing with pre-excavation− Ironing <strong>for</strong> improving the first meters of the column− Partial backfilling of the print with granular material while<strong>for</strong>ming the column− Complete backfilling of the print up to elevation +1.5 m ofworking plat<strong>for</strong>mHowever, a comparison of the results of pressuremeter testsshowed that the <strong>improvement</strong> was not effected with the presenceof pre-excavation in clay layer. Consequently the job parameterswere modified and adapted as given below :Full height of drop : 20.0 mNumber of blows : 20 blowsOne phase of work (No pre-excavation) with ironing <strong>for</strong> improvingthe first meters of the column following the pillar construction.5.2 Dynamic Replacement DesignThe design <strong>for</strong> the Heavy Dynamic Replacement/Dynamic Replacementpillars has been realised by Menard Soltaritementbased on the foundation layout. The design is summarised in Table4.Table 4. The <strong>soil</strong> <strong>improvement</strong> design <strong>for</strong> <strong>Carrefoursa</strong>-Izmir siteArea Structure Type Pounder No of pillars/ Energy perblowTransition Slab-on-grade DR 15 tons 1/300 tmStructuralSlab HDR 15 t/25 t 1/300 tm -1/500Footing load < 100 t 25 t 1/500 tm100 t
to the elevation of 3.0 m, between the pillars as expected, whilethe increase within the sand layer with the effect of dynamiccompaction is quite significant. It is seen that the attained levelsof <strong>improvement</strong> between the pillars varied between 30 per centand +100 per cent within the sand layer. In addition, depth of influence<strong>for</strong> the dynamic consolidation is estimated as being 11.0m in between pillars and 13.0 m <strong>for</strong> pillar locations also takinginto account the 1.5 m thick working plat<strong>for</strong>m. There<strong>for</strong>e theconstant given as variable from 0.3 to 0.7 in Equation 1 is estimatedapproximately as 0.6 <strong>for</strong> pillar location and 0.5 in betweenpillars based on the average pressuremeter parameters <strong>for</strong> theIzmir <strong>Carrefoursa</strong> site. Maximum <strong>improvement</strong> occurred withinthe upper 7.0 m in between the pillars (~0.64 of the effectivedepth) while scattered levels of <strong>improvement</strong> was achievedthroughout the effective depth at the pillar locations.elevation (m)5.00.0-5.0-10.0-15.0-20.0-25.0-30.0Figure 4. Comparison of average net limit pressure values obtained atpillar locations be<strong>for</strong>e and after <strong>soil</strong> <strong>improvement</strong>The control of <strong>improvement</strong> efficiency with CPTs realised betweenpillars showed a less pronounced effect compared to theresults of pressuremeter tests. There<strong>for</strong>e it could be concludedthat CPT testing has a more important role in determining the detailed<strong>soil</strong> profile detecting the thin layers of sands and siltswhich could be susceptible to <strong>liquefaction</strong> and silty clays whichare not prone to <strong>liquefaction</strong>.6.1 Anti-Liquefaction CriteriaVariation of Pl with elevationPl (bars)0 20 40 60average-prel. Plaverage-after imp.-pillar location, PlThe <strong>liquefaction</strong> criterion is checked utilising the basic Seed andIdriss criteria updated in 1997 based on the Standard PenetrationTest (SPT) results by Menard. 15 boreholes were per<strong>for</strong>med andaccording to the testing results, factor of safety values <strong>against</strong><strong>liquefaction</strong> are estimated being greater than one except few le v-els. These levels are usually the silty and clayey layers as indicatedin nearby CPT test points. During the standard penetrationtests, representative samples were taken and fine contents ofthese samples are determined.The second criterion <strong>against</strong> <strong>liquefaction</strong> is set based on thecyclic pressuremeter modulus measuring the sensitivity of theimproved <strong>soil</strong> to repetitive strains cycle. The cyclic modulus iscomputed as the harmonic mean of the moduli at re-loading. Theratio of cyclic modulus to Menard modulus is calculated <strong>for</strong> eachdepth where the test is per<strong>for</strong>med. Fourteen boreholes with cyclicpressurremeter testing were per<strong>for</strong>med.According to the analyses done by the SPT and pressuremetermodulus approaches, the anti-<strong>liquefaction</strong> criteria are met <strong>for</strong> theimproved area.6.2 Settlement and Bearing Capacity CriteriaSettlement and bearing capacity criteria are checked utilising thepressuremeter results. The parameters are given below:− Compressibility parameters <strong>for</strong> HDR pillars constructed inupper clay layer− Bearing capacity of HDR pillars and upper clay− Compressibility parameter <strong>for</strong> total and differential settlementsin sand layerIn general it is concluded that design criteria are met inside thepillars and within the sand layer down to elevation of –11.5 m.For the purpose of checking the differential settlement criteria<strong>for</strong> sand layer, finite element analyses are also realised byMenard.6.3 Settlement Plates and Related EvaluationsIn order to observe the settlements throughout the site, settlementplates were installed at 18 different points.Analyses are done to estimate the maximum amount of settlementsutilising the results of settlement plates by Asaoka(1978) method. Expected settlements are in the order of 20 cm to30 cm. Preliminary settlement analyses realised <strong>for</strong> fill loadingwere given in Table 2. The estimated average ultimate settlementvalue is in the order of 32 cm. The settlement plates were installedone month after the construction of first 1.5 m high fill.There<strong>for</strong>e results of preliminary settlement analyses realised usingthe CPT data are in good accordance with the Asaoka analyses.7 ADDITIONAL LIQUEFACTION ANALYSES USING CPTAND SPT DATAAdditional <strong>liquefaction</strong> assessments are realised towards the applicationof the methodology defined by Robertson and Fear(1997) utilising both SPT and CPT data. For this purpose, datafrom CPT and SPT tests per<strong>for</strong>med between pillars and at thepillar locations following the <strong>improvement</strong> are used.The analyses are realised <strong>for</strong> an earthquake magnitude ofM=6.3 and lateral earthquake acceleration of a=0.3g. For thecalculation of final factor of safety <strong>against</strong> <strong>liquefaction</strong>, magnitudescaling factors suggested by Idriss are also applied. For theCPT analyses, the data from the tests realised between the pillarsare utilised. The estimated factor of safety values <strong>against</strong> <strong>liquefaction</strong>within the sand layer existing between the depths of 4.0m and 10.0 m are greater than one in general showing the effectivenessof the <strong>soil</strong> <strong>improvement</strong> application. There are levelswith factor of safety values less than one between the depths of10.0 m and 12.0 m at certain CPT locations. However taking intoaccount the overburden effect and the fact that more than 80 percent of the <strong>liquefaction</strong> data reported in the literature, belong tothe levels within the first 10 m from the ground surface, the le v-els below 10.0 m depth are considered unlikely to liquefy duringthe earthquake loading.In addition to the CPTs, SPTs in between and at the pillar locationswere realised and <strong>liquefaction</strong> analyses are per<strong>for</strong>med usingthese SPT data (Seed et al.1985). The main purpose of these