Stable Carbon and Nitrogen Isotope Discrimination and Turnover in ...
Stable Carbon and Nitrogen Isotope Discrimination and Turnover in ...
Stable Carbon and Nitrogen Isotope Discrimination and Turnover in ...

You also want an ePaper? Increase the reach of your titles
YUMPU automatically turns print PDFs into web optimized ePapers that Google loves.
Copeia, 2007(3), pp. 534–542<strong>Stable</strong> <strong>Carbon</strong> <strong>and</strong> <strong>Nitrogen</strong> <strong>Isotope</strong> <strong>Discrim<strong>in</strong>ation</strong> <strong>and</strong> <strong>Turnover</strong> <strong>in</strong> PondSliders Trachemys scripta: Insights for Trophic Study of Freshwater TurtlesJEFFREY A. SEMINOFF, KAREN A. BJORNDAL, AND ALAN B. BOLTENThe ecologies of vertebrate species have been <strong>in</strong>creas<strong>in</strong>gly studied via stable isotopeanalyses of small quantities of body tissues. However, critical assumptions relat<strong>in</strong>g tothe consistency <strong>in</strong> stable isotopic values <strong>in</strong> consumer tissues <strong>and</strong> their diet as well as therate of <strong>in</strong>corporation of diet-derived stable isotopes <strong>in</strong>to consumer tissues rema<strong>in</strong>poorly validated for most taxa despite numerous stable isotope studies target<strong>in</strong>gnatural systems. In this study, we measured stable carbon <strong>and</strong> nitrogen diet–tissuediscrim<strong>in</strong>ation <strong>and</strong> elemental turnover <strong>in</strong> whole blood, red blood cells, blood plasma,bra<strong>in</strong>, liver, pectoralis major muscle, pubioshiofemoralis <strong>in</strong>ternus muscle, stratumcorneum (sc) dermis, <strong>and</strong> stratum germ<strong>in</strong>ativum (sg) dermis of Pond Sliders(Trachemys scripta) fed ad libitum on two isotopically dist<strong>in</strong>ct diets. Turtles were feda soy-based control diet (32% prote<strong>in</strong>, 3% lipids, 4% fiber), <strong>and</strong> after 146 d, a subsetwas switched to a fish meal-based experimental diet (44% prote<strong>in</strong>, 24% lipids, 3%fiber). At the diet switch, diet–tissue isotopic equilibrium could not be confirmed byd 13 C values for any tissue, but was established for d 15 N values for all tissues except scdermis <strong>and</strong> sg dermis (range 5 +1.9 to +3.8%). An exponential-decay regression model<strong>and</strong> half-life calculation resulted <strong>in</strong> half-lives for N rang<strong>in</strong>g from 35.6 d (blood plasma)to 52.5 d (liver). These represent the first published stable isotope turnover rates forreptiles <strong>and</strong> the first diet–tissue isotopic discrim<strong>in</strong>ation factors for freshwater turtles.The discrim<strong>in</strong>ation factors found here are similar to those established for soft-tissuesamong other vertebrate taxa; however, elemental nitrogen turnover rates <strong>in</strong> tissues ofT. scripta are among the slowest established to date among vertebrate taxa.STABLE carbon <strong>and</strong> nitrogen isotope analysishas become a common method for determ<strong>in</strong><strong>in</strong>gthe trophic status <strong>and</strong> orig<strong>in</strong>s of nutrientresources for wildlife populations. Dietary <strong>in</strong>ferencesbased on stable isotopic profiles <strong>in</strong> animaltissues are possible because the isotope compositionsof a consumer’s body tissues are ultimatelyderived from those <strong>in</strong> its diet (DeNiro <strong>and</strong>Epste<strong>in</strong>, 1978, 1981; Hobson <strong>and</strong> Clark, 1992a).With<strong>in</strong> the Reptilia, these exam<strong>in</strong>ations havecentered primarily on sea turtles (Godley et al.,1998; Hatase et al., 2002; Biasatti, 2004; Wallaceet al., 2006), although lizards have been exam<strong>in</strong>edto a lesser extent (Magnusson et al., 2001;Struck et al., 2002). However, the large speciesrichness <strong>and</strong> dietary diversity <strong>in</strong> reptiles suggestthat stable isotope analyses can be appliedbroadly among reptiles to elucidate their positionwith<strong>in</strong> a variety of trophic pathways. Further,the small body size of many reptile species limitsthe collection of stomach <strong>and</strong>/or fecal samplessuch that stable isotope analyses of small quantitiesof sk<strong>in</strong> or other tissues may be the only noneuthanasiatechnique available for determ<strong>in</strong><strong>in</strong>gtheir diet strategies.<strong>Stable</strong> isotope ratios for carbon ( 13 C/ 12 C,expressed as d 13 C) <strong>and</strong> nitrogen ( 15 N/ 14 N,expressed as d 15 N) of consumer <strong>and</strong> prey tissuesare usually not identical, <strong>and</strong> <strong>in</strong>stead exhibitpredictable differences due to selectivity forlighter isotopes dur<strong>in</strong>g a consumer’s metabolicprocesses (DeNiro <strong>and</strong> Epste<strong>in</strong>, 1978, 1981).These differences, caused by isotopic discrim<strong>in</strong>ation(Farquhar et al., 1982), vary among tissues<strong>and</strong> taxa, but are often between 0% to +1% ford 13 C, <strong>and</strong> +3% to +5% for d 15 N per trophic levelfor soft tissues (DeNiro <strong>and</strong> Epste<strong>in</strong>, 1978, 1981;M<strong>in</strong>iwaga <strong>and</strong> Wada, 1984; Peterson <strong>and</strong> Fry,1987). Thus d 13 C values more effectively describedifferent carbon sources (DeNiro <strong>and</strong> Epste<strong>in</strong>,1978; Peterson <strong>and</strong> Fry, 1987; Rubenste<strong>in</strong> <strong>and</strong>Hobson, 2004), whereas d 15 N values are usefulfor identification of trophic level or trophicstructure of the organism or system of <strong>in</strong>terest(M<strong>in</strong>iwaga <strong>and</strong> Wada, 1984; Peterson <strong>and</strong> Fry,1987).Incorporation of diet-derived stable isotopicsignatures <strong>in</strong>to consumer body tissues occurs atvary<strong>in</strong>g rates based primarily on tissue-specificmetabolism (Gannes et al., 1997). As a result,different tissues may provide dietary <strong>in</strong>formationthat is <strong>in</strong>tegrated over different time scales.Tissues with higher metabolic activity (liver,whole blood) will reflect more recent diethistory, <strong>and</strong> those with lower metabolism (<strong>in</strong>tegument,bone) will represent an <strong>in</strong>tegration ofdiet over a substantially longer period, perhapsapproach<strong>in</strong>g the full life of the consumer# 2007 by the American Society of Ichthyologists <strong>and</strong> Herpetologists
SEMINOFF ET AL.—STABLE ISOTOPES IN TRACHEMYS 535(Tieszen et al., 1983; Hobson <strong>and</strong> Clark, 1992b).<strong>Stable</strong> isotope analyses of multiple tissues cantherefore reveal temporal diet shifts by consumers.By provid<strong>in</strong>g <strong>in</strong>formation on nutrientsassimilated over extended periods, this techniqueis much less affected by short-termtemporal change <strong>in</strong> diet than conventionaldietary analyses (i.e., stomach content analysis,fecal analysis), which only provide dietary ‘snapshots’of recently consumed food items.Knowledge of the patterns of stable isotope<strong>in</strong>corporation <strong>in</strong>to body tissues of wildlife speciesis required to <strong>in</strong>terpret field data correctly.Controlled laboratory studies of isotopic discrim<strong>in</strong>ation<strong>and</strong> elemental turnover for reptiles havefocused on sea turtles (Sem<strong>in</strong>off et al., 2006; K.Reich, unpubl. data), <strong>and</strong> there have been noexam<strong>in</strong>ations of these aspects <strong>in</strong> freshwaterturtles. Consider<strong>in</strong>g the osmoregulatory differencesbetween mar<strong>in</strong>e <strong>and</strong> freshwater turtles(Bentley, 1976; Lutz, 1997), <strong>and</strong> the substantialvariability <strong>in</strong> isotopic discrim<strong>in</strong>ation <strong>and</strong> turnoverreported with<strong>in</strong> other taxa, determ<strong>in</strong><strong>in</strong>gthese aspects for freshwater turtles is requiredbefore stable isotopes can be used reliably fordietary reconstructions with<strong>in</strong> this clade.In this study, we measured stable carbon <strong>and</strong>nitrogen isotopic diet–tissue discrim<strong>in</strong>ation <strong>and</strong>turnover <strong>in</strong> body tissues of an emydid turtle, thePond Slider (Trachemys scripta), which is known toeat both plant <strong>and</strong> animal matter <strong>in</strong> the wild. Wechose this omnivorous species due to its hard<strong>in</strong>ess<strong>in</strong> captivity, its variable diets, <strong>and</strong> theextensive <strong>in</strong>formation on the biology of thisspecies (Gibbons, 1990). The use of stableisotopes to answer ecological questions aboutfreshwater turtles will <strong>in</strong>crease. Species- <strong>and</strong> dietspecificdiscrim<strong>in</strong>ation factors <strong>and</strong> turnover rateswill allow accurate <strong>in</strong>terpretations of the datagenerated from these <strong>in</strong>vestigations.MATERIALS AND METHODSThirty Trachemys scripta <strong>in</strong>dividuals were capturedfrom ponds at the Savannah River EcologicalLaboratory (Aiken, South Carol<strong>in</strong>a) <strong>and</strong>housed at the animal vivaria at the Departmentof Zoology, University of Florida (Ga<strong>in</strong>esville)from October 2001 to September 2002. A uniquenumber applied with acrylic pa<strong>in</strong>t on theposterior-most central scute identified eachturtle. Turtles were ma<strong>in</strong>ta<strong>in</strong>ed <strong>in</strong> <strong>in</strong>door tankswith a water depth of 20 cm <strong>and</strong> a bask<strong>in</strong>gplatform. The enclosures were kept at 26 C <strong>and</strong>lighted for 12 h each day with a 20-W fullspectrum natural fluorescent bulb (Vita-Lite)<strong>and</strong> a 60-W outdoor floodlight for bask<strong>in</strong>g. Studyanimals <strong>in</strong>cluded only large immature <strong>and</strong> adultmales (mean <strong>in</strong>itial curved carapace length 518.8 6 0.4 cm, range 5 15.5–24.0 cm) to m<strong>in</strong>imizepotential effects of body size, growth, <strong>and</strong>reproduction on isotope values.We carried out a diet-switch experiment <strong>in</strong>which turtles were fed ad libitum on two commercialturtle pellet foods (Melick Aquafeed, Catawissa,PA). Turtles were <strong>in</strong>itially ma<strong>in</strong>ta<strong>in</strong>ed ona control diet (Diet A) hav<strong>in</strong>g soy meal as theprimary prote<strong>in</strong> source (32% prote<strong>in</strong>, 3% lipids,4% fiber); a subset of turtles was switched to anexperimental diet (Diet B) that had fish meal asthe primary prote<strong>in</strong> source (44% prote<strong>in</strong>, 24%lipids, 3% fiber). Both diets were from s<strong>in</strong>glecommercial batches. Analysis of variance (AN-OVA) tests demonstrated that lipid-free diet d 13 C<strong>and</strong> d 15 N values rema<strong>in</strong>ed constant throughoutthe course of this study for both Diet A (F 1,7 50.629, P <strong>Carbon</strong> 5 0.63, n 5 8; F 1,7 5 0.011, P <strong>Nitrogen</strong>5 0.92, n 5 8) <strong>and</strong> Diet B (F 1,5 5 0.62, P <strong>Carbon</strong> 50.47, n 5 6; F 1,5 5 0.68, P <strong>Nitrogen</strong> 5 0.45, n 5 6).<strong>Stable</strong> carbon <strong>and</strong> nitrogen isotope values of lipidfreecontrol <strong>and</strong> experimental diets differed by3.3% <strong>and</strong> 5.7%, respectively (Table 1). Thesedifferences were considered to be of sufficientmagnitude to monitor isotopic changes <strong>in</strong> bodytissues of the turtles <strong>in</strong> response to a dietary shiftfrom Diet A to Diet B.All turtles underwent a 146-day acclimationperiod on Diet A to equilibrate the stableisotope composition of soft tissues <strong>in</strong> all turtlesbefore the switch to Diet B. Turtles were thenassigned to a control group (n 5 9) <strong>and</strong> anexperimental group (n 5 21). Control turtleswere ma<strong>in</strong>ta<strong>in</strong>ed on Diet A, <strong>and</strong> five of thoseturtles were r<strong>and</strong>omly selected <strong>and</strong> humanelyeuthanized with an <strong>in</strong>jection of sodium pentobarbital(130 mg/kg of turtle) at the start of thetreatment (Day 146) <strong>and</strong> the rema<strong>in</strong><strong>in</strong>g fourwere euthanized at the end (Day 338). Fromthe experimental group, three turtles werer<strong>and</strong>omly selected <strong>and</strong> euthanized after ma<strong>in</strong>tenanceon Diet B for each of 4, 8, 16, 32, 64,128, <strong>and</strong> 192 d. To reduce the effects of bodysize, one turtle from each of three stratified sizegroups was r<strong>and</strong>omly selected for each sampl<strong>in</strong>gperiod (mean body mass of turtles rema<strong>in</strong>edconsistent among all sampl<strong>in</strong>g periods: F 7,25 50.297, P 5 0.95). Prior to sacrifice, ca. 0.25 mlof blood was collected from each turtle via thebrachial artery with a 21-gauge needle <strong>and</strong>syr<strong>in</strong>ge <strong>and</strong> transferred to a non-hepar<strong>in</strong>izedconta<strong>in</strong>er (Frische et al., 2001). Approximatelyhalf of each blood sample was promptlyseparated <strong>in</strong>to plasma <strong>and</strong> cellular componentsby centrifugation. We then collected 0.25–2.0 g(wet mass) of bra<strong>in</strong>, liver, pectoralis major(pm) muscle, pubioshiofemoralis <strong>in</strong>ternus (pi)
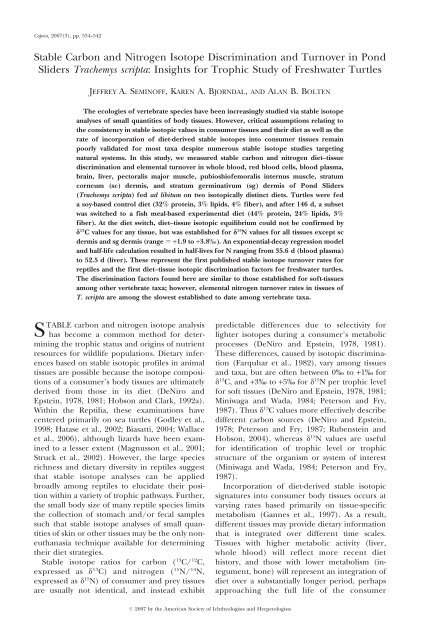
SEMINOFF ET AL.—STABLE ISOTOPES IN TRACHEMYS 537to reveal significant differences <strong>in</strong> D dt amongtissues.To determ<strong>in</strong>e the duration for isotope turnoversubsequent to the diet shift, we fitted anexponential-decay curve of the form y 5 a + be ct(Hobson <strong>and</strong> Clark, 1992b) to the <strong>in</strong>dividual d 13 C<strong>and</strong> d 15 N values for each tissue dur<strong>in</strong>g eachsampl<strong>in</strong>g period us<strong>in</strong>g non-l<strong>in</strong>ear regression.Due to unexpectedly slow elemental turnover,we omitted the ‘blood-only’ sample periods fromDay 2 to Day 28 (Fig. 1). We excluded one turtlefrom all analyses because its d 13 C <strong>and</strong> d 15 Nsignatures were statistical outliers, most likelyrelated to a unique dietary history prior to its<strong>in</strong>clusion <strong>in</strong> this study. In the exponential decayequation, y equals d 13 C or d 15 N at time t,a represents the value be<strong>in</strong>g approached asymptotically,b equals the overall change <strong>in</strong> isotopiccomposition after the diet is switched, <strong>and</strong> c,which is the component we solved for, is thefractional turnover of the respective isotopes <strong>in</strong>each tissue (Hobson <strong>and</strong> Clark, 1992b). Pseudoreplicationwas likely not a factor s<strong>in</strong>ce all tissuesexcept blood came from different turtles, <strong>and</strong>blood was sampled <strong>in</strong>frequently from any oneturtle.<strong>Turnover</strong> rates are expressed <strong>in</strong> terms of halflife.To estimate the half-life (t 1/2 ) from fractionalturnover (c) we used the equation t 1/2 5ln(0.5)/c, where t 1/2 is the time <strong>in</strong> days <strong>in</strong> whichhalf of the stable-carbon <strong>and</strong> -nitrogen isotopeswere exchanged <strong>in</strong> the correspond<strong>in</strong>g tissue, <strong>and</strong>0.5 represents the exchange of 50% of theisotopes. We fit the exponential curves withSigma Plot (Systat, Pt. Richmond, CA); all othercalculations were performed us<strong>in</strong>g JMP software(SAS, Belmont, NY). Means are followed byst<strong>and</strong>ard error (6 SE) unless otherwise noted.RESULTSNutritional <strong>in</strong>take <strong>and</strong> body mass changes.—Weobserved feed<strong>in</strong>g by all turtles throughout thestudy; however, some turtles tended to forage lessvoraciously for a short period (,7 d) after thediet shift. Body mass did not decrease <strong>in</strong> anyturtle, although the frequency of measurement(once every 2 mo) may have been <strong>in</strong>sufficient toreflect any short-term mass decreases. The meanf<strong>in</strong>al body mass of turtles (868 6 60 g, range 5485–1648 g, n 5 29) was significantly greaterthan the mean body mass on Day 0 (842 6 58 g,range 5 442–1551, n 5 29; paired t-test, t 523.89, P , 0.01), <strong>in</strong>dicat<strong>in</strong>g that growth mayhave affected the stable isotope compositions ofat least some turtles. No turtle showed a netdecrease between their <strong>in</strong>itial <strong>and</strong> f<strong>in</strong>al mass.Fig. 1. <strong>Stable</strong> carbon values of blood plasma,<strong>and</strong> stable nitrogen values of blood plasma, wholeblood, <strong>and</strong> liver for Trachemys scripta as a function oftime s<strong>in</strong>ce their diet was switched from the controlto the experimental diet. Data are means (solidcircles) 6 SE (vertical l<strong>in</strong>es), <strong>and</strong> sample sizes are n5 4 for each po<strong>in</strong>t except Day 0 (n 5 5), Day 6 (n 53), <strong>and</strong> Day 16 (n 5 3). Exponential-decay regressionl<strong>in</strong>es of the form y 5 a + be ct (Hobson <strong>and</strong>Clark, 1992b) were fitted to <strong>in</strong>dividual values foreach sample period. Half-life (t 1/2 ) is calculated ast 1/2 5 ln(0.5)/c. Open circles represent samplemeans excluded from model fitt<strong>in</strong>g (see text).<strong>Isotope</strong> discrim<strong>in</strong>ation.—The d 13 C <strong>and</strong> d 15 N valuesfor soft tissues of T. scripta reared on Diet A arepresented <strong>in</strong> Table 2. Among the n<strong>in</strong>e tissuesexam<strong>in</strong>ed, tissue-specific mean d 13 C values rangedfrom 220.0 6 0.3% to 218.0 6 1.6% on Day 146,<strong>and</strong> from 221.0 6 0.4% to 218.9 6 0.3% on Day
538 COPEIA, 2007, NO. 3TABLE 2. MEAN STABLE ISOTOPIC SIGNATURES FOR Trachemys scripta TISSUES FROM THE CONTROL GROUP (MAINTAINEDON DIET A) ON Day 146 (n 5 5) AND DAY 338 (n 5 4). T-statistics <strong>and</strong> P-values compare isotopic values at Day 146 vs.Day 338. We concluded that tissues rema<strong>in</strong><strong>in</strong>g isotopically unchanged between these two periods were atequilibrium with Diet A at Day 146, except sc dermis <strong>and</strong> sg dermis (see text).<strong>Carbon</strong>(d 13 C) <strong>Nitrogen</strong> (d 15 N)TissueDay 146 (%) Day 338 (%) t-statistic P-value Day 146 (%) Day 338 (%) t-statistic P-valuewhole blood 219.2 6 0.1 220.1 6 0.2 4.41 ,0.01 +7.1 6 0.1 +7.0 6 0.2 0.22 0.42red blood cells 218.7 6 0.2 219.9 6 0.3 3.91 ,0.01 +6.7 6 0.2 +6.7 6 0.3 0.19 0.43blood plasma 219.6 6 0.1 220.2 6 0.1 3.22 ,0.01 +8.6 6 0.1 +8.6 6 0.2 20.16 0.44bra<strong>in</strong> 218.4 6 0.1 218.9 6 0.3 2.68 0.03 +8.0 6 0.3 +7.8 6 0.2 0.49 0.32liver 220.0 6 0.3 221.0 6 0.4 2.08 0.04 +7.6 6 0.2 +7.9 6 0.2 21.12 0.15pm muscle 219.0 6 0.2 219.7 6 0.3 2.18 0.04 +7.7 6 0.3 +7.6 6 0.2 0.15 0.44pi muscle 218.8 6 0.3 219.5 6 0.4 2.20 0.03 +8.4 6 0.3 +8.3 6 0.4 0.18 0.43sc dermis 218.9 6 0.9 220.1 6 0.4 0.99 0.18 +9.8 6 0.4 +8.4 6 0.4 1.82 0.06sg dermis 218.0 6 1.6 219.9 6 0.5 0.86 0.21 +11.6 6 0.7 +9.3 6 0.6 2.19 0.03338. Mean d 15 N values ranged from +6.7 6 0.2%to +11.6 6 0.7% on Day 146, <strong>and</strong> from +6.7 60.3% to +9.3 6 0.6% on Day 338. Whereas d 13 Ccomparisons between Day 146 <strong>and</strong> Day 338suggest that sc dermis <strong>and</strong> sg dermis achievedisotopic equilibrium with Diet A prior to the dietswitch, comparisons of the d 15 N values <strong>in</strong>dicatethat all tissues except sg dermis were <strong>in</strong> isotopicequilibrium with Diet A (Table 3). Concern<strong>in</strong>gsg dermis <strong>and</strong> sc dermis, although the Student’st-tests are <strong>in</strong>dicative of diet–tissue isotopic equilibrium,the large variance <strong>in</strong> the isotope values<strong>and</strong> marg<strong>in</strong>al non-significance for these tissuessuggest a large potential for Type II error(Table 3). The slower turnover of dermal tissuesafter the diet switch further suggests that thesetissues would be the last of any tissues exam<strong>in</strong>edto reach isotopic equilibrium. Based on theseconsiderations, we do not report Diet A D dtvalues for either of the dermal tissues. Thus, theD dt factors for turtles reared on Diet A arepresented for nitrogen only (Table 3). All seventissues were significantly 15 N-enriched relative toDiet A, but whole blood <strong>and</strong> red blood cells weresignificantly less enriched than the other tissues,<strong>and</strong> blood plasma was significantly moreenriched than all but pi muscle (Tukey HSD, P, 0.01; Table 3).The lack of apparent d 13 C-equilibration betweenT. scripta tissues <strong>and</strong> Diet B precluded thedeterm<strong>in</strong>ation Diet B D dt factors for carbon.Thus, Diet B D dt factors are only calculated fornitrogen <strong>in</strong> those tissues that showed a significantfit to the exponential decay model (i.e., bloodplasma, whole blood, <strong>and</strong> liver; Table 3). Bloodplasma was significantly more enriched <strong>in</strong> 15 Nrelative to whole blood <strong>and</strong> liver (Tukey HSD, P, 0.01; Table 3). These Diet B D dt values fornitrogen should be viewed with caution s<strong>in</strong>ceasymptotes <strong>in</strong> the exponential decay curves werenot clearly reached prior to the close of thestudy.<strong>Isotope</strong> turnover rates.—Although not all tissueshad clearly equilibrated with Diet A by the end ofthe <strong>in</strong>itial phase of this study, most showed a shiftTABLE 3. STABLE-NITROGEN ISOTOPE DISCRIMINATION FACTORS AND ELEMENTAL HALF-LIFE ESTIMATES FOR SOFT TISSUESOF Trachemys scripta. See Table 1 for description of diets. Results of the Tukey HSD test are <strong>in</strong>dicated bysuperscripts, where means hav<strong>in</strong>g at least one superscript <strong>in</strong> common are not significantly different.Ddt (%)TissueDiet ADiet Bt1/2 (days) Diet Bwhole blood +2.2 6 0.2 a 20.8 6 0.8 a 38.7red blood cells +1.9 6 0.3 a — —blood plasma +3.8 6 0.1 b +2.5 6 0.8 b 35.6liver +3.0 6 0.3 c +0.4 6 0.5 a 52.5bra<strong>in</strong> +2.9 6 0.3 c — —pm muscle +2.7 6 0.3 c — —pi muscle +3.4 6 0.4 b — —
SEMINOFF ET AL.—STABLE ISOTOPES IN TRACHEMYS 539toward the d 13 C <strong>and</strong> d 15 N signatures of Diet Bafter the diet switch. The exponential decaymodels showed a significant fit for carbon <strong>in</strong>blood plasma, <strong>and</strong> nitrogen <strong>in</strong> blood plasma,whole blood, <strong>and</strong> liver (non-l<strong>in</strong>ear regression, P, 0.05; Fig. 1). For carbon, however, becauseblood plasma had not reached isotopic equilibriumwith Diet A dur<strong>in</strong>g the acclimation period,we have low confidence <strong>in</strong> the exponential decaymodel results <strong>and</strong> therefore do not report thet 1/213C for this tissue. For nitrogen, the half-lifedurations <strong>in</strong> blood plasma, whole blood, <strong>and</strong>liver were 35.6 d, 38.7 d, <strong>and</strong> 52.5 d, respectively(Fig. 1; Table 3). Because turnover is reachedafter approximately four half-lives (Hobson,1993; Martínez del Rio <strong>and</strong> Wolf, 2005), weestimate that nitrogen turnover times <strong>in</strong> bloodplasma, whole blood, <strong>and</strong> liver are 142 d, 155 d,<strong>and</strong> 210 d, respectively. Although we did notestimate t 1/215N for the rema<strong>in</strong><strong>in</strong>g tissues due totheir lack of significant curve fits, the fact thatstable-nitrogen changes did not show a significantfit to the exponential decay model <strong>in</strong>dicates thatthe turnover times must be greater than192 days. Furthermore, the apparent lack ofstable carbon isotope diet–tissue equilibriumsuggests that carbon turnover time is longer than146 days, the duration of the acclimation period.DISCUSSIONMeasur<strong>in</strong>g stable isotope discrim<strong>in</strong>ation <strong>and</strong>elemental turnover <strong>in</strong> emydid turtles is a necessaryprocess to enable the correct <strong>in</strong>terpretationof field data generated for this group. In thisstudy we provide the first stable isotope <strong>in</strong>formationfor Trachemys scripta, one of the mostabundant <strong>and</strong> widespread of all freshwater turtles(Gibbons, 1990). Although reliable stable carbonisotope values proved elusive, we were able toestimate nitrogen isotope discrim<strong>in</strong>ation <strong>and</strong>turnover values for T. scripta tissues that reachedisotopic equilibrium with the experimental diets.Of the seven tissues for which we calculatedDiet A D dt15N (range 5 +1.9% to +3.8%), allwere with<strong>in</strong> the range of values established forother vertebrate taxa. In soft-tissues of birds <strong>and</strong>mammals, D dt15N factors range from +0.2% to+5.2% (Hobson <strong>and</strong> Clark, 1992a; Kurle, 2002;Klaassen et al., 2004), whereas those for fish are+2.3% to +5.0% (Hessle<strong>in</strong> et al., 1993; P<strong>in</strong>negar<strong>and</strong> Polun<strong>in</strong>, 1999). For the Green Sea Turtle,Chelonia mydas, D dt15N factors range from +0.22%to +2.92% (Sem<strong>in</strong>off et al., 2006). In addition tothe consistencies <strong>in</strong> the overall range of discrim<strong>in</strong>ation,we found similarities <strong>in</strong> the relativediscrim<strong>in</strong>ation levels between tissues of T. scriptawith homologous tissues of other vertebrates. Forexample, the pattern of greater D dt15N <strong>in</strong> T.scripta blood plasma (+3.8%) versus red bloodcells (+1.9%) was also found <strong>in</strong> a variety of bird(Pearson et al., 2003; Evans Ogden et al., 2004)<strong>and</strong> mammal species (Roth <strong>and</strong> Hobson, 2000;Lesage et al., 2002; Klaassen et al., 2004).The observed D dt15N differences among thetissues of T. scripta <strong>and</strong> <strong>in</strong> tissues of other specieslikely were caused, at least <strong>in</strong> part, by variations <strong>in</strong>the prote<strong>in</strong> <strong>and</strong> am<strong>in</strong>o acid compositions ofdifferent tissues s<strong>in</strong>ce these components c<strong>and</strong>iffer <strong>in</strong> their nitrogen isotope content (Peterson<strong>and</strong> Fry, 1987). As suggested previously, thecompositional differences may result from selectiverout<strong>in</strong>g of exogenous nutrients dur<strong>in</strong>g tissuema<strong>in</strong>tenance <strong>and</strong> construction, <strong>and</strong> from differentialmobilization of endogenous resources <strong>in</strong>totissues or tissue components (Macrae <strong>and</strong> Reeds,1980; Peterson <strong>and</strong> Fry, 1987; Gannes et al.,1997). In addition, loss of heavier or lighterisotopes via cellular metabolism may have playeda role <strong>in</strong> the differences among tissues (Ganneset al., 1997; Martínez del Rio <strong>and</strong> Wolf, 2005).However, we are unable to ascerta<strong>in</strong> the relativecontributions of these factors to our resultsbecause of the unknown isotopic differencesamong dietary nutrients <strong>and</strong> body tissue components.Elucidat<strong>in</strong>g the relationships between ananimal’s diet <strong>and</strong> the fate of assimilated dietarycomponents, synthesized components, <strong>and</strong> endogenousnutrients will be important to fullydeterm<strong>in</strong>e the biochemical mechanisms of isotopediscrim<strong>in</strong>ation.In addition to stable-nitrogen isotope discrim<strong>in</strong>ation,we derived estimates of elementalnitrogen turnover <strong>in</strong> three T. scripta soft tissuesthat showed a significant fit to the model curve.The half-lives found here (35.6–52.5 d) areamong the longest reported to date, <strong>and</strong> oftenan order of magnitude greater than those ofhomologous tissues <strong>in</strong> other vertebrate species.For example, half-lives among birds <strong>and</strong> mammalsrange from 1.7 d to 3.5 d <strong>in</strong> blood plasma(Hilderbr<strong>and</strong> et al., 1996; Pearson et al., 2003)<strong>and</strong> from 0.5 d to 15.7 d <strong>in</strong> whole blood(Bearhop et al., 2002; Hobson <strong>and</strong> Bairle<strong>in</strong>,2003; Pearson et al., 2003; Evans Ogden et al.,2004). Although the extended longevity ofnucleated red blood cells <strong>in</strong> T. scripta (#11 mo,Frische et al., 2001) likely affected the N half-life<strong>in</strong> whole blood, we believe the greater N half-lives<strong>in</strong> T. scripta result from the lower basal metabolism<strong>and</strong> correspond<strong>in</strong>gly slower prote<strong>in</strong> turnover<strong>in</strong> poikilotherms versus homeotherms (Bennett<strong>and</strong> Dawson, 1976; Else <strong>and</strong> Hulbert, 1981;McNab, 2002). In support, Martínez del Rio <strong>and</strong>Wolf (2005) suggest that fractional isotopic<strong>in</strong>corporation <strong>in</strong>to body tissues is roughly pro-
540 COPEIA, 2007, NO. 3portional to prote<strong>in</strong> turnover <strong>and</strong> that slowmetabolism may thereby reduce the uptake ofendogenous prote<strong>in</strong> components for tissuema<strong>in</strong>tenance <strong>and</strong> growth.With respect to carbon, our derivations ofdiscrim<strong>in</strong>ation <strong>and</strong> half-life were hampered bya lack of apparent isotopic equilibrium betweenturtle tissues <strong>and</strong> captive diets <strong>and</strong> the poor fits ofthe exponential decay model. The apparent lowrates of diet-derived carbon <strong>in</strong>tegration <strong>in</strong>tobody tissues is <strong>in</strong>trigu<strong>in</strong>g, particularly for tissuesof high metabolic activity (blood plasma, liver).Assum<strong>in</strong>g that consumer tissues ma<strong>in</strong>ta<strong>in</strong> steadystate isotopic equilibrium with their diet, perhapsthe feed<strong>in</strong>g trials were of <strong>in</strong>sufficientduration to allow for d 13 C equilibration of T.scripta tissues with the captive diets. However,although no tissues equilibrated with the carbonisotope composition of the diet, the trialduration was sufficient for the <strong>in</strong>tegration ofDiet A d 15 N values <strong>in</strong>to most tissues. Thisdichotomy suggests that carbon <strong>and</strong> nitrogenmay become decoupled dur<strong>in</strong>g metabolic processes<strong>and</strong> raises <strong>in</strong>terest<strong>in</strong>g questions about themetabolic pathways responsible for uptake ofexogenous carbon <strong>and</strong> nitrogen. Interest<strong>in</strong>gly,Hobson <strong>and</strong> Stirl<strong>in</strong>g (1997) report a lack of<strong>in</strong>tegration of dietary carbon <strong>in</strong>to body tissues ofpolar bears (Ursus maritimus), <strong>and</strong> Voigt et al.(2003) report dramatically slow <strong>in</strong>corporation ofdietary carbon <strong>in</strong>to tissues of two nectar-feed<strong>in</strong>gbat species. However, there is little <strong>in</strong>formationon the uncoupl<strong>in</strong>g of elemental carbon<strong>and</strong> nitrogen dur<strong>in</strong>g metabolic processes, norare there sufficient data on the relative<strong>in</strong>put of endogenous versus exogenous carbon<strong>and</strong> nitrogen to adequately <strong>in</strong>terpret theseresults.The lack of apparent changes <strong>in</strong> the d 13 Cvalues of T. scripta tissues after the diet switchmay also relate to composition of the experimentaldiets. Perhaps the differences <strong>in</strong> d 13 Cvalues between Diet A <strong>and</strong> Diet B were not ofsufficient magnitude to adequately measureturnover (1.6% for Diet B-A with lipids; 3.3%for Diet B-A without lipids). This possibility isparticularly relevant consider<strong>in</strong>g the relativelyhigh variance <strong>in</strong> d 13 C values among tissues foreach sampl<strong>in</strong>g period (Fig. 1). However, a morelikely scenario relates to the high lipid concentration<strong>in</strong> Diet B. Because lipids are depleted <strong>in</strong>13C relative to prote<strong>in</strong> <strong>and</strong> carbohydrates (De-Niro <strong>and</strong> Epste<strong>in</strong>, 1978; Peterson <strong>and</strong> Fry, 1987),differential <strong>in</strong>tegration of these dietary macromolecules<strong>in</strong>to body tissues may result <strong>in</strong> isotopediscrim<strong>in</strong>ation values that are unexpected basedon the isotopic compositions of whole diet. Inthis case, despite the overall lesser 13 C-depletion<strong>in</strong> Diet B (d 13 C 5 221.9%) versus Diet A (d 13 C5 223.5%), the extremely high lipid content ofDiet B (24%) may have resulted <strong>in</strong> tissue carbonreservoirs that were more depleted <strong>in</strong> 13 C, theresult of which may be tissue d 13 C values thatapproach the expected values for turtlesma<strong>in</strong>ta<strong>in</strong>ed on Diet A. Thus, dietary carbonmay have been <strong>in</strong>tegrated but masked by lipidisotopic compositions. As with previous studiesemploy<strong>in</strong>g stable isotope analysis, our <strong>in</strong>terpretationsof carbon <strong>and</strong> nitrogen turnover (or lackthereof) would benefit greatly from a betterunderst<strong>and</strong><strong>in</strong>g of animal nutritional ecology,particularly relat<strong>in</strong>g to lipid assimilation (Stottet al., 1997; Schlechtriem et al., 2004).The results of this study <strong>in</strong>clude two importantf<strong>in</strong>d<strong>in</strong>gs that bear on the <strong>in</strong>terpretation of fieldisotopic data for assess<strong>in</strong>g trophic ecology offreshwater turtles. First, although D dt15N <strong>in</strong> thespecies is generally consistent with discrim<strong>in</strong>ationfactors established previously for homeothermic<strong>and</strong> poikilothermic vertebrates, the range <strong>in</strong>values (61.9% for Diet A <strong>and</strong> 63.3% for DietB) has substantial consequences on the calculationof trophic structure, nutrient sources, <strong>and</strong>diet composition. Recall that consumer tissuesare generally thought to be enriched <strong>in</strong> 15 N overtheir diet by 3–5% (DeNiro <strong>and</strong> Epste<strong>in</strong>, 1981;M<strong>in</strong>iwaga <strong>and</strong> Wada, 1984; Peterson <strong>and</strong> Fry,1987). With discrim<strong>in</strong>ation variability .3%, ourresults <strong>in</strong>dicate that calculation of trophic positionscould be erroneous by up to a full trophicstep if the correct tissue-specific D dt value is notused. This underscores the importance of elucidat<strong>in</strong>gthe isotope discrim<strong>in</strong>ation factors for eachtissue type prior to its use for mak<strong>in</strong>g <strong>in</strong>ferencesabout the trophic status of study organisms.Second, the turnover of blood <strong>and</strong> liver nitrogenis substantially slower than values reported previouslyfor most taxa. Our results <strong>in</strong>dicate that thetemporal diet histories of T. scripta reflected byisotopic analyses of tissues will be of long termnature, rang<strong>in</strong>g from˜ 5 to 7 months. While thissupports the value of us<strong>in</strong>g stable isotopes tomonitor dietary changes over the course of a yearor more, it <strong>in</strong>dicates that this technique is notappropriate for address<strong>in</strong>g <strong>in</strong>tra- <strong>and</strong> <strong>in</strong>ter-seasonalvariability <strong>in</strong> diet <strong>in</strong>take. However, isotopicdiscrim<strong>in</strong>ation <strong>and</strong> turnover <strong>in</strong> T. scripta may varyunder different environmental circumstances,particularly for turtles that are nutrient limited(Hobson et al., 1993). Field metabolic rates <strong>in</strong>wildlife species are often substantially higher thanmetabolic rates of captive animals (McNab,2002), <strong>and</strong> it is thus possible that tissue components<strong>in</strong> wild turtles turnover more rapidly thanthose <strong>in</strong> captivity. Based on these considerations,we encourage additional studies of T. scripta
SEMINOFF ET AL.—STABLE ISOTOPES IN TRACHEMYS 541reared <strong>in</strong> different sett<strong>in</strong>gs to elucidate the effectsof diet type, food availability, growth rate, <strong>and</strong>metabolic rate. Inquiries <strong>in</strong>to the stable isotopediet–tissue discrim<strong>in</strong>ation <strong>and</strong> turnover <strong>in</strong>additional reptile species should also be undertakento provide a better foundation for<strong>in</strong>terpret<strong>in</strong>g results of future isotopic studies <strong>in</strong>this diverse taxon.ACKNOWLEDGMENTSWe thank S. Bouchard, P. Eliazar, J. Gilmore,K. Moran, K. Reich, <strong>and</strong> F. Robb<strong>in</strong>s for laboratoryassistance <strong>and</strong> J. Curtis for isotope analysis. J.Gibbons <strong>and</strong> B. Metts at Savannah River EcologicalLaboratory provided study animals, H.Ramirez provided veter<strong>in</strong>ary assistance, <strong>and</strong> P.Kemp helped develop the experimental diet. Wethank D. Biasatti, K. Hobson, C. Martínez del Rio,K. Reich, <strong>and</strong> B. Wolf for helpful comments thatimproved earlier versions of this manuscript.Fund<strong>in</strong>g for this research was provided by theWallace Research Foundation <strong>and</strong> University ofFlorida. All turtle h<strong>and</strong>l<strong>in</strong>g was <strong>in</strong> full compliancewith the Institutional Animal Care <strong>and</strong> UseCommittee at University of Florida (Authorization#Z053).LITERATURE CITEDBEARHOP, S., S. WALDRON, S. C. VOTIER, AND R. W.FURNESS. 2002. Factors that <strong>in</strong>fluence assimilationrates <strong>and</strong> fractionation of nitrogen <strong>and</strong> carbonstable isotopes <strong>in</strong> avian blood <strong>and</strong> feathers.Physiological Biochemistry <strong>and</strong> Zoology 75:451–458.BENNETT, A. F., AND W. R. DAWSON. 1976. Metabolism,p. 127–233. In: Biology of the Reptilia. C. Gans <strong>and</strong>W. R. Dawson (eds.). Academic Press, New York.BENTLEY, P. J. 1976. Osmoregulation <strong>in</strong> reptiles,p. 365–412. In: Biology of the Reptilia. C. Gans<strong>and</strong> W. R. Dawson (eds.). Academic Press, NewYork.BIASATTI, D. M. 2004. <strong>Stable</strong> carbon isotopic profilesfor sea turtle humeri: implications for ecology <strong>and</strong>physiology. Paleogeography, Paleoclimatology, <strong>and</strong>Paleoecology 206:203–216.DENIRO, M. J., AND S. EPSTEIN. 1978. Influence of dieton the distribution of carbon isotopes <strong>in</strong> animals.Geochimica Cosmochimica Acta 42:495–506.DENIRO, M. J., AND S. EPSTEIN. 1981. Influence of dieton the distribution of nitrogen isotopes <strong>in</strong> animals.Geochimica Cosmochimica Acta 45:341–331.ELSE, P. L., AND A. J. HULBERT. 1981. Comparison ofthe ‘‘mammal mach<strong>in</strong>e’’ <strong>and</strong> the ‘‘reptile mach<strong>in</strong>e’’:energy production. American PhysiologicalSociety 1981:R3–R9.EVANS OGDEN, L. E., K. A. HOBSON, AND D. B. LANK.2004. Blood isotopic (d 13 C <strong>and</strong> d 15 N) turnover <strong>and</strong>diet–tissue fractionation factors <strong>in</strong> captive Dunl<strong>in</strong>(Calidris alp<strong>in</strong>a pacifica). Auk 121:170–177.FARQUHAR, G. D., M. H. O’LEARY, AND J. A. BERRY.1982. On the relationship between carbon isotopediscrim<strong>in</strong>ation <strong>and</strong> the <strong>in</strong>tercellular carbon dioxideconcentration <strong>in</strong> leaves. Australian Journalof Plant Physiology 9:121–137.FRISCHE, S., S. BRUNO, A. FAGO, R. E. WEBER, AND A.MOZZARELLI. 2001. Oxygen b<strong>in</strong>d<strong>in</strong>g by s<strong>in</strong>gle redblood cells from the red-eared turtle Trachemysscripta. Journal of Applied Physiology 90:1679–1684.GANNES, L. Z., C, MARTÍNEZ DEL RIO, AND P. KOCH.1997. <strong>Stable</strong> isotopes <strong>in</strong> animal ecology: assumptions,caveats, <strong>and</strong> a call for more laboratoryexperiments. Ecology 78:1271–1276.GONFIANTINI, R., W. STICHLER, AND K. ROZANSKI. 1995.St<strong>and</strong>ards <strong>and</strong> <strong>in</strong>tercomparison materials distributedby the International Atomic Energy Agency forstable isotope measurements. In: Reference <strong>and</strong>Intercomparison Materials for <strong>Stable</strong> <strong>Isotope</strong>s ofLight Elements. IAEA TECDOC-825, 13-29. IAEA,Vienna.GIBBONS, J. W. (ED.) 1990. Life History <strong>and</strong> Ecology ofthe Slider Turtle. Smithsonian Institution Press,Wash<strong>in</strong>gton, D.C.GODLEY, B. J., D. R. THOMPSON, S. WALDRON, AND R. W.FURNESS. 1998. The trophic status of mar<strong>in</strong>e turtlesas determ<strong>in</strong>ed by stable isotope analysis. Mar<strong>in</strong>eEcology Progress Series 166:277–284.HATASE, H., N. TAKAI, Y. MATSUZAWA, W. SAKAMOTO, K.OMUTA, K. GOTO, N. ARAI, AND T. FUJIWARA. 2002.Size-related differences <strong>in</strong> feed<strong>in</strong>g habitat use ofadult female loggerhead turtles Caretta carettaaround Japan determ<strong>in</strong>ed by stable isotope analyses<strong>and</strong> satellite telemetry. Mar<strong>in</strong>e Ecology ProgressSeries 233:273–281.HESSLEIN, R. H., K. HALLARD, AND P. RAMLAL. 1993.Replacement of sulfur, carbon, <strong>and</strong> nitrogen <strong>in</strong>tissue of grow<strong>in</strong>g broad whitefish (Coregonus nasus)<strong>in</strong> response to a change <strong>in</strong> diet traced by d 34 S, d 13 C,<strong>and</strong> d 15 N. Canadian Journal of Fisheries <strong>and</strong>Aquatic Science 50:2071–2076.HILDERBRAND, G. B., S. D. FARLEY, C. T. ROBBINS, T. A.HANLEY, K. TITUS, AND C. SERVHEEN. 1996. Use ofstable isotopes to determ<strong>in</strong>e diets of liv<strong>in</strong>g <strong>and</strong>ext<strong>in</strong>ct bears. Canadian Journal of Zoology74:2080–2088.HOBSON, K. A. 1993. Trophic relationships amonghigh Arctic seabirds: <strong>in</strong>sights from tissue-dependentstable isotope models. Mar<strong>in</strong>e Ecology ProgressSeries 95:7–18.HOBSON, K. A., R. T. ALISAISKAS, AND R. G. CLARK.1993. <strong>Stable</strong>-nitrogen isotope enrichment <strong>in</strong> aviantissues due to fast<strong>in</strong>g <strong>and</strong> nutritional stress:implications for isotopic analysis of diet. Condor95:388–394.HOBSON, K. A., AND F. BAIRLEIN. 2003. Isotopicfractionation <strong>and</strong> turnover <strong>in</strong> captive GardenWarblers (Sylvia bor<strong>in</strong>): implications for del<strong>in</strong>eat<strong>in</strong>gdietary <strong>and</strong> migratory association <strong>in</strong> wild passer<strong>in</strong>es.Canadian Journal of Zoology 81:1630–1635.HOBSON, K. A., AND R. G. CLARK. 1992a. Assess<strong>in</strong>gavian diets us<strong>in</strong>g stable isotopes II: factors <strong>in</strong>fluenc<strong>in</strong>gdiet–tissue fractionation. Condor 94:189–197.
542 COPEIA, 2007, NO. 3HOBSON, K. A., AND R. G. CLARK. 1992b. Assess<strong>in</strong>gavian diets us<strong>in</strong>g stable isotopes I: turnover <strong>in</strong> 13 C<strong>in</strong> tissues. Condor 94:181–188.HOBSON, K. A., AND I. STIRLING. 1997. Low variation<strong>in</strong> blood 13 C among Hudson Bay polar bears:implications for metabolism <strong>and</strong> trac<strong>in</strong>g terrestrialforag<strong>in</strong>g. Mar<strong>in</strong>e Mammal Science 13:359–367.KLAASSEN, M., M. THUMS, AND I. D. HUME. 2004.Effects of diet change on carbon <strong>and</strong> nitrogenstable-isotope ratios <strong>in</strong> blood cells <strong>and</strong> plasma ofthe long-nosed b<strong>and</strong>icoot (Perameles nasuta). AustralianJournal of Zoology 52:635–647.KURLE, C. M. 2002. <strong>Stable</strong> isotope ratios of blooscomponents from captive northern fur seals(Callorh<strong>in</strong>us urs<strong>in</strong>us) <strong>and</strong> their diet: applicationsfor study<strong>in</strong>g the forag<strong>in</strong>g ecology of wild otariids.Canadian Journal of Zoology 80:902–909.LESAGE, V., M. O. HAMMILL, AND K. M. KOVACS. 2002.Diet–tissue fractionation of stable carbon <strong>and</strong>nitrogen isotopes <strong>in</strong> phocid seals. Mar<strong>in</strong>e MammalScience 18:182–193.LUTZ, P. L. 1997. Salt, water, <strong>and</strong> pH balance <strong>in</strong> seaturtles, p. 343–361. In: The Biology of Sea Turtles.P. L. Lutz <strong>and</strong> J. A. Musick (eds.). CRC Press, BocaRaton, Florida.MACRAE, J. C., AND P. J. REEDS. 1980. Prediction ofprote<strong>in</strong> deposition <strong>in</strong> rum<strong>in</strong>ants, p. 225–249. In:Prote<strong>in</strong> Deposition <strong>in</strong> Animals. P. J. Buttery <strong>and</strong>D. B. L<strong>in</strong>dsay (eds.). Butterworths, London.MAGNUSSON, W. E., A. P. LIMA, A. S. FARIA, R. L.VICTORIA, AND L. A. MARTINELLI. 2001. Size <strong>and</strong>carbon acquisition <strong>in</strong> lizards from AmazonianSavanna: evidence from isotope analysis. Ecology82:1772–1780.MARTÍNEZ DEL RIO, C., AND B. WOLF. 2005. Massbalance models for animal isotopic ecology, p. 141–174. In: Physiological <strong>and</strong> ecological adaptations tofeed<strong>in</strong>g <strong>in</strong> vertebrates. M. A. Starck <strong>and</strong> T. Wang(eds.). Science Publishers,Enfield, New Hampshire.MCNAB, B. K. 2002. The Physiological Ecology ofVertebrates: A View from Energetics. CornellUniversity, Ithaca, New York.MINIWAGA, M., AND W. WADA. 1984. Stepwise enrichmentof d 15 N along food cha<strong>in</strong>s: further evidenceof the relation between d 15 N <strong>and</strong> animal age.Geochimica Cosmochimica Acta 48:1135–1140.PEARSON, S. F., D. J. LEVEY, C. H. GREENBERG, AND C.MARTÍNEZ DEL RIO. 2003. Effects of elementalcomposition on the <strong>in</strong>corporation of dietarynitrogen <strong>and</strong> carbon isotopic signatures <strong>in</strong> anomnivorous songbird. Oecologia 135:516–523.PETERSON, B. J., AND B. FRY. 1987. <strong>Stable</strong> isotopes <strong>in</strong>ecosystem studies. Annual Review of Ecology <strong>and</strong>Systematics 18:293–320.PINNEGAR, J. K., AND N. V. C. POLUNIN. 1999.Differential fractionation of d 13 C <strong>and</strong> d 15 N amongfish tissues: implications for the study of trophic<strong>in</strong>teractions. Functional Ecology 13:225–231.ROTH, J. D., AND K. A. HOBSON. 2000. <strong>Stable</strong> carbon<strong>and</strong> nitrogen isotopic fractionation between diet<strong>and</strong> tissue of captive red fox: implications fordietary reconstruction. Canadian Journal of Zoology78:848–852.RUBENSTEIN, D. R., AND K. A. HOBSON. 2004. Frombirds to butterflies: animal movement patterns <strong>and</strong>stable isotopes. Trends <strong>in</strong> Ecology <strong>and</strong> Evolution19:256–263.SCHLECHTRIEM, C., U. FOCKEN, AND K. BECKER. 2004.<strong>Stable</strong> isotopes as a tool for nutrient assimilationstudies <strong>in</strong> larval fish feed<strong>in</strong>g on live food. AquaticEcology 38:93–100.SEMINOFF, J. A., T. T. JONES, T. EGUCHI, D. JONES, ANDP. H. DUTTON. 2006. <strong>Stable</strong> isotope discrim<strong>in</strong>ation(d 13 C <strong>and</strong> d 15 N) between soft tissues of green seaturtles Chelonia mydas <strong>and</strong> their diet. Mar<strong>in</strong>eEcology Progress Series 308:271–278.STOTT, A. W., E. DAVIES, AND R. P. EVERSHED. 1997.Monitor<strong>in</strong>g the rout<strong>in</strong>g of dietary <strong>and</strong> biosynthesizedlipids through compound-specific stable isotope(d 13 C) measurements at natural abundance.Naturwissenschaften 84:82–86.STRUCK, U., A. V. ALTENBACH, M. GAULKE, AND F.GLAW. 2002. Trac<strong>in</strong>g the diet of the monitor lizardVaranus mabitang by stable isotope analyses (d 15 N,d 13 C). Naturwissenschaften 89:470–473.TIESZEN, L. L., T. W. BOUTTON, K. G. TESDAHL, ANDN. A. SLADE. 1983. Fractionation <strong>and</strong> turnover ofstable carbon isotopes <strong>in</strong> animal tissues: implicationsfor d 13 C analysis of diet. Oecologia 57:32–37.VOIGT, C. C., F. MATT, R. MICHENER, AND T. H. KUNZ.2003. Low turnover rates of carbon isotopes <strong>in</strong>tissues of two nectar-feed<strong>in</strong>g bats. Journal ofExperimental Biology 206:1419–1427.WALLACE, B. P., J. A. SEMINOFF, S. S. KILHAM, J. R.SPOTILA, AND P. H. DUTTON. 2006. Leatherbackturtles as oceanographic <strong>in</strong>dicators: stable isotopeanalyses reveal a trophic dichotomy between oceanbas<strong>in</strong>s. Mar<strong>in</strong>e Biology 149:953–960.ARCHIE CARR CENTER FOR SEA TURTLE RESEARCHAND DEPARTMENT OF ZOOLOGY, UNIVERSITY OFFLORIDA, P.O. BOX 118525, GAINESVILLE, FLORIDA32611-8525. PRESENT ADDRESS: ( JAS) NOAA–NATIONAL MARINE FISHERIES SERVICE, SOUTH-WEST FISHERIES SCIENCE CENTER, 8604 LA JOLLASHORES DRIVE, LA JOLLA, CALIFORNIA 92037. E-mail: ( JAS) jeffrey.sem<strong>in</strong>off@noaa.gov. Sendrepr<strong>in</strong>t requests to JAS. Submitted: 20 Jan.2006. Accepted: 23 Jan. 2007. Section editor:R. Mason.