Structural and functional characterization of the ... - Microbiology
Structural and functional characterization of the ... - Microbiology
Structural and functional characterization of the ... - Microbiology

You also want an ePaper? Increase the reach of your titles
YUMPU automatically turns print PDFs into web optimized ePapers that Google loves.
K. Sakamoto <strong>and</strong> o<strong>the</strong>rs<br />
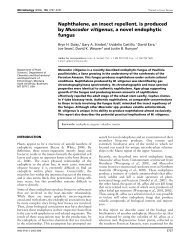
Table 3. Altered expression <strong>of</strong> genes determined by DNA microarray analysis at <strong>the</strong> ORF level<br />
WT_Cu, altered expression in <strong>the</strong> wild-type strain after cultivation for 30 min in <strong>the</strong> presence <strong>of</strong> 1.25 mM CuSO 4; DcsoR, expression in <strong>the</strong><br />
DcsoR strain relative to that in <strong>the</strong> wild-type; DcsoR_Cu, altered expression in <strong>the</strong> DcsoR strain after cultivation for 30 min in <strong>the</strong> presence <strong>of</strong> 1.25 mM<br />
CuSO 4;WT_Zn, altered expression in <strong>the</strong> wild-type strain after cultivation for 30 min in <strong>the</strong> presence <strong>of</strong> 1.0 mM ZnSO 4. The arrangement<br />
<strong>of</strong> <strong>the</strong> genes can be seen at <strong>the</strong> NCBI Entrez Genome website (http://www.ncbi.nlm.nih.gov/sites/entrez?Db=genome&Cmd=ShowDetailView&<br />
TermToSearch=530).<br />
Gene WT_Cu<br />
expression<br />
(q value)<br />
DcsoR expression<br />
(q value)<br />
DcsoR_Cu<br />
expression<br />
(q value)<br />
WT_Zn<br />
expression<br />
(q value)<br />
Annotation<br />
TTHA1718 (copZ) 4.81 (0.01) 6.02 (0.02) 2.59 (0.02) 9.98 (0.00) Heavy metal-binding protein<br />
TTHA1719 (csoR) 6.51 (0.01) 2 2 9.91 (0.00) Copper-sensing transcriptional repressor<br />
TTHA1720 (copA) 7.60 (0.00) 0.10 (0.02) 0.38 (0.10) 11.0 (0.00) Copper-transporting ATPase<br />
TTHA1721 11.3 (0.00) 0.38 (0.02) 16.0 (0.01) 6.34 (0.00) Hypo<strong>the</strong>tical protein<br />
TTHA1722 12.4 (0.00) 0.38 (0.02) 11.1 (0.01) 4.94 (0.00) Putative response regulator (CopR)<br />
TTHA1723 7.93 (0.02) 0.64 (0.16) 5.06 (0.01) 3.80 (0.00) Sensor histidine kinase (CopS)<br />
TTHA1724 29.5 (0.00) 0.90 (0.34) 32.7 (0.01) 3.17 (0.01) Hypo<strong>the</strong>tical protein<br />
TTHA1725 23.7 (0.00) 0.66 (0.08) 19.1 (0.01) 1.99 (0.01) S-layer repressor<br />
TTHA1726 14.1 (0.01) 0.83 (0.25) 8.68 (0.01) 1.77 (0.01) Hypo<strong>the</strong>tical protein<br />
TTHA1727 11.6 (0.00) 1.12 (0.26) 6.35 (0.01) 2.52 (0.00) Conserved hypo<strong>the</strong>tical protein<br />
TTHA1728 13.2 (0.00) 1.38 (0.04) 3.67 (0.01) 2.08 (0.04) Putative methyltransferase<br />
TTHA1729 0.85 (0.15) 1.07 (0.30) 1.03 (0.26) 1.19 (0.14) Hypo<strong>the</strong>tical protein<br />
TTHA1730 15.5 (0.01) 0.86 (0.31) 5.24 (0.02) 1.11 (0.22) Hypo<strong>the</strong>tical protein<br />
TTHA1731 9.80 (0.00) 1.11 (0.14) 3.09 (0.01) 1.19 (0.03) Hypo<strong>the</strong>tical protein<br />
TTHA1732 6.89 (0.00) 1.15 (0.15) 2.68 (0.01) 1.63 (0.01) Hypo<strong>the</strong>tical protein<br />
TTHA1733 2.16 (0.01) 1.67 (0.04) 0.85 (0.18) 2.01 (0.00) Copper-transporting ATPase, P-type (CopB)<br />
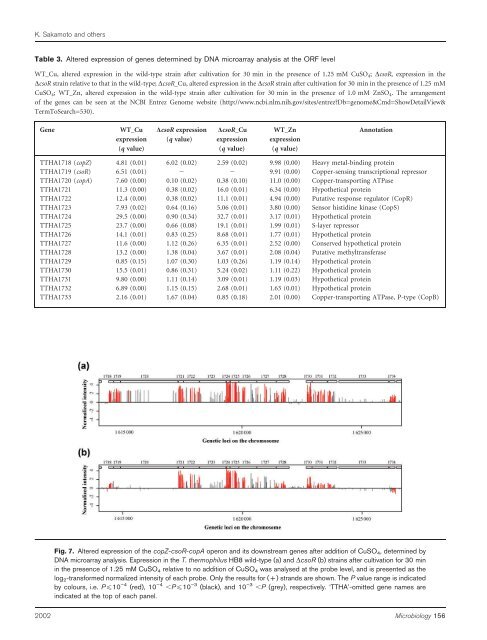
Fig. 7. Altered expression <strong>of</strong> <strong>the</strong> copZ-csoR-copA operon <strong>and</strong> its downstream genes after addition <strong>of</strong> CuSO 4, determined by<br />
DNA microarray analysis. Expression in <strong>the</strong> T. <strong>the</strong>rmophilus HB8 wild-type (a) <strong>and</strong> DcsoR (b) strains after cultivation for 30 min<br />
in <strong>the</strong> presence <strong>of</strong> 1.25 mM CuSO 4 relative to no addition <strong>of</strong> CuSO 4 was analysed at <strong>the</strong> probe level, <strong>and</strong> is presented as <strong>the</strong><br />
log 2-transformed normalized intensity <strong>of</strong> each probe. Only <strong>the</strong> results for (+) str<strong>and</strong>s are shown. The P value range is indicated<br />
by colours, i.e. P¡10 ”4 (red), 10 ”4 ,P¡10 ”3 (black), <strong>and</strong> 10 ”3 ,P (grey), respectively. ‘TTHA’-omitted gene names are<br />
indicated at <strong>the</strong> top <strong>of</strong> each panel.<br />
2002 <strong>Microbiology</strong> 156