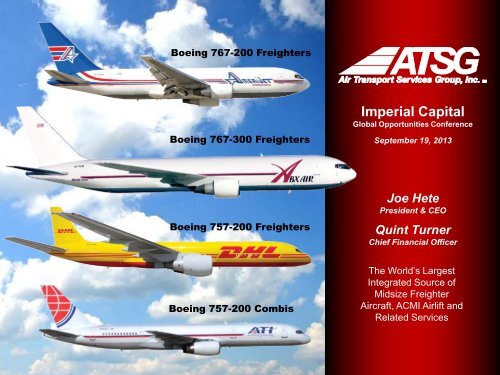
2013 Investor Presentation - Air Transport Services Group, Inc.
2013 Investor Presentation - Air Transport Services Group, Inc.
2013 Investor Presentation - Air Transport Services Group, Inc.
You also want an ePaper? Increase the reach of your titles
YUMPU automatically turns print PDFs into web optimized ePapers that Google loves.
ATSG Strategy – It Starts With The LeaseDry leasing of midsized freighter aircraft is the foundation of ATSG’s unique capitalallocation model and business strategy▌ Cargo <strong>Air</strong>craft Management (CAM) purchases passenger aircraft, managesextensive modification and upgrade process▌ <strong>Air</strong>craft offered for dry lease at market rates to yield 10%+ unlevered ROIC▌ Dry leases typically have 5-7 year term; customers assume operating risk▌ ATSG subsidiary airlines compete with third-party lessees for access to assets▌ <strong>Inc</strong>remental returns from maintenance and other custom services5
ATSG Strategy – ACMI or CMI OperationsWe crew, maintain and insure our aircraft types for incremental (CMI)or package (A+CMI) price▌ ABX <strong>Air</strong> and ATI provide ACMI services for cargo transport companies worldwide▌ Customer accepts fuel-price risk▌ ACMI generates incremental operating return above market lease rates▌ CMI services available for customer aircraft – incremental return without capital investment6
ATSG Strategy – Customized SupportThe world’s only source of complete turnkey solutions for customers seekingmidsized freighter air network servicesMaintenance<strong>Air</strong>borne Maintenance & Engineering <strong>Services</strong>▌ Heavy & line maintenance, component overhaul,engineering, manufacturing▌ Customers include major airlines, private operators▌ Expanding hangar facilities to serve more 3 rd party fleetsLGSTX <strong>Services</strong>, <strong>Inc</strong>.▌ Equipment leasing, and equipment/facility maintenance▌ Customers: major airlines, regional airports▌ Logistics support services▌ Sort management services for USPSLogistics7
ATSG Investment Strategy767 freighter fleet yields unlevered base ROICs above 10%; incremental returnpotential driven by complementary services($ in millions)ATSG 767 Freighter Fleet Return OpportunitiesBase Dry Lease Only(A)Dry Lease +Maintenance (A+M)Dry Lease + Crew +Maint. (A+CMI)Projected DryLease EBIT<strong>Inc</strong>remental EBITto Dry Lease Only$77 - 83- -or$77 - 83 $77 - 83or$4 - 16 $16 - 1910.8 - 13.1%12.5 - 13.5%Total UnleveredROIC10.3 - 11.0%Note: Illustration based on current average investment costs to acquire & convert comparable 767 passengeraircraft to freighter configuration. Cost to acquire and convert ATSG’s owned and in-service 767 freighterfleet (thirty-six 200s and five 300s) at current market prices: approximately $775 million.8
First Half <strong>2013</strong> ResultsStrong Returns from Leasing, DHL Support, Offset by ATI ShortfallRevenues$M $M $M$299$282Pre-tax<strong>Inc</strong>ome$29$25Diluted EPS$0.28$0.24Adj.EBITDA*$77$73▌ CAM pre-tax earnings up 2%,or $0.6 million▌ Salaries, wages & benefitexpense down $4 million dueto ATI/CCIA merger▌ ATI shortfall leads to $9million ACMI <strong>Services</strong>operating loss2012 <strong>2013</strong>2012 <strong>2013</strong>2012 <strong>2013</strong>2012 <strong>2013</strong>($M, except ratios) 12/31/2012 6/30/<strong>2013</strong>Cash & Cash Equivalents $ 15.4 $ 20.9Total Debt 364.5 388.8EBITDA* 165.0 161.2 (ttm)Adjusted EBITDA* 163.2 159.2 (ttm)Adjusted Net Leverage Ratio* 2.14 2.31* Non-GAAP metric. See table at end of this presentation for reconciliation to nearest GAAP results9
Strong Capital BaseStrong Adjusted EBITDA generation, moderate financial leverage andminimal off-balance sheet liabilities point to stronger free cash flow in 2014Adjusted EBITDA * Less Maintenance CapexDebt Obligations / Adjusted EBITDA *$M$113.4$135.8$158.9$151.9~$130.02.7x1.8x 1.9x2.2x~2.5x2009 2010 2011 2012 <strong>2013</strong>E2009 2010 2011 2012 <strong>2013</strong>E* Adjusted EBITDA is a non-GAAP metric. Debt Obligations are as of end of year. See table at end of thispresentation for reconciliation to nearest GAAP results10
Unrivaled Leader in ACMI Medium Wide-body4035306Global Sources of Medium Wide-body Freighters - ACMI Basis(number of aircraft by type, as of 2012)Source: <strong>Air</strong> Cargo Management <strong>Group</strong>25Boeing 767-300F<strong>Air</strong>bus A300-600F201532Boeing 767-200F<strong>Air</strong>bus A300-B4F<strong>Air</strong>bus A310-300F1050ATSG10<strong>Air</strong>Contractors3 2 1135 52 3 4131 2 2Cargojet Maximus Midex MNG myCargo Rio Linhas Star <strong>Air</strong> ULS1. <strong>Inc</strong>ludes, as of 4Q 2012, 767 freighter aircraft operated by ATSG airlines ABX <strong>Air</strong> and <strong>Air</strong> <strong>Transport</strong> International, including13 dry-leased to DHL through 2017 but operated by ATSG airline under CMI, and 767s dry-leased from other entities.2. 767-200F aircraft operated by these carriers are owned by ATSG’s Cargo <strong>Air</strong>craft Management subsidiary and providedunder long-term dry leases.11
Penetrating Global MarketsCurrent &Potential 767Routes• Seizing market opportunities in Europe & Asiapresent challenges for U.S.-domiciled carrierswhen routes do not touch U.S.• Regulatory process can delay or blockagreed-upon deals• Options include:– Dry leasing to non-U.S. carriers– Investing in foreign carriers12
Combi Transition UpdateNew 2-Yearcombi deal withU.S. Military;one 757 combiin modCAMAcquires 3757 combisfromNationalFAA Reviews continue,ATI/CCIA Merger Completed Two 757CombisEnter Service3rd 757 CombiEnters ServiceCombi TransitionCompleteOct.2012Jan.<strong>2013</strong>Apr.<strong>2013</strong>July<strong>2013</strong>Oct.<strong>2013</strong>Jan.2014▌ Third combi added to fleet in late August▌ FAA expected to complete 757 combi ETOPS review for longest Asia route in lateSeptember▌ Final combi due to complete FAA airframe certification mid-4Q▌ Each 757 combi replacement of DC-8 combis generates $675,000 per quarter inincremental EBITDA13
2014 – Expanding Free Cash Flow Creates OptionsGrowthInvestmentsFree CashFlowOptionsDebtRepaymentShareBuybacks14
Non-GAAP Reconciliation StatementReconciliation Stmt. ($ in 000s except Ratios)2008 2009 2010 2011 2012 2Q13(ttm)GAAP Pre-tax Earnings (Loss) from Continuing Operations $ (56,619) $ 45,358 $ 63,317 $ 40,860 $ 66,320 $ 62,083Impairment Charges 91,241 - - 27,144 - -Severance & Retention Activities (816) (16,727) (3,549) - - -Net Deriv. Loss (Gain) and Credit Agrmt Termination 7,767 (1,879) (1,959)Adjusted Pre-tax Earnings from Continuing Operations* $ 33,806 $ 28,631 $ 59,768 $ 75,771 $ 64,441 $ 60,124Interest <strong>Inc</strong>ome (2,335) (449) (316) (179) (136) (109)Interest Expense 37,002 26,881 18,675 14,181 14,383 13,851Depreciation and amortization 93,752 83,964 87,594 91,063 84,477 85,348Adjusted EBITDA from Continuing Operations*$ 162,225 $ 139,027 $ 165,721 $ 180,836 $ 163,165 $ 159,214Debt Obligations - end of period$ 512,486 $ 377,427 $ 302,528 $ 346,904 $ 364,481 $ 388,756Debt Obligations/Adjusted EBITDA Ratio*3.16 2.71 1.83 1.92 2.23 2.44Cash & Cash Equivalents, end of period $30,503 $15,442 $20,932Adjusted Net Leverage Ratio 1.75 2.14 2.31Reconciliation Stmt. ($ in 000s)1Q12 2Q12 3Q12 4Q12 1Q13 2Q13GAAP Pre-tax Earningsfrom Continuing Operations$10,743 $18,171 $18,959 $18,447 $13,592 $11,085Derivative Gain (460) (202) (294) (923) (290) (452)Adj. Pre-tax Earnings - Cont. Oper.$10,283 $17,969 $18,665 $17,524 $13,302 $10,633Interest <strong>Inc</strong>ome (28) (38) (38) (32) (21) (18)Interest Expense 3,547 3,671 3,668 3,497 3,132 3,554Depreciation and amortization 20,300 21,514 21,057 21,606 20,920 21,765Adjusted EBITDA from Continuing Operations$34,102 $43,116 $43,352 $42,595 $37,333 $35,934* Adjusted Pre-Tax Earnings from Continuing Operations, Adjusted EBITDA from Continuing Operations, Debt Obligations/Adjusted EBITDA Ratio and Adjusted NetLeverage Ratio are non-GAAP financial measures and should not be considered alternatives to net income or any other performance measure derived in accordancewith GAAP. Adjusted Pre-Tax Earnings from Continuing Operations excludes pre-tax earnings from the severance and retention agreement with DHL that ended in2010, unrealized gains or losses from derivative instruments, impairment charges for aircraft, goodwill & intangibles, and costs from termination of credit agreements.Adjusted EBITDA from Continuing Operations is defined as EBITDA (Pretax Earnings (loss) from Continuing Operations Before <strong>Inc</strong>ome Taxes minus Interest <strong>Inc</strong>ome,plus Interest Expense and plus Depreciation and Amortization) excluding results from Severance & Retention Activities, unrealized gains or losses in derivativeinstruments, impairment charges for aircraft, goodwill & intangibles, and costs from termination of credit agreements. Debt Obligations/Adjusted EBITDA Ratio isdefined as Debt Obligations (Long-term Debt Obligations plus Current Portion of Debt Obligations at end of period) divided by Adjusted EBITDA from ContinuingOperations. Adjusted Net Leverage Ratio is defined as Debt Obligations minus Cash and Cash Equivalents, divided by Adjusted EBITDA from Continuing Operations.Management uses these adjusted financial measures in conjunction with GAAP finance measures to monitor and evaluate its performance, including as a measure offinancial strength. Adjusted Pre-tax Earnings, Adjusted EBITDA and Debt Obligations/Adjusted EBITDA Ratio should not be considered in isolation or as a substitutefor analysis of the Company’s results as reported under GAAP, or as alternative measures of liquidity.15


