Kingdom

You also want an ePaper? Increase the reach of your titles
YUMPU automatically turns print PDFs into web optimized ePapers that Google loves.
Statement of Changes in Net Assets<br />
Financial Analysis<br />
All Funds (Audited)<br />
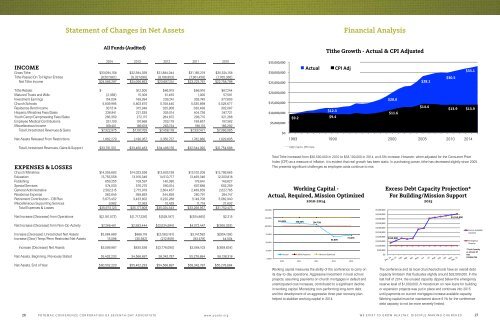
Tithe Tithe Growth Growth -‐ Actual - Actual & CPI & Adjusted CPI Adjusted <br />
2014 2013 2012 2011 2010<br />
INCOME<br />
Gross Tithe $33,094,158 $32,394,359 $31,884,044 $31,185,219 $30,524,158<br />
Tithe Passed On To Higher Entities (8,507,861) (8,327,696) (8,196,803) (7,961,458) (7,765,360)<br />
Net Tithe Income $24,586,297 $24,066,663 $23,687,241 $23,223,761 $22,758,798<br />
$35,000,000 <br />
$30,000,000 <br />
$25,000,000 <br />
Actual <br />
CPI Adj <br />
$28.1 <br />
$30.5 <br />
$33.1 <br />
Tithe Rebate $-xxxxxxxxx $12,500 $66,915 $66,916 $67,244<br />
Matured Trusts and Wills (2,369) 15,309 61,455 1,000 57,591<br />
Investment Earnings 154,034 169,394 239,241 303,745 377,803<br />
Church Schools 5,839,995 5,803,675 5,708,440 5,535,898 5,528,677<br />
Residence Rent Income 307,514 315,948 325,908 330,499 302,087<br />
Hispanic Ministries Fees/Sales 236,941 221,535 305,014 404,736 347,721<br />
Youth Camp/Campmeeting Fees/Sales 286,359 272,115 284,872 296,710 321,288<br />
Employee Medical Contributions 331,100 197,668 203,179 199,857 197,382<br />
Miscellaneous Income 169,401 189,619 263,154 198,110 166,292<br />
Total Unrestricted Revenues & Gains $7,322,975 $7,197,763 $7,458,178 $7,337,471 $7,366,085<br />
Net Assets Released From Restrictions 1,882,279 2,196,057 3,350,737 1,782,860 1,629,805<br />
Total Unrestriced Revenues, Gains & Support $33,791,551 $33,460,483 $34,496,156 $32,344,092 $31,754,688<br />
EXPENSES & LOSSES<br />
Church Ministries $14,355,683 $14,023,556 $13,603,199 $13,100,208 $12,799,865<br />
Education 13,755,558 13,916,349 14,510,717 13,469,346 12,203,818<br />
Publishing 659,255 109,597 140,380 179,841 149,827<br />
Special Services 574,033 576,270 590,014 607,688 602,259<br />
General Administrative 2,582,315 2,715,979 2,604,457 2,489,659 2,627,785<br />
Residence Expense 362,845 389,893 344,859 260,791 264,147<br />
Retirement Contribution - DB Plan 3,673,452 3,433,802 3,220,288 3,149,708 3,082,940<br />
Miscellaneous Supporting Services 9,982 12,363 10,429 11,716 21,832<br />
Total Expenses & Losses $35,973,123 $35,177,809 $35,024,343 $33,268,957 $31,752,473<br />
$20,000,000 <br />
$15,000,000 <br />
$10,000,000 <br />
$5,000,000 <br />
$0 <br />
$9.2 <br />
$12.3 <br />
$9.4 <br />
Total Tithe increased from $30,500,000 in 2010 to $33,100,000 in 2014, an 8.5% increase. However, when adjusted for the Consumer Price<br />
Index (CPI) as a measure of inflation, it is evident that real growth has been static. In purchasing power, tithe has decreased slightly since 2005.<br />
This presents significant challenges as employee costs continue to rise.<br />
Working Capital -<br />
Actual, Required, Mission Optimized<br />
2010-2014<br />
$5,000,000<br />
$20.0 <br />
$11.6 <br />
$14.4 <br />
Excess Debt Capacity Projection*<br />
For Building/Mission Support<br />
Excess Debt Capacity Projection*<br />
For Building/Mission 2015 Support<br />
2015<br />
$13.9 $13.9 <br />
1983 1990 2000 2005 2010 2014<br />
1983 2005 <br />
1982-‐1984 1982-1984 = CPI = 100% CPI 100% <br />
Net Increase (Decrease) from Operations $(2,181,572) $(1,717,326) $(528,187) $(924,865) $2,215<br />
$4,500,000<br />
$4,000,000<br />
$3,555,000<br />
Net Increase (Decrease) form Non-Op Activity $7,266,461 $2,583,444 $(3,034,994) $4,072,447 $(906,353)<br />
Increase (Decrease) Unrestricted Net Assets $5,084,889 $866,118 $(3,563,181) $3,147,582 $(904,138)<br />
Increase (Decr) Temp/Perm Restricted Net Assets 15,098 (30,582) (212,909) (83,479) 44,504<br />
Increase (Decrease) Net Assets $5,099,987 $835,536 $(3,776,090) $3,064,103 $(859,634)<br />
Net Assets, Beginning, Previously Stated 55,402,233 54,566,697 58,342,787 55,278,684 56,138,318<br />
$3,500,000<br />
$3,000,000<br />
$2,500,000<br />
$2,000,000<br />
$1,500,000<br />
$1,000,000<br />
$500,000<br />
$0<br />
$312,000<br />
Excess Available<br />
Capacity<br />
Emergency<br />
Reserve<br />
*Total Capacity<br />
as of June 30<br />
was<br />
$32,846,736<br />
Net Assets, End of Year $60,502,220 $55,402,233 $54,566,697 $58,342,787 $55,278,684<br />
Working capital measures the ability of the conference to carry on<br />
its day-to-day operations. Aggressive investment in local school<br />
projects, assuming payments on church mortgages in default and<br />
unanticipated cost increases, contributed to a significant decline<br />
in working capital. Monetizing non-performing long-term debt<br />
and the development of an aggressive three year recovery plan<br />
helped to stabilize working capital in 2014.<br />
The conference and its local churches/schools have an overall debt<br />
capacity limitation that fluctuates slightly around $32,500,000. In the<br />
last half of 2014, the unused capacity dipped below the emergency<br />
reserve level of $1,000,000. A moratorium on new loans for building<br />
or expansion projects was put in place and continues into 2015<br />
until payments on current mortgages increase available capacity.<br />
Working capital must be maintained above 61% for the conference<br />
debt capacity to not be more severely limited.<br />
26 POTOMAC CONFERENCE CORPORATION OF SEVENTH-DAY ADVENTISTS www.pcsda.org WE EXIST TO GROW HEALTHY, DISCIPLE-MAKING CHURCHES 27