Denver Public Schools COLORADO DENVER COLORADO 2000 ...
Denver Public Schools COLORADO DENVER COLORADO 2000 ...
Denver Public Schools COLORADO DENVER COLORADO 2000 ...

Create successful ePaper yourself
Turn your PDF publications into a flip-book with our unique Google optimized e-Paper software.
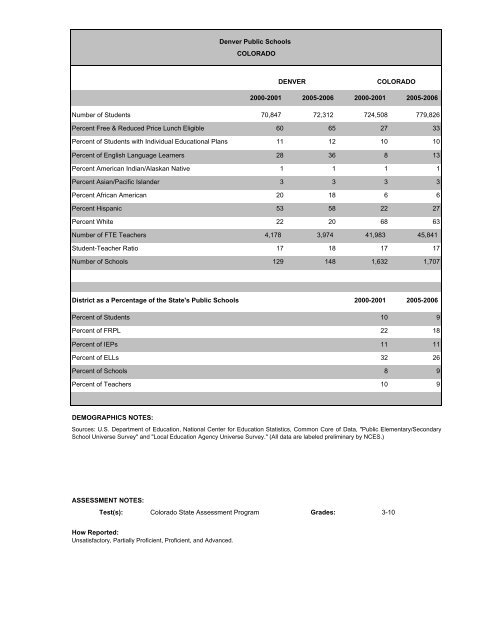
<strong>Denver</strong> <strong>Public</strong> <strong>Schools</strong><strong>COLORADO</strong><strong>DENVER</strong><strong>COLORADO</strong><strong>2000</strong>-2001 2005-2006 <strong>2000</strong>-2001 2005-2006Number of Students 70,847 72,312 724,508 779,826Percent Free & Reduced Price Lunch Eligible 60 65 27 33Percent of Students with Individual Educational Plans 11 12 10 10Percent of English Language Learners 28 36 8 13Percent American Indian/Alaskan Native 1 1 1 1Percent Asian/Pacific Islander 3 3 3 3Percent African American 20 18 6 6Percent Hispanic 53 58 22 27Percent White 22 20 68 63Number of FTE Teachers 4,178 3,974 41,983 45,841Student-Teacher Ratio 17 18 17 17Number of <strong>Schools</strong> 129 148 1,632 1,707District as a Percentage of the State's <strong>Public</strong> <strong>Schools</strong> <strong>2000</strong>-2001 2005-2006Percent of Students 10 9Percent of FRPL 22 18Percent of IEPs 11 11Percent of ELLs 32 26Percent of <strong>Schools</strong> 8 9Percent of Teachers 10 9DEMOGRAPHICS NOTES:Sources: U.S. Department of Education, National Center for Education Statistics, Common Core of Data, "<strong>Public</strong> Elementary/SecondarySchool Universe Survey" and "Local Education Agency Universe Survey." (All data are labeled preliminary by NCES.)ASSESSMENT NOTES:Test(s): Colorado State Assessment Program Grades: 3-10How Reported:Unsatisfactory, Partially Proficient, Proficient, and Advanced.
<strong>Denver</strong>Colorado State Assessment Program<strong>DENVER</strong><strong>COLORADO</strong>Spring Spring Spring Spring Spring Spring Spring Avg. Yearly Spring Spring Spring Spring Spring Spring Spring Avg. YearlyReading Grade 2001 2002 2003 2004 2005 2006 2007 Change Reading Grade 2001 2002 2003 2004 2005 2006 2007 Change3 3At or Above Proficient 49 50 55 53 52 51 50 0.2 At or Above Proficient 72 72 75 74 71 70 71 -0.2Unsatisfactory 18 22 16 17 20 23 22 0.7 Unsatisfactory 8 9 7 8 9 11 10 0.34 4At or Above Proficient 37 35 37 38 39 42 40 0.5 At or Above Proficient 63 61 63 63 64 68 64 0.2Unsatisfactory 30 31 28 25 29 24 31 0.2 Unsatisfactory 13 13 12 11 13 10 13 0.05 5At or Above Proficient 38 38 41 46 44 47 45 1.2 At or Above Proficient 64 63 66 69 69 70 69 0.8Unsatisfactory 27 29 27 25 25 25 28 0.2 Unsatisfactory 12 14 13 11 11 12 13 0.26 6At or Above Proficient 36 37 39 38 38 45 44 1.3 At or Above Proficient 63 65 67 67 67 69 70 1.2Unsatisfactory 24 23 23 27 27 23 24 0.0 Unsatisfactory 12 10 10 11 11 10 10 -0.37 7At or Above Proficient 35 33 34 35 36 40 40 0.8 At or Above Proficient 63 59 61 61 64 64 65 0.3Unsatisfactory 22 28 30 31 30 28 31 1.5 Unsatisfactory 11 14 14 14 13 13 13 0.38 8At or Above Proficient 37 40 40 34 36 41 38 0.2 At or Above Proficient 63 65 66 64 64 66 63 0.0Unsatisfactory 21 20 22 28 29 25 29 1.3 Unsatisfactory 11 11 10 12 12 11 12 0.29 9At or Above Proficient 34 40 37 38 35 40 40 1.0 At or Above Proficient 63 66 65 66 65 66 66 0.5Unsatisfactory 19 20 19 18 20 25 20 0.2 Unsatisfactory 9 9 9 9 8 10 8 -0.210 10At or Above Proficient 35 39 43 39 40 44 43 1.3 At or Above Proficient 63 65 67 65 66 68 69 1.0Unsatisfactory 19 21 18 19 19 21 20 0.2 Unsatisfactory 9 10 9 9 9 9 8 -0.211 11At or Above Proficient NA NA At or Above Proficient NA NAUnsatisfactory NA NA Unsatisfactory NA NA
<strong>Denver</strong>Colorado State Assessment Program<strong>DENVER</strong><strong>COLORADO</strong>Spring Spring Spring Spring Spring Spring Spring Avg. Yearly Spring Spring Spring Spring Spring Spring Spring Avg. YearlyMathematics Grade 2001 2002 2003 2004 2005 2006 2007 Change Mathematics Grade 2001 2002 2003 2004 2005 2006 2007 Change3 3At or Above Proficient 46 46 46 0.0 At or Above Proficient 68 71 68 0.0Unsatisfactory 16 18 18 1.0 Unsatisfactory 6 7 7 0.54 4At or Above Proficient NA NA NA NA 43 47 50 3.5 At or Above Proficient NA NA NA NA 66 69 71 2.5Unsatisfactory NA NA NA NA 23 20 21 -1.0 Unsatisfactory NA NA NA NA 9 8 9 0.05 5At or Above Proficient 28 30 30 35 41 44 44 2.7 At or Above Proficient 53 55 56 59 63 65 65 2.0Unsatisfactory 29 29 30 26 25 21 24 -0.8 Unsatisfactory 14 12 12 11 10 9 11 -0.56 6At or Above Proficient 23 23 25 31 34 40 3.4 At or Above Proficient 51 50 53 56 57 60 1.8Unsatisfactory 36 38 40 32 33 28 -1.6 Unsatisfactory 16 17 17 14 15 13 -0.67 7At or Above Proficient 14 16 17 21 21 29 3.0 At or Above Proficient 39 41 41 46 45 50 2.2Unsatisfactory 43 42 46 37 45 30 -2.6 Unsatisfactory 21 19 22 16 21 14 -1.48 8At or Above Proficient 14 14 14 15 17 22 23 1.5 At or Above Proficient 39 39 38 41 44 45 46 1.2Unsatisfactory 50 49 56 57 50 50 46 -0.7 Unsatisfactory 27 26 30 28 23 25 22 -0.89 9At or Above Proficient 11 9 11 12 17 17 1.2 At or Above Proficient 31 31 32 33 38 35 0.8Unsatisfactory 60 58 59 59 56 54 -1.2 Unsatisfactory 34 34 35 33 30 33 -0.210 10At or Above Proficient 9 10 11 10 13 15 13 0.7 At or Above Proficient 25 27 27 27 30 31 30 0.8Unsatisfactory 54 56 56 57 57 55 54 0.0 Unsatisfactory 35 31 33 34 32 31 33 -0.311 11At or Above Proficient NA NA At or Above Proficient NA NAUnsatisfactory NA NA Unsatisfactory NA NA
<strong>Denver</strong>Colorado State Assessment ProgramSpring Spring Spring Spring Spring Spring Spring Avg. Yearly Spring Spring Spring Spring Spring Spring Spring Avg. YearlyReading Grade 2001 2002 2003 2004 2005 2006 2007 Change Mathematics Grade 2001 2002 2003 2004 2005 2006 2007 ChangeAT OR ABOVE PROFICIENT 4 AT OR ABOVE PROFICIENT 4<strong>Denver</strong><strong>Denver</strong>African-American 34 40 36 37 38 1.0 African-American 34 36 42 4.0Alaskan Native/Am. Indian 33 27 45 45 33 0.0 Alaskan Native/Am. Indian 36 44 35 -0.5Asian/Pacific Islander 48 54 54 62 62 3.5 Asian/Pacific Islander 59 73 75 8.0Hispanic 26 26 27 32 28 0.5 Hispanic 37 39 43 3.0White 72 70 73 74 76 1.0 White 74 76 78 2.0ColoradoColoradoAfrican-American 41 40 43 47 46 49 47 1.0 African-American 45 48 51 3.0Alaskan Native/Am. Indian 43 47 46 49 52 60 50 1.2 Alaskan Native/Am. Indian 50 58 56 3.0Asian/Pacific Islander 59 59 65 68 69 74 74 2.5 Asian/Pacific Islander 75 81 84 4.5Hispanic 40 36 40 40 41 46 41 0.2 Hispanic 46 50 52 3.0White 73 73 74 75 76 79 76 0.5 White 77 79 81 2.0TotalChangeGapGapAfrican-American (D)-White (S) -40 -35 -40 -42 -38 2.0 African-American (D)-White (S) -43 -43 -39 4.0Hispanic (D)-White (S) -48 -49 -49 -47 -48 0.0 Hispanic (D)-White (S) -40 -40 -38 2.0TotalChangeUNSATISFACTORY 4 UNSATISFACTORY 4<strong>Denver</strong><strong>Denver</strong>African-American 29 22 30 25 32 0.8 African-American 31 28 26 -2.5Alaskan Native/Am. Indian 31 27 30 23 31 0.0 Alaskan Native/Am. Indian 33 26 25 -4.0Asian/Pacific Islander 18 12 18 12 14 -1.0 Asian/Pacific Islander 13 7 7 -3.0Hispanic 35 32 35 29 38 0.8 Hispanic 26 23 24 -1.0White 8 9 8 8 9 0.3 White 7 7 7 0.0ColoradoColoradoAfrican-American 25 24 22 18 22 19 24 -0.2 African-American 20 19 18 -1.0Alaskan Native/Am. Indian 22 20 20 18 19 13 21 -0.2 Alaskan Native/Am. Indian 14 13 14 0.0Asian/Pacific Islander 13 12 11 7 9 7 8 -0.8 Asian/Pacific Islander 5 4 3 -1.0Hispanic 25 27 24 22 25 20 26 0.2 Hispanic 17 16 16 -0.5White 7 7 7 6 7 5 7 0.0 White 5 4 4 -0.5TotalChangeGapGapAfrican-American (D)-White (S) 22 16 23 20 25 3.0 African-American (D)-White (S) 26 24 22 -4.0Hispanic (D)-White (S) 28 26 28 24 31 3.0 Hispanic (D)-White (S) 21 19 20 -1.0TotalChange
<strong>Denver</strong>Colorado State Assessment ProgramAchievement Gap (<strong>Denver</strong> Subgroup vs State)Spring Spring Spring Spring Spring Spring Spring Avg. Yearly Spring Spring Spring Spring Spring Spring Spring Avg. YearlyReading Grade 2001 2002 2003 2004 2005 2006 2007 Change Mathematics Grade 2001 2002 2003 2004 2005 2006 2007 ChangeAT OR ABOVE PROFICIENT 8 AT OR ABOVE PROFICIENT 8<strong>Denver</strong><strong>Denver</strong>African-American 39 33 34 38 34 -1.3 African-American 6 8 9 14 14 2.0Alaskan Native/Am. Indian 42 25 35 41 39 -0.8 Alaskan Native/Am. Indian 11 16 8 12 20 2.3Asian/Pacific Islander 55 50 51 62 59 1.0 Asian/Pacific Islander 31 35 35 49 45 3.5Hispanic 26 21 24 29 25 -0.3 Hispanic 5 8 9 14 14 2.3White 71 72 71 75 75 1.0 White 39 42 44 50 54 3.8ColoradoColoradoAfrican-American 43 46 49 43 44 47 43 0.0 African-American 14 15 14 16 20 22 22 1.3Alaskan Native/Am. Indian 50 54 53 49 48 53 52 0.3 Alaskan Native/Am. Indian 21 26 23 24 26 29 33 2.0Asian/Pacific Islander 63 66 70 69 69 70 71 1.3 Asian/Pacific Islander 49 50 52 56 59 61 63 2.3Hispanic 35 37 39 36 38 41 39 0.7 Hispanic 15 15 15 18 21 22 23 1.3White 73 76 77 75 76 78 75 0.3 White 48 49 48 51 55 56 57 1.5TotalChangeGapGapAfrican-American (D)-White (S) -38 -42 -42 -40 -41 -3.0 African-American (D)-White (S) -42 -43 -46 -42 -43 -1.0Hispanic (D)-White (S) -51 -54 -52 -49 -50 1.0 Hispanic (D)-White (S) -43 -43 -46 -42 -43 0.0TotalChangeUNSATISFACTORY 8 UNSATISFACTORY 8<strong>Denver</strong><strong>Denver</strong>African-American 21 27 25 24 28 1.8 African-American 64 68 59 58 58 -1.5Alaskan Native/Am. Indian 24 29 25 16 33 2.3 Alaskan Native/Am. Indian 61 62 40 55 49 -3.0Asian/Pacific Islander 14 12 18 14 17 0.8 Asian/Pacific Islander 37 31 33 28 26 -2.8Hispanic 29 35 38 33 37 2.0 Hispanic 64 64 58 57 52 -3.0White 8 9 11 9 8 0.0 White 29 26 23 22 19 -2.5ColoradoColoradoAfrican-American 20 18 16 21 20 19 22 0.3 African-American 54 51 53 54 45 46 43 -1.8Alaskan Native/Am. Indian 13 16 14 18 19 15 17 0.7 Alaskan Native/Am. Indian 41 40 40 45 36 36 32 -1.5Asian/Pacific Islander 11 9 8 7 8 8 8 -0.5 Asian/Pacific Islander 20 17 18 17 14 14 12 -1.3Hispanic 23 23 23 25 25 23 25 0.3 Hispanic 48 46 52 48 41 45 40 -1.3White 7 6 6 7 6 6 6 -0.2 White 19 18 21 18 14 15 13 -1.0TotalChangeGapGapAfrican-American (D)-White (S) 15 20 19 18 22 7.0 African-American (D)-White (S) 43 50 45 43 45 2.0Hispanic (D)-White (S) 23 28 32 27 31 8.0 Hispanic (D)-White (S) 43 46 44 42 39 -4.0TotalChange
<strong>Denver</strong>Colorado State Assessment ProgramAchievement Gap (<strong>Denver</strong> Subgroup vs State)Spring Spring Spring Spring Spring Spring Spring Avg. Yearly Spring Spring Spring Spring Spring Spring Spring Avg. YearlyReading Grade 2001 2002 2003 2004 2005 2006 2007 Change Mathematics Grade 2001 2002 2003 2004 2005 2006 2007 ChangeAt or Above Proficient 4 At or Above Proficient 4<strong>Denver</strong><strong>Denver</strong>FRPL 27 27 27 31 29 0.5 FRPL 34 38 42 4.0Non-FRPL 65 61 62 69 64 -0.3 Non-FRPL 63 70 68 2.5ColoradoColoradoFRPL 41 42 43 48 43 0.5 FRPL 47 51 53 3.0Non-FRPL 74 75 76 80 77 0.8 Non-FRPL 77 80 81 2.0TotalChangeGapGapFRPL (D)-Non-FRPL (S) -9 -14 -14 -11 -13 -4.0 FRPL (D)-Non-FRPL (S) -43 -42 -39 4.0TotalChangeUnsatisfactory 4 Unsatisfactory 4<strong>Denver</strong><strong>Denver</strong>FRPL 35 31 35 29 38 0.8 FRPL 27 25 25 -1.0Non-FRPL 10 13 15 10 15 1.3 Non-FRPL 13 9 12 -0.5ColoradoColoradoFRPL 23 21 24 19 25 0.5 FRPL 17 16 16 -0.5Non-FRPL 7 6 7 5 6 -0.3 Non-FRPL 4 4 4 0.0TotalChangeGapGapFRPL (D)-Non-FRPL (S) 28 25 28 24 32 4.0 FRPL (D)-Non-FRPL (S) 23 21 21 -2.0At or Above Proficient 8 At or Above Proficient 8<strong>Denver</strong><strong>Denver</strong>FRPL 28 23 25 29 28 0.0 FRPL 7 8 13 14 11.7Non-FRPL 65 57 57 65 59 -1.5 Non-FRPL 30 31 40 39 29.0ColoradoColoradoFRPL 41 39 39 43 40 -0.3 FRPL 15 18 21 22 23 2.0Non-FRPL 76 74 76 78 75 -0.3 Non-FRPL 47 50 54 56 57 2.5TotalChangeGapGapFRPL (D)-Non-FRPL (S) -48 -51 -51 -49 -47 1.0 FRPL (D)-Non-FRPL (S) -43 -46 -43 -43 0.0TotalChangeTotalChangeUnsatisfactory 8 Unsatisfactory 8<strong>Denver</strong><strong>Denver</strong>FRPL 29 34 37 32 35 1.5 FRPL 66 59 59 53 31.0Non-FRPL 9 14 17 12 16 1.8 Non-FRPL 39 36 31 32 19.0ColoradoColoradoFRPL 21 24 24 23 24 0.8 FRPL 51 48 41 44 39 -3.0Non-FRPL 6 7 6 6 6 0.0 Non-FRPL 21 19 15 16 13 -2.0TotalChangeGapGapFRPL (D)-Non-FRPL (S) 23 27 31 26 29 6.0 FRPL (D)-Non-FRPL (S) 47 44 43 40 -7.0TotalChange
<strong>Denver</strong>Colorado State Assessment Program<strong>DENVER</strong><strong>COLORADO</strong>Spring Spring Spring Spring Spring Spring Spring Avg. Yearly Spring Spring Spring Spring Spring Spring Spring Avg. YearlyReading Grade 2001 2002 2003 2004 2005 2006 2007 Change Reading Grade 2001 2002 2003 2004 2005 2006 2007 ChangeEnglish Language LearnersEnglish Language Learners4 4At or Above Proficient 14 13 10 15 21 1.8 At or Above Proficient 19 19 18 23 22 0.8Unsatisfactory 45 42 52 41 37 -2.0 Unsatisfactory 39 35 42 32 34 -1.38 8At or Above Proficient 17 12 7 7 9 -2.0 At or Above Proficient 17 13 9 14 12 -1.3Unsatisfactory 35 47 58 55 60 6.3 Unsatisfactory 37 41 43 41 43 1.5MathematicsMathematicsEnglish Language LearnersEnglish Language Learners4At or Above Proficient 25 30 46 10.5 At or Above Proficient 4 28 35 44 8.0Unsatisfactory 31 29 18 -6.5 Unsatisfactory 26 22 17 -4.58 8At or Above Proficient 7 5 4 9 9 0.5 At or Above Proficient 8 8 8 9 9 0.3Unsatisfactory 69 71 68 72 61 -2.0 Unsatisfactory 64 63 57 63 55 -2.3<strong>DENVER</strong><strong>COLORADO</strong>Spring Spring Spring Spring Spring Spring Spring Avg. Yearly Spring Spring Spring Spring Spring Spring Spring Avg. YearlyReading Grade 2001 2002 2003 2004 2005 2006 2007 Change Reading Grade 2001 2002 2003 2004 2005 2006 2007 ChangeStudents w/DisabilitiesStudents w/Disabilities4 4At or Above Proficient 12 13 14 12 12 0.0 At or Above Proficient 23 21 22 24 25 27 24 0.2Unsatisfactory 63 60 65 64 69 1.5 Unsatisfactory 44 47 46 42 46 41 48 0.78 8At or Above Proficient 12 10 9 8 11 -0.3 At or Above Proficient 19 18 19 17 20 19 17 -0.3Unsatisfactory 52 63 65 63 66 3.5 Unsatisfactory 42 43 41 49 45 47 49 1.2MathematicsMathematicsStudents w/DisabilitiesStudents w/Disabilities4 4At or Above Proficient 17 14 19 1.0 At or Above Proficient 32 33 34 1.0Unsatisfactory 56 56 55 -0.5 Unsatisfactory 32 31 33 0.58 8At or Above Proficient 3 3 4 4 7 1.0 At or Above Proficient 8 7 7 8 10 9 10 0.3Unsatisfactory 76 81 81 82 79 0.8 Unsatisfactory 63 64 68 71 65 68 65 0.3