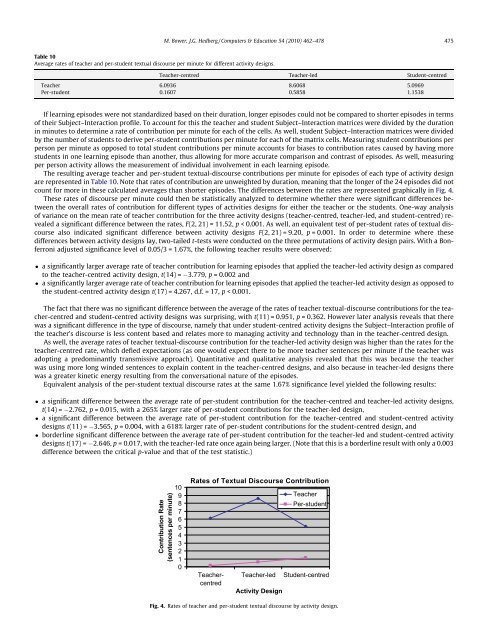
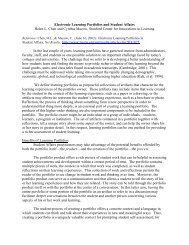
M. Bower, J.G. Hedberg / Computers & Education 54 (2010) 462–478 475Table 10Average rates <strong>of</strong> teacher and per-student textual <strong>discourse</strong> per minute for different activity designs.Teacher-centred Teacher-led Student-centredTeacher 6.0936 8.6068 5.0969Per-student 0.1607 0.5858 1.1538If learning episodes were not standardized based on their duration, longer episodes could not be compared to shorter episodes in terms<strong>of</strong> their Subject–Interaction pr<strong>of</strong>ile. To account for this the teacher and student Subject–Interaction matrices were divided by the durationin minutes to determine a rate <strong>of</strong> contribution per minute for each <strong>of</strong> the cells. As well, student Subject–Interaction matrices were dividedby the number <strong>of</strong> students to derive per-student contributions per minute for each <strong>of</strong> the matrix cells. Measuring student contributions perperson per minute as opposed to total student contributions per minute accounts for biases to contribution rates caused by having morestudents in one learning episode than another, thus allowing for more accurate comparison and contrast <strong>of</strong> episodes. As well, measuringper person activity allows the measurement <strong>of</strong> individual involvement in each learning episode.The resulting average teacher and per-student textual-<strong>discourse</strong> contributions per minute for episodes <strong>of</strong> each type <strong>of</strong> activity designare represented in Table 10. Note that rates <strong>of</strong> contribution are unweighted by duration, meaning that the longer <strong>of</strong> the 24 episodes did notcount for more in these calculated averages than shorter episodes. The differences between the rates are represented graphically in Fig. 4.These rates <strong>of</strong> <strong>discourse</strong> per minute could then be statistically analyzed to determine whether there were significant differences betweenthe overall rates <strong>of</strong> contribution for different types <strong>of</strong> activities designs for either the teacher or the students. One-way <strong>analysis</strong><strong>of</strong> variance on the mean rate <strong>of</strong> teacher contribution for the three activity designs (teacher-centred, teacher-led, and student-centred) revealeda significant difference between the rates, F(2, 21) = 11.52, p < 0.001. As well, an equivalent test <strong>of</strong> per-student rates <strong>of</strong> textual <strong>discourse</strong>also indicated significant difference between activity designs F(2, 21) = 9.20, p = 0.001. In order to determine where thesedifferences between activity designs lay, two-tailed t-tests were conducted on the three permutations <strong>of</strong> activity design pairs. With a Bonferroniadjusted significance level <strong>of</strong> 0.05/3 = 1.67%, the following teacher results were observed: a significantly larger average rate <strong>of</strong> teacher contribution for learning episodes that applied the teacher-led activity design as comparedto the teacher-centred activity design, t(14) = 3.779, p = 0.002 and a significantly larger average rate <strong>of</strong> teacher contribution for learning episodes that applied the teacher-led activity design as opposed tothe student-centred activity design t(17) = 4.267, d.f. = 17, p < 0.001.The fact that there was no significant difference between the average <strong>of</strong> the rates <strong>of</strong> teacher textual-<strong>discourse</strong> contributions for the teacher-centredand student-centred activity designs was surprising, with t(11) = 0.951, p = 0.362. However later <strong>analysis</strong> reveals that therewas a significant difference in the type <strong>of</strong> <strong>discourse</strong>, namely that under student-centred activity designs the Subject–Interaction pr<strong>of</strong>ile <strong>of</strong>the teacher’s <strong>discourse</strong> is less content based and relates more to managing activity and technology than in the teacher-centred design.As well, the average rates <strong>of</strong> teacher textual-<strong>discourse</strong> contribution for the teacher-led activity design was higher than the rates for theteacher-centred rate, which defied expectations (as one would expect there to be more teacher sentences per minute if the teacher wasadopting a predominantly transmissive approach). Quantitative and qualitative <strong>analysis</strong> revealed that this was because the teacherwas using more long winded sentences to explain content in the teacher-centred designs, and also because in teacher-led designs therewas a greater ki<strong>net</strong>ic energy resulting from the conversational nature <strong>of</strong> the episodes.Equivalent <strong>analysis</strong> <strong>of</strong> the per-student textual <strong>discourse</strong> rates at the same 1.67% significance level yielded the following results: a significant difference between the average rate <strong>of</strong> per-student contribution for the teacher-centred and teacher-led activity designs,t(14) = 2.762, p = 0.015, with a 265% larger rate <strong>of</strong> per-student contributions for the teacher-led design, a significant difference between the average rate <strong>of</strong> per-student contribution for the teacher-centred and student-centred activitydesigns t(11) = 3.565, p = 0.004, with a 618% larger rate <strong>of</strong> per-student contributions for the student-centred design, and borderline significant difference between the average rate <strong>of</strong> per-student contribution for the teacher-led and student-centred activitydesigns t(17) = 2.646, p = 0.017, with the teacher-led rate once again being larger. (Note that this is a borderline result with only a 0.003difference between the critical p-value and that <strong>of</strong> the test statistic.)Contribution Rate(sentences per minute)109876543210Rates <strong>of</strong> Textual Discourse ContributionTeachercentredTeacher-ledActivity DesignTeacherPer-studentStudent-centredFig. 4. Rates <strong>of</strong> teacher and per-student textual <strong>discourse</strong> by activity design.
476 M. Bower, J.G. Hedberg / Computers & Education 54 (2010) 462–478Thus the analytic approach availed by performing the standardisations not only uncovered significant differences in contribution ratesunder different activity designs, but provided a measure <strong>of</strong> those differences. Perhaps more interestingly the process could also be appliedto each <strong>of</strong> the coding categories in order to determine whether certain activity designs tended to have significantly higher or lower rates <strong>of</strong>a particular type <strong>of</strong> <strong>discourse</strong>.Individual Subject and interaction category contribution rates for teachers and students were analyzed in an attempt to determinewhether these differences in contribution rates could be attributed to a particular type <strong>of</strong> <strong>discourse</strong>. In order to improve the reliability<strong>of</strong> the <strong>analysis</strong>, only Subject types relating to learning with average rates <strong>of</strong> teacher textual-<strong>discourse</strong> contribution per episode <strong>of</strong> fiveor greater (i.e. 120 contributions across the 24 learning episodes) were considered for <strong>analysis</strong>. Once again all statistical tests used Bonferroniadjusted significance levels to account for the large number <strong>of</strong> comparisons being drawn. The following effects were detected:(1) There was a significantly lower mean rate <strong>of</strong> teacher Content textual-<strong>discourse</strong> contribution per minute for the student-centred asopposed to the teacher-led activity design with respective averages <strong>of</strong> 1.736 and 5.978 sentences per minute, t(17) = 6.485, p < 0.001.This illustrates the teacher delegation <strong>of</strong> responsibility for Content discussions to the students for the student-centred design.(2) There was a significantly higher mean rate <strong>of</strong> per-student Content textual-<strong>discourse</strong> contribution for the student-centred as opposedto the teacher-centred activity designs with respective averages <strong>of</strong> 0.648 and 0.090 sentences per minute, t(11) = 4.816, p < 0.001.This indicates the increase in student ownership over content in the student-centred as opposed to teacher-centred activity designs.(3) There was a borderline significantly lower mean rate <strong>of</strong> per-student Content textual-<strong>discourse</strong> contribution for the teacher-centredversus teacher-led activity designs with respective averages <strong>of</strong> 0.090 and 0.437 sentences per minute, t(14) = 3.261, p = 0.006. Onceagain, the teacher-centred activity design inhibits the rate <strong>of</strong> student Content textual-<strong>discourse</strong> contribution.(4) There was a significantly higher mean rate <strong>of</strong> teacher Independent Questions for the teacher-led as opposed to student-centred activitydesign with respective averages <strong>of</strong> 1.347 and 0.647 sentences per minute, t(17) = 3.278, p = 0.004. In the teacher-led activitydesign the teacher attempts to involve students by positing questions, whereas in the student-centred activity design there is lessneed because students are automatically involved by the nature <strong>of</strong> the task.(5) There was a significantly higher mean rate <strong>of</strong> teacher Independent Statements for the teacher-led as opposed to student-centredactivity type with respective averages <strong>of</strong> 4.360 and 2.726 sentences per minute, t(17) = 3.316, p = 0.004. In the student-centred activitydesign the teacher does not need to make as many directive and instructive comments.(6) There was a significantly lower mean rate <strong>of</strong> per-student Statement Response to Questions for the teacher-centred as opposed tostudent-centred activity types with respective averages <strong>of</strong> 0.090 and 0.346 sentences per minute, t(11) = 3.82, p = 0.003. Studentsare seldom responding to questions in the teacher-centred activity design, whereas in the student-centred design they have thechance to respond to the questions <strong>of</strong> both the teacher and each other.The results <strong>of</strong> performing the <strong>quantitative</strong> <strong>analysis</strong> above should be considered in light <strong>of</strong> the following qualifications: In each learning episode there was a range <strong>of</strong> affecting factors (such as student virtual classroom competencies, the specific details <strong>of</strong>the teacher implementation, the particular students involved in the learning episode and so on) that impact upon collaborations andthus comprise part <strong>of</strong> the error in this <strong>analysis</strong>. The sample is only a small subset <strong>of</strong> learning episodes in three different teaching semesters, by one teacher in one subject, and assuch cannot be considered representative <strong>of</strong> all activity designs. The external reliability <strong>of</strong> extrapolating these results to other educationalcontexts needs to be carefully considered.5. DiscussionThe <strong>quantitative</strong> <strong>multimodal</strong> <strong>discourse</strong> framework enables a pr<strong>of</strong>ile <strong>of</strong> individual learning episodes to be developed, that can then beused to compare and contrast lessons conducted in <strong>multimodal</strong> learning environments. The approach also allows global results to portrayedand <strong>quantitative</strong> <strong>analysis</strong> to be performed in an attempt to measure the impact <strong>of</strong> independent variables upon collaboration. Significantresults signaled important features <strong>of</strong> the data that could then be scrutinized using qualitative observation.5.1. Findings in this studyIn this study <strong>of</strong> web-conference based lessons the <strong>multimodal</strong> <strong>discourse</strong> <strong>analysis</strong> technique enabled significant differences between thecollaborative behaviors <strong>of</strong> the teacher and students to be detected. Across the whole dataset the teacher made significantly more Activity-relatedcomments (see Table 6). Qualitative observation revealed that this was due to attempts by the teacher to provide collaborative guidance.The teacher also made a significantly larger proportion <strong>of</strong> Independent Statements by virtue <strong>of</strong> an <strong>of</strong>ten transmissive approach to instruction(55.2% compared to 25.4% by students, see Tables 7 and 8). As well, the teacher tended to dominate the management <strong>of</strong> the collaborative technology(see Table 9). On the other hand students made a relatively larger proportion <strong>of</strong> Statement response to Questions (35.7% compared to6.1% by the teacher, see Tables 7 and 8) which qualitative <strong>analysis</strong> revealed was a result <strong>of</strong> making numerous replies to questions posed both bythe teacher and other students. Thus across the entire corpus <strong>of</strong> learning episodes the teacher played a more directive role.The <strong>multimodal</strong> <strong>discourse</strong> <strong>analysis</strong> technique allowed the significant influence <strong>of</strong> activity design (either teacher-centred, teacher-led, orstudent-centred) upon collaboration to be quantified. Levels <strong>of</strong> student <strong>discourse</strong> increased as less teacher-dominated activity designs wereapplied, with the student-centred activity design resulting in a more than six times larger rate <strong>of</strong> per-student contributions than for theteacher-centred design and more than two-and-a-half times than under teacher-led design (see Table 10). The level <strong>of</strong> teacher <strong>discourse</strong>also varied by the type <strong>of</strong> activity design, with the significantly less sentences contributed in the student-centred activity design as comparedto the teacher-led activity design (5.1 sentences per minute as opposed to 8.6 sentences per minute, see Table 10). Thus the <strong>multimodal</strong><strong>discourse</strong> <strong>analysis</strong> was able to provide a measure <strong>of</strong> the extra participation afforded by the movement from teacher-centred to more