Droplet Dynamics Changes in Electrostatic Sprays ... - ResearchGate
Droplet Dynamics Changes in Electrostatic Sprays ... - ResearchGate
Droplet Dynamics Changes in Electrostatic Sprays ... - ResearchGate

You also want an ePaper? Increase the reach of your titles
YUMPU automatically turns print PDFs into web optimized ePapers that Google loves.
9154 J. Phys. Chem. A 1998, 102, 9154-9160<strong>Droplet</strong> <strong>Dynamics</strong> <strong>Changes</strong> <strong>in</strong> <strong>Electrostatic</strong> <strong>Sprays</strong> of Methanol-Water MixturesZohra Olumee, † John H. Callahan, ‡ and Akos Vertes* ,†Department of Chemistry, The George Wash<strong>in</strong>gton UniVersity, Wash<strong>in</strong>gton D. C. 20052, andAnalytical Chemistry Section, Code 6113, NaVal Research Laboratory, Wash<strong>in</strong>gton, D.C. 20375ReceiVed: April 28, 1998; In F<strong>in</strong>al Form: September 22, 1998Two-dimensional phase Doppler anemometry measurements have been carried out to determ<strong>in</strong>e the size andvelocity distributions of electrosprayed droplets generated from methanol-water mixtures. We <strong>in</strong>vestigatedspray<strong>in</strong>g conditions close to those of electrospray ionization sources. The droplet size and the axial andradial velocity distributions were measured as a function of liquid flow rate, needle-to-counter electrode distance,bias voltage, position of the probe volume, and electrical conductivity of the liquid. In 90:10 (v/v) methanolwatermixtures the droplet size decreased from ∼7to∼1.6 µm as the conductivity <strong>in</strong>creased as a consequenceof a 3 orders of magnitude <strong>in</strong>crease <strong>in</strong> ionic strength. As the position of the probe volume was moved alongthe spray axis, two different spray dynamics were observed. Solutions of low conductivity (c < 10 -5 M) onthe average produced 5.5 µm droplets at the capillary that gradually decreased to 4.0 µm as the drops movedaway from the tip. Solutions of higher conductivity (c > 10 -3 M), however, resulted <strong>in</strong> smaller droplets atthe needle (1.6 µm) that <strong>in</strong>creased <strong>in</strong> size to 4.2 µm as the particles traveled toward the counter electrode.The droplet size reduction can be expla<strong>in</strong>ed by evaporation and/or Coulomb explosion, whereas the <strong>in</strong>crease<strong>in</strong> droplet size may be the consequence of droplet segregation or coalescence. Axial velocity distributionsshow compression along the spray axis (e.g., observed at 10 mm ∼50% reduction of the width at 4 mm isseen). Mov<strong>in</strong>g downstream, the average velocity of droplets from water-methanol mixtures decreasesmonotonically. Solutions conta<strong>in</strong><strong>in</strong>g KCl exhibit a maximum <strong>in</strong> axial droplet velocity as the probe volumemoves away from the capillary. These profile changes can be expla<strong>in</strong>ed by differences <strong>in</strong> the electric fielddistribution along the spray centerl<strong>in</strong>e.IntroductionIn the 1980s Fenn and co-workers <strong>in</strong>itiated a highly successfulapplication of electrostatic spray<strong>in</strong>g as a source of ions for massspectrometry. 1,2 They showed that us<strong>in</strong>g electrospray large andnonvolatile molecules can be ionized and transferred <strong>in</strong>to thegas phase without degradation. This discovery revolutionizedthe mass spectrometry of biomolecules. 3,4In the electrospray source, solute ionization is achieved byapply<strong>in</strong>g high voltage to a metal capillary through which a slowflow of the solution is ma<strong>in</strong>ta<strong>in</strong>ed. The potential gradientbetween the tip of the capillary and a counter electrode leadsto the deformation of the meniscus and to the emission ofcharged liquid fragments that often take the form of sphericaldroplets. Depend<strong>in</strong>g on the physical properties of the liquid(electric conductivity, dielectric constant, surface tension,viscosity, and density) and on the spray<strong>in</strong>g conditions (fieldstrength at the tip, <strong>in</strong>ternal diameter and wettability of thecapillary, and liquid flow rate), a rich variety of spray<strong>in</strong>g modescan be established. Accord<strong>in</strong>g to the phenomenological classificationof Cloupeau and Prunet-Foch, five major spray<strong>in</strong>gmodes can be dist<strong>in</strong>guished (dripp<strong>in</strong>g, cone jet, microdripp<strong>in</strong>g,jet, and sp<strong>in</strong>dle modes). 5,6 This picture is substantially coloredby variants of these modes (e.g., pulsed cone jet, multicone jet,ramified jet) and by the occurrence of corona discharge atelevated voltages.* Correspond<strong>in</strong>g author. Phone (202) 994-2717, Fax (202) 994-5873,E-mail vertes@gwu.edu.† The George Wash<strong>in</strong>gton University.‡ Naval Research Laboratory.Systematic <strong>in</strong>vestigations on the dispersion of liquids <strong>in</strong>tosmall charged droplets by an electrostatic field orig<strong>in</strong>ated morethan a century ago when Rayleigh noticed that electrifieddroplets became unstable and underwent fission. 7 On the basisof Rayleigh’s early results describ<strong>in</strong>g an isolated droplet, Zelenyalso calculated the criteria for its stability. 7,8 They found thatthe potential at which <strong>in</strong>stability began was proportional to thesquare root of the liquid surface tension.Hendricks and co-workers proposed a somewhat arbitrarymathematical model that related the solution properties, suchas surface tension, density, and conductivity, to the size andcharge of a droplet. 9-12 This group varied the solutionconductivity, the flow rate, and the field strength and measuredthe specific charge (charge-to-mass ratio) of the sprayed droplets.Both their theoretical and empirical models suggested that an<strong>in</strong>crease <strong>in</strong> solution conductivity and <strong>in</strong> field strength or adecrease <strong>in</strong> flow rate leads to an <strong>in</strong>crease <strong>in</strong> the specific chargeaccord<strong>in</strong>g to a power law. 12Tang and Gomez reported results on atmospheric-pressuresize, charge, and velocity distributions of heptane and deionizedwater 13-15 obta<strong>in</strong>ed by two optical diagnostic techniques: phaseDoppler anemometry (PDA) and flash shadowgraphy. Theyprovided clear photographic evidence of the Coulomb fissionprocess of charged droplets under <strong>in</strong>tense electric field stress. 13It was found that the droplet charge-to-volume ratio wasmonotonically decreas<strong>in</strong>g with <strong>in</strong>creas<strong>in</strong>g droplet size. Accord<strong>in</strong>gto their observations, larger droplets were closer to thelimit<strong>in</strong>g charge at which they underwent fission. 13Recently, the charge and size distributions of electrosprayeddrops have been studied by Fernandez de la Mora and10.1021/jp982027z CCC: $15.00 © 1998 American Chemical SocietyPublished on Web 10/28/1998
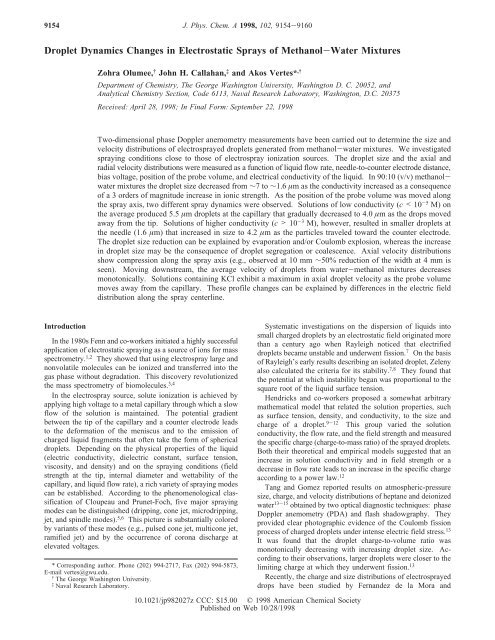
<strong>Electrostatic</strong> <strong>Sprays</strong> of Methanol-Water Mixtures J. Phys. Chem. A, Vol. 102, No. 46, 1998 9155TABLE 1: Comparative Chart of Some Electrospray Characterization Studiesmeasured properties spray<strong>in</strong>g mode spray<strong>in</strong>g conditions a methods refcharge and size distributions cone jet dibutyl sebacate and benzyl alcohol differential mobility 16i.d. ) 200 µm, U ) “several kV” analyzeraerodynamic sizespectrometerspecific charge not reported glycer<strong>in</strong> with NaCl time-of-flight spectrometer 12size distribution, specificchargei.d. ) 500 µm, U < 30 kVcone jet water with NaCl at 10 kV < U < 20 kV PDA 14, 18corona-assisted cone jet heptane at U ) “few kV”, i.d. ) 120 µm flash shadowgraphycurrent measurement1519spray current1-octanol, water, benzyl alcohol,formamide with LiCl or H 2SO 4ethylene glycol, triethylene glycol,ion currentdripp<strong>in</strong>g cone jet water, CH 3OH, CH 3CN, water + mass spectrometer 1multicone jetCH 3OH (50:50) with LiCl or NaCli.d. ) 100 µm, 2.4 kV < U < 9.4 kVion current not specified water + CH 3OH with NaCl or HCl mass spectrometer 21, 22i.d. ) 100 µm,2kV< U < 3kVion current, spray currentspray currentcone jetnanospraypulsat<strong>in</strong>g cone jetcone jetacetone with rhodam<strong>in</strong>e Gi.d. ) 250 µm at 2.5 kV < U < 3.6 kVi.d. ) 1-3 µmatU ) 600 Vwater + CH 3OH (50:50)2.2 kV < U < 4.0 kVai.d. and U denote the <strong>in</strong>ternal diameter and the voltage of the capillary, respectively.mass spectrometer,microscopecurrent measurement,microscope2320co-workers utiliz<strong>in</strong>g a differential mobility analyzer and anaerodynamic size spectrometer. 16,17 The sprayed drops wereselected with<strong>in</strong> a narrow electrical mobility range, and subsequentlythe associated current or size was measured. Theirf<strong>in</strong>d<strong>in</strong>gs <strong>in</strong>dicated that the charge distribution of electrospraydrops generated <strong>in</strong> cone-jet mode was 2.5 times broader thanthe correspond<strong>in</strong>g distribution of diameter. They related therandom process of jet breakup to the wavelength of axialmodulation of the jet. 16The complexity of spray<strong>in</strong>g modes made the electrosprayphenomenon an elusive target for rigorous <strong>in</strong>vestigations andseriously limited the ability to compare results from differentlaboratories. Table 1 lists the measured spray properties andspray<strong>in</strong>g conditions <strong>in</strong> some recent studies. It is clear fromcompar<strong>in</strong>g the fundamental studies of the spray<strong>in</strong>g process (firstthree rows of Table 1) with the studies on electrospray ionization(ESI) sources for mass spectrometry (rows four to seven of Table1) that there is very limited overlap between these groups <strong>in</strong>spray<strong>in</strong>g conditions. While well-controlled sprays were characterized<strong>in</strong> detail us<strong>in</strong>g powerful spray diagnostics, 12,14-16,18,19the sprays typically used <strong>in</strong> ESI are mostly studied by follow<strong>in</strong>gthe generated ion current or the capillary current. 1,20-23 Morespecifically, there is no detailed droplet size diagnostics availablefor the very important case of methanol-water mixtures sprayedat relatively low voltages (2.0 kV < U < 5.0 kV).Study<strong>in</strong>g the capillary current as a function of capillarypotential <strong>in</strong> 50:50 methanol-water mixtures, Rollgen and coworkersestablished three spray<strong>in</strong>g modes based on the presenceand frequency of current oscillations. 20 Mode I (2.2 kV < U< 2.5 kV) and mode II (2.5 kV < U < 2.8 kV) are characterizedby 30 Hz and low kilohertz current pulsation, respectively. Inmode III (2.8 kV < U < 4.0 kV) no current pulsation occurs.Optical <strong>in</strong>vestigation of the meniscus revealed that modes I andII corresponded to the pulsed cone-jet mode, whereas mode IIIco<strong>in</strong>cided with the cone-jet mode.The formation of charged droplets and their fate <strong>in</strong> the sprayare the basis of ion production <strong>in</strong> an ESI source. In ESI sourcesused <strong>in</strong> mass spectrometry, the solution properties can changedramatically from one sample to the other. For example, theionic strength and thus the conductivity of the sprayed solutionchange significantly with the salt content of the sample. Thus,Figure 1. Constant flow-rate electrospray setup consist<strong>in</strong>g of a syr<strong>in</strong>gepump, syr<strong>in</strong>ge, sta<strong>in</strong>less steel capillary, and planar ground electrode.Intersection of the PDA laser beams marks the probe volume.the ma<strong>in</strong> objective of our present study was to obta<strong>in</strong> dropletsize and velocity distributions for sprayed solutions typical ofESI under a broad range of spray<strong>in</strong>g conditions. We alsowanted to characterize the generated droplets as a function offluid delivery system and liquid properties such as liquid flowrate, bias voltage, position of the probe volume, and electricalconductivity.Experimental SectionThe schematic representation of the electrospray setup isshown <strong>in</strong> Figure 1. A steady flow of the sprayed liquid wasfed by a syr<strong>in</strong>ge pump (Sage Instruments, Boston, MA) <strong>in</strong>to ani.d. ) 150 µm and o.d. ) 510 µm sta<strong>in</strong>less steel capillary. Tofacilitate the desolvation of the droplets and to prevent electricbreakdown, the capillary was surrounded by a tapered glass tubethat provided a coaxial flow of dry nitrogen (see <strong>in</strong>set <strong>in</strong> Figure1). The flow rate of the gas was selected by a needle valveand kept constant throughout the measurements. An X-Y-Zstage afforded the translation of the syr<strong>in</strong>ge pump and the
9156 J. Phys. Chem. A, Vol. 102, No. 46, 1998 Olumee et al.spray<strong>in</strong>g assembly with an accuracy of 0.5 mm. Perpendicularto the capillary, a flat ground electrode was positioned at adistance of 30-35 mm. Stable spray<strong>in</strong>g was achieved byapply<strong>in</strong>g high voltage (3.0-4.8 kV) to the needle. These valueswere similar to the ones used <strong>in</strong> ESI sources for massspectrometry. 21,22 Lower<strong>in</strong>g the voltage to 2-3 kV <strong>in</strong>variablyresulted <strong>in</strong> pulsat<strong>in</strong>g sprays. Most of the systematic studies wereconducted at U ) 4.0 kV capillary voltage. The flow rate ofthe liquid was ma<strong>in</strong>ta<strong>in</strong>ed at 24 µL/m<strong>in</strong>, which was typical ofESI systems 21,22 but significantly higher than the values <strong>in</strong> someof the fundamental <strong>in</strong>vestigations. 16 As shown <strong>in</strong> Figure 1, theprobe volume was def<strong>in</strong>ed by the <strong>in</strong>tersection of four laserbeams.A two-color PDA system (Aerometrics, Sunnyvale, CA) wasused to simultaneously sample the size and the axial and radialvelocity distributions of the electrospray-generated droplets. Thescattered light from the particle travel<strong>in</strong>g through the probevolume was picked up by a receiv<strong>in</strong>g lens of 250 mm focallength positioned at 30° angle <strong>in</strong> forward scatter<strong>in</strong>g mode. Thesize of the probe volume depends on the collection angle andon the focal length of the focus<strong>in</strong>g lens. Us<strong>in</strong>g a 250 mm focallength lens and a 100 µm slit resulted <strong>in</strong> 200 µm width for theprobe volume. As has been po<strong>in</strong>ted out by Sankar et al., areceiv<strong>in</strong>g lens with short focal length improves both the accuracyand the resolution <strong>in</strong> the measurements of small sized droplets. 24S<strong>in</strong>ce the transmitter and receiver were positioned on oppositesides of the flow, system alignment was crucial and difficult toma<strong>in</strong>ta<strong>in</strong>. However, this orientation offered the best overallperformance, high S/N, and excellent size sensitivity for thePDA system. The scattered light was projected onto threephotomultiplier tubes (A, B, and C). Each detector produced aDoppler burst signal with a frequency proportional to the particlevelocity. The phase shifts between the Doppler burst signalsfrom the different detectors were proportional to the size of thespherical particles. Scatter<strong>in</strong>g obta<strong>in</strong>ed from nonsphericalparticles was rejected via a validation method based oncompar<strong>in</strong>g phase shifts on different pairs of detectors (e.g., A-Bwith B-C). If the phase shift difference exceeded 5%, theread<strong>in</strong>g was discarded by the signal-process<strong>in</strong>g unit.Special care was taken to m<strong>in</strong>imize the effect of scatter<strong>in</strong>gby multiple particles. Regular direct observation of the Dopplerburst signal on an oscilloscope (TDS 320, Tektronix, Beaverton,OR) provided evidence that the probe volume was small enoughto avoid significant contribution to the scatter<strong>in</strong>g signal by morethan one particle. Temporal variations <strong>in</strong> the spray conditionswere monitored by repeat<strong>in</strong>g the PDA measurements at differentstages after establish<strong>in</strong>g stationary spray conditions. Nosignificant variations were detected. Simultaneous size andvelocity measurements on the same droplet confirmed that therewas no size-dependent segregation between the droplets <strong>in</strong> termsof their velocities (see details <strong>in</strong> the Results and Discussionsection).Analytical reagent grade methanol (
<strong>Electrostatic</strong> <strong>Sprays</strong> of Methanol-Water Mixtures J. Phys. Chem. A, Vol. 102, No. 46, 1998 9157Figure 3. Effect of conductivity (ionic strength) on the average dropletdiameter, D 10, probe volume position, d pr, relationship. Ionic strengthof a 90:10 methanol-water mixture was adjusted by addition of KCl([, no KCl; 1, 5.0 × 10 -6 M; 2, 5.0 × 10 -5 M; b, 5.0 × 10 -4 M; 9,5.0 × 10 -3 M KCl). The grayed box on the right shows the cross sectionof the ground electrode.<strong>in</strong> the <strong>in</strong>itial droplet size, the observed variations at larger probevolume distance showed different trends for low-conductivity(no salt, 5.0 × 10 -6 and 5.0 × 10 -5 M) and for highconductivity(5.0 × 10 -4 and 5.0 × 10 -3 M) solutions. Inagreement with our prelim<strong>in</strong>ary observations, <strong>in</strong>creas<strong>in</strong>g themeasurement distance from the capillary led to a decrease <strong>in</strong>droplet size for low-conductivity solutions, whereas highconductivity resulted <strong>in</strong> an <strong>in</strong>crease <strong>in</strong> droplet size with distance.To compare our results on the conductivity dependence ofthe average diameter with previous studies, we used the scal<strong>in</strong>glaw <strong>in</strong>troduced by Fernandez de la Mora for solutions withelectrical conductivities κ > 10 -7 Ω -1 cm -1 . 16 For a varietyof conditions the droplet diameter, D, can be approximated asD ) G(ɛ,Π µ )( ɛɛ 0 Qκ) 1/3 (1)where Q and κ are the flow rate and the electrical conductivityof the liquid, respectively. G(ɛ,Π µ ) is a slowly vary<strong>in</strong>g functionof the dielectric constant, ɛ, and the viscosity variable, Π µ .Itisassumed <strong>in</strong> the derivation of eq 1 that the liquid is conductiveenough so that the diameter of the jet is much smaller than thei.d. of the needle. In addition, the liquid has to satisfy specificconditions on polarity or viscosity. 16 S<strong>in</strong>ce (1) has also beenverified on deionized water, 14 the solutions used <strong>in</strong> the presentstudy also satisfy the conditions for validity. For strongelectrolytes κ can be written asκ ) (Λ 0 m - Kc)c (2)where Λ 0 m is the molar conductivity at <strong>in</strong>f<strong>in</strong>ite dilution and Kis the Kohlrausch constant. Assum<strong>in</strong>g that for dilute solutionsthe variations <strong>in</strong> dielectric constant and viscosity are negligibleand keep<strong>in</strong>g the flow rate constant, the concentration dependenceof the average droplet diameter is expressed asD′D ( c′)1/3( ) c Λ0 m - Kc 1/3Λ 0 m - Kc′ (3))where D′ is the average droplet diameter at c′ concentration.Figure 4. Variation of relative droplet diameter with the <strong>in</strong>verse ofthe relative concentration for electrosprayed dilute KCl solutions. Thesolid l<strong>in</strong>e represents eq 4, whereas the dashed l<strong>in</strong>e is a l<strong>in</strong>ear fit to theexperimental data (R ) 0.99).For the lowest KCl concentration <strong>in</strong> this study c ) 5.0 ×10 -6 M and Λ m ) 104 Ω -1 cm 2 mol -1 for the methanol-basedsolutions; 25 thus, κ ) 5.2 × 10 -7 Ω -1 cm 2 and eq 1 applies. Inthe concentration range of our <strong>in</strong>terest variations <strong>in</strong> the molarconductivity of KCl are less than 6%; therefore, eq 3 simplifiestoD′D ≈ ( c c′) 1/3 (4)Figure 4 shows the measured relative diameter as a functionof relative concentration at d pr ) 2 mm probe volume positionfor KCl solutions spann<strong>in</strong>g 4 orders of magnitude <strong>in</strong> concentration.The solid straight l<strong>in</strong>e with a slope of one <strong>in</strong> Figure 4corresponds to eq 4. Although there was clear deviation fromeq 4 at elevated concentrations, a l<strong>in</strong>ear fit of the data po<strong>in</strong>tsyielded a slope of 0.82 and a regression coefficient of 0.99.Some of the assumptions, most notably about the concentration<strong>in</strong>dependentnature of G(ɛ,Π µ ), are likely to break down at highsalt content and may cause the discrepancies observed <strong>in</strong> Figure4.Shr<strong>in</strong>k<strong>in</strong>g droplet size with <strong>in</strong>creas<strong>in</strong>g distance from thespray<strong>in</strong>g tip has been observed repeatedly for high vaporpressure liquids such as heptane 13,18 and for deionized water. 14The droplet size reduction <strong>in</strong> these systems is <strong>in</strong>itiated byevaporation. Further dispersion of the liquid takes place as aconsequence of Coulomb fission lead<strong>in</strong>g to smaller droplets.The driv<strong>in</strong>g force beh<strong>in</strong>d Coulomb fission is that the evaporation<strong>in</strong>creases the charge-to-mass ratio of the droplets lead<strong>in</strong>g tosurface <strong>in</strong>stabilities and eventually to their rupture. On the basisof this physical picture, we had no difficulty expla<strong>in</strong><strong>in</strong>g theresults observed on low-conductivity liquids. It is not feasible,however, to expla<strong>in</strong> the observed average droplet size <strong>in</strong>crease<strong>in</strong> high-conductivity systems with the fission mechanism.The most plausible explanation for the apparent growth <strong>in</strong>the observed droplet size is a fractionation effect. Cone-jet typesprays are known to have two major directional components.The first one is composed of the larger primary dropletstravel<strong>in</strong>g close to the spray axis leav<strong>in</strong>g under a small solidangle. The second component is the “skirt” of the spray madeof smaller satellite droplets depart<strong>in</strong>g under a larger solid
9158 J. Phys. Chem. A, Vol. 102, No. 46, 1998 Olumee et al.Figure 5. Charge and potential distributions <strong>in</strong> two homopolar dropletsat large distance (top) and at close proximity (bottom). As the dropletsapproach each other, excess charges congregate at the opposite endsof the spheroids, and due to the presence of the electrolyte shield<strong>in</strong>gtakes place. Depend<strong>in</strong>g on the conductivity (ionic strength), shield<strong>in</strong>gmay be sufficient to m<strong>in</strong>imize electrostatic repulsion and promotecoalescence.angle. 13 As the spray diverges along its axis, the two components<strong>in</strong>creas<strong>in</strong>gly segregate. 16 While the smaller satellitedroplets move off axis, the larger primary droplets rema<strong>in</strong> closeto the center. This process leads to the enrichment of thesampled downstream axis locations <strong>in</strong> larger droplets. Increas<strong>in</strong>gsegregation with <strong>in</strong>creas<strong>in</strong>g conductivity can be expla<strong>in</strong>edby assum<strong>in</strong>g enhanced space-charge repulsion due to theformation of smaller highly charged droplets.Another possible <strong>in</strong>terpretation of the grow<strong>in</strong>g droplet sizeis the <strong>in</strong>creas<strong>in</strong>g <strong>in</strong>cidence of droplet coalescence at higherconductivities, i.e., higher ionic strengths. Given the substantialamount of charges associated with the droplets, their collisionand coalescence are considered unlikely even at large particledensities. There are two factors, however, that might help toexpla<strong>in</strong> the collision of homopolar droplets. The first one istheir high k<strong>in</strong>etic energy. Based on the measured values of theaverage diameter (∼2 µm) and the velocity (∼10 m/s), thek<strong>in</strong>etic energy of a s<strong>in</strong>gle droplet is E k<strong>in</strong> ≈ 2 × 10 -6 erg or∼10 6 eV. More importantly, when two droplets of similarcharge approach each other, they undergo deformation andcharge rearrangement (see Figure 5). As the droplets approacheach other, their shape changes from spherical to elongatedspheroid, and the free charges orig<strong>in</strong>ally located at the surfacecongregate at the opposite ends of the spheroid. With<strong>in</strong> thedroplet the ions of the strong electrolyte rearrange, so as theymodify the orig<strong>in</strong>al Coulomb potential around the sphere <strong>in</strong>toa shielded Coulomb potential with a shield<strong>in</strong>g length that is<strong>in</strong>versely proportional to the square root of the ionic strengthFigure 6. Axial velocity distribution of droplets electrosprayed from90% CH 3OH at different probe volume positions, d pr. Mov<strong>in</strong>g awayfrom the capillary tip, the average velocity drops and the velocity spreadis compressed. Correspond<strong>in</strong>g radial velocity distributions are shown<strong>in</strong> the <strong>in</strong>sets for d pr ) 4mmandd pr ) 22 mm.(see <strong>in</strong>sets <strong>in</strong> Figure 5). Increas<strong>in</strong>g the ionic strength shortensthe shield<strong>in</strong>g length and at sufficiently high conductivity; i.e.,high electrolyte concentration may elim<strong>in</strong>ate the repulsionbetween the two approach<strong>in</strong>g droplets. For example, theshield<strong>in</strong>g length, r D , for a 5.0 × 10 -6 M KCl aqueous solutionis 140 nm, whereas at 5.0 × 10 -3 M r D ) 4 nm. This sharp<strong>in</strong>crease <strong>in</strong> shield<strong>in</strong>g <strong>in</strong> comb<strong>in</strong>ation with the charge rearrangementmay lead to coalescence upon collision. We need tomention thatsas was shown by Rayleigh and Taylors too muchdeformation of a droplet leads to fission. 7,26 When the lengthof a droplet exceeds the equatorial diameter by a factor of 1.9,the droplet becomes unstable. Thus, collision of droplets canlead to coalescence, fission, or a comb<strong>in</strong>ation of the two.Axial and radial velocity distributions of droplets sprayedfrom 90% CH 3 OH are shown <strong>in</strong> Figure 6. There was aremarkable variation <strong>in</strong> the axial velocity distributions as afunction of probe volume position. When the measurementswere conducted closer to the capillary tip (e.g., d pr ) 4 mm),broader distributions and larger mean velocities were observed.As the distance <strong>in</strong>creased from d pr ) 4 to 10 and to 22 mm, theaxial mean velocity decreased from 34.5 to 11.4 and to 9.6 m/s,respectively. At the same time, the width of the velocitydistributions became significantly narrower. Compar<strong>in</strong>g thedistributions revealed that the fwhm at d pr ) 10 and 22 mmdownstream were about one-half and one-third of the fwhm atd pr ) 4 mm, respectively. While slow<strong>in</strong>g of the droplets canbe a natural consequence of the <strong>in</strong>terplay between the electricfield and the drag force, the velocity compression can berationalized by look<strong>in</strong>g at the actual form of the latter. Forflows with Re < 1000, the explanation can be based on thevelocity-dependent nature of the corrected Stokes drag force,F dr : 18F dr ) 3πµD(1 + 0.158Re 2/3 )(v - v g ) (5)where µ is the viscosity of the medium, Re is the Reynoldsnumber, and v and v g are the velocities of the particle and thegas, respectively. Assum<strong>in</strong>g that the velocity of the gas isconstant <strong>in</strong> the region of <strong>in</strong>terest, higher droplet velocitycorresponds to higher decelerat<strong>in</strong>g force. Thus, the fasterparticles are slowed more efficiently than the slow ones lead<strong>in</strong>gto the bunch<strong>in</strong>g of velocities.
<strong>Electrostatic</strong> <strong>Sprays</strong> of Methanol-Water Mixtures J. Phys. Chem. A, Vol. 102, No. 46, 1998 9159Figure 7. Probe volume position dependence of average axial velocity,V ax, of droplets generated from a 90:10 methanol-water mixture (b)and from the same solvent doped with 5.0 × 10 -6 M(2) and with 5.0× 10 -3 M(9) KCl.Radial velocity distributions are shown <strong>in</strong> the <strong>in</strong>sets of Figure6. These distributions were substantially narrower than theiraxial counterparts. They were centered around zero and showedno dependence on the probe volume position. This observationhad some implications on the forces controll<strong>in</strong>g the motion <strong>in</strong>the radial direction. S<strong>in</strong>ce the most significant forces act<strong>in</strong>gon a droplet at these velocities are related to the external electricfield, E ext , the electric field associated with space charge, E sc ,and the drag force, one can writeF ) zeE ext + zeE sc - F dr (6)where z is the number of elementary charges, e, on the droplet.No change <strong>in</strong> the radial velocity distribution means that theensemble average of the radial component of F is close to zero.Thus, <strong>in</strong> radial direction either the electrostatic forces balanceout the drag force or all of them are negligible.For three solutions of different conductivity, the probe volumeposition dependence of the average axial velocity is displayed<strong>in</strong> Figure 7. Observ<strong>in</strong>g the data at d pr ) 2 mm probe position<strong>in</strong>dicated that <strong>in</strong>creas<strong>in</strong>g the conductivity led to lower<strong>in</strong>g of the<strong>in</strong>itial velocity. Indeed, the droplets from a 90:10 methanolwatermixture departed with an average velocity >37 m/s,whereas from 5.0 × 10 -6 and 5.0 × 10 -3 M KCl solutions theyleft with a speed of 27 and 4 m/s, respectively. One mightconclude that this behaviors<strong>in</strong> comb<strong>in</strong>ation with the observedshr<strong>in</strong>kage <strong>in</strong> <strong>in</strong>itial droplet size with <strong>in</strong>creas<strong>in</strong>g conductivitysis related to the morphological changes of the cone-jet structureand to the profound differences <strong>in</strong> field penetration due toshield<strong>in</strong>g.Another <strong>in</strong>terest<strong>in</strong>g feature <strong>in</strong> Figure 7 is the difference <strong>in</strong>the position dependence of droplet velocities from differentsolutions. The droplets from pure solvent (90% methanol)exhibited monotonically decreas<strong>in</strong>g average velocities with<strong>in</strong>creas<strong>in</strong>g distance from the probe tip, whereas the KCl solutionsshowed maximum velocity at a f<strong>in</strong>ite distance from the capillary.Tang and Gomez obta<strong>in</strong>ed the spray momentum equation onthe centerl<strong>in</strong>e <strong>in</strong> the follow<strong>in</strong>g form:V z∂V z∂z = 1 m F z (7)Figure 8. Velocity-size correlation of droplets electrosprayed from90:10 CH 3OH-water mixture and from 5.0 × 10 -5 and 5.0 × 10 -3 MKCl solutions. In the lowest-conductivity case (no salt) there are somevery large droplets, whereas <strong>in</strong> the high-conductivity case (5.0 × 10 -3M KCl) the velocity distribution is substantially broadened. As theconductivity <strong>in</strong>creases, the size distribution compresses and the averagevelocity as well as its spread grows.where the z subscript signifies the axial component of thevelocity and the force determ<strong>in</strong>ed by eqs 5 and 6. The overbar<strong>in</strong>dicates average quantities def<strong>in</strong>ed us<strong>in</strong>g the f(x,v) dropletdistribution function; for example, the average velocity iscalculated as v ≡ (1/N)∫f(x,v)v dv, where N ≡∫f(x,v) dv.Equation 7 is based on a number of specific assumptionsregard<strong>in</strong>g the spray (no source or s<strong>in</strong>k terms, no evaporationeffects, steady-state conditions, monodispersity, etc.). Some ofthese are clearly not fulfilled <strong>in</strong> our spray (chang<strong>in</strong>g dropletsize, departure from monodispersity), and some others are notverified. Thus, quantitative evaluation of the results based oneq 7 is unfounded. Already <strong>in</strong> this simplified form, however,eq 7 shows a relationship between the position dependence ofthe axial velocity and the distribution of electric field. Assum<strong>in</strong>gthat there is no first-order effect by the conductivity on the dragforce, one can argue that the significant changes <strong>in</strong> the shapeof V ax (d pr ) with conductivity are primarily due to changes <strong>in</strong>the space-charge component of the electric field. More specifically,one can assume that the accelerat<strong>in</strong>g effect on highconductivitydroplets near the capillary is the consequence of asharper potential drop <strong>in</strong> that region correspond<strong>in</strong>g to “shield<strong>in</strong>g”by the high-ionic-strength droplets.Axial velocity-size correlation charts for methanol-watermixtures at different salt content are shown <strong>in</strong> Figure 8. Inthis data acquisition mode velocity and diameter data aregathered on the same particle and rendered on a scatter chart.Statistical analysis of correlated measurements helps to f<strong>in</strong>d<strong>in</strong>terdependence between variables and to detect segregationeffects. The data were collected on the centerl<strong>in</strong>e, 10 mm awayfrom the capillary tip where the accelerat<strong>in</strong>g effect of the electricfield was negligible. One of the <strong>in</strong>terest<strong>in</strong>g features, observedwith 90% methanol, is the presence of an extended tail <strong>in</strong> the
9160 J. Phys. Chem. A, Vol. 102, No. 46, 1998 Olumee et al.size distribution lead<strong>in</strong>g to some very large droplets (D > 40µm). In accordance with Figures 3 and 7, at 5.0 × 10 -6 MKCl concentration the center of the distribution shifts to smallersizes and higher velocities. Somewhat unexpectedly, the spreadof axial droplet velocities also <strong>in</strong>creases significantly. At 5.0× 10 -3 M KCl concentration the center of the distributionshifted to smaller diameters, and the average velocity (as wellas its spread) decreased.It was worth not<strong>in</strong>g that there was no correlation betweensize and velocity for any of the solutions. Similarly, nosegregation of particles was observed. These f<strong>in</strong>d<strong>in</strong>gs supportthe mathematical decoupl<strong>in</strong>g of the droplet distribution function:f(z,V ax ) ) f 1 (z) f 2 (V ax ). In other words, the size and velocitydistributions measured separately can be comb<strong>in</strong>ed to providethe droplet distribution function. It is known, however, thatthe radial component of the velocity shows correlation with thesize of the particles. 18 The larger primary droplets exhibit lowerradial velocities, whereas the smaller satellite droplets havehigher radial velocity components. This effect leads to thesegregation of the primary and satellite droplets under differentsolid angles. Although we measured radial droplet velocitydistributions, the correspond<strong>in</strong>g size-velocity correlations werenot recorded. Moreover, due to the small size cutoff of ourPDA system (0.5 µm), most of the satellite droplets probablywent undetected.ConclusionsBased on PDA, observations of ESI type sprays used <strong>in</strong> iongeneration led to the recognition of significant changes <strong>in</strong> spraydynamics as the conductivity of the liquid was <strong>in</strong>creased. Asthe conductivity grew with<strong>in</strong> the boundaries of normal operat<strong>in</strong>gconditions, we detected a reversal <strong>in</strong> trend from shr<strong>in</strong>k<strong>in</strong>gaverage droplet size along the spray axis to a grow<strong>in</strong>g one. Atthe same time, the average axial velocity profile changed froma monotonic drop to maximum behavior. The sampl<strong>in</strong>guniformity of these sprays improved downstream <strong>in</strong> terms ofboth their average diameter and axial velocity. For example,at 22 mm probe volume position V ax was ∼10 m/s <strong>in</strong>dependentof the velocity at the tip of the capillary and <strong>in</strong>dependent of theconductivity (Figure 7). Similarly, the D 10 values convergedas the droplets approached this region (Figure 3). This behaviorhas beneficial implications for the design of ESI sources.Prevail<strong>in</strong>g source designs feature a comparable distance betweenthe spray<strong>in</strong>g needle and the sampl<strong>in</strong>g capillary. To rationalizethe grow<strong>in</strong>g average droplet size <strong>in</strong> high-conductivity solutions,we offered two alternative explanations. One was based on sizedependentsegregation along the spray axis, whereas the otherevoked a coalescence model based on droplet-droplet polarizationand <strong>in</strong>ternal shield<strong>in</strong>g.Acknowledgment. The authors thank the f<strong>in</strong>ancial assistanceof the National Science Foundation (CHE-9512441) for purchas<strong>in</strong>gthe PDA <strong>in</strong>strument. Z.O. is grateful for partial supportby the George Wash<strong>in</strong>gton University. Discussions with KeqiTang of F<strong>in</strong>nigan Co. were valuable <strong>in</strong> provid<strong>in</strong>g alternativeexplanations for some of the data. The fabrication of the spray<strong>in</strong>gassembly and helpful advice on its operation by M. Shahgholiare appreciated.References and Notes(1) Yamashita, M.; Fenn, J. B. J. Phys. Chem. 1984, 88, 4451-4459.(2) Meng, C. K.; Mann, M.; Fenn, J. B. J. Phys. D: At., Mol. Clusters1988, 10, 361-368.(3) Fenn, J. B. J. Am. Soc. Mass Spectrom. 1993, 4, 524-535.(4) Fenn, J. B.; Mann, M.; Meng, C. K.; Wong, S. F.; Whitehouse, C.M. Mass Spectrom. ReV. 1990, 9, 37-70.(5) Cloupeau, M.; Prunet-Foch, B. J. Aerosol Sci. 1994, 25, 1021-1036.(6) Cloupeau, M.; Prunet-Foch, B. J. Electrost. 1990, 25, 165-184.(7) Rayleigh F. R. S. Philos. Mag. 1882, 14, 184-186.(8) Zeleny, B. A. Proc. Cambridge Philos. Soc. 1916, 18, 71-83.(9) Hendricks, C. D. J. Colloid Interface Sci. 1962, 17, 249-259.(10) Hogan, J. J.; Hendricks, C. D. AIAA J. 1965, 3, 296-301.(11) Swatik, D. S.; Hendricks, C. D. AIAA J. 1968, 6, 1596-1597.(12) Pfeifer, R. J.; Hendricks, C. D. AIAA J. 1968, 6, 496-502.(13) Gomez, A.; Tang, K. Phys. Fluids 1994, 6, 404-414.(14) Tang, K.; Gomez, A. J. Aerosol Sci. 1994, 25, 1237-1249.(15) Tang, K.; Gomez, A. J. Colloid Interface Sci. 1995, 175, 326-332.(16) De Juan, L.; Fernandez de la Mora, J. J. Colloid Interface Sci. 1997,186, 280-293.(17) Loscertales, G.; Fernandez de la Mora, J. J. Chem. Phys. 1995,12, 5041-5060.(18) Tang, K.; Gomez, A. Phys. Fluids 1994, 6, 2317-2332.(19) Fernandez de la Mora, J.; Loscertales, I. G. Fluid Mech. 1994, 260,155-184.(20) Juraschek, R.; Schmidt, A.; Karas, M.; Rollgen, F. W. In Proceed<strong>in</strong>gsof the 45th ASMS Conference on Mass Spectrometry and Allied Topics,Palm Spr<strong>in</strong>gs, CA; ASMS: Santa Fe, NM, 1997; p 117.(21) Kebarle, P.; Tang, L. Anal. Chem. 1993, 65, 972A-986A.(22) Tang, L.; Kebarle, P. Anal. Chem. 1991, 63, 2709-2715.(23) Wilm, M. S.; Mann, M. Int. J. Mass Spectrom. Ion Processes 1994,136, 167-180.(24) Sankar, S. V.; Weber, B. J.; Kamemoto, D. Y.; Bachalo, W. D.Appl. Opt. 1991, 30, 4914-4920.(25) Kebarle, P.; Ho, Y. In Electrospray Ionization Mass Spectrometry:fundamentals, <strong>in</strong>strumentation, and applications; Cole, R. B., Ed.;John Wiley & Sons: New York, 1997; pp 3-63.(26) Taylor, G. Proc. R. Soc. London, Ser. A 1964, 280, 383-397.