State of the Watershed Report - The Stony Brook-Millstone ...
State of the Watershed Report - The Stony Brook-Millstone ...
State of the Watershed Report - The Stony Brook-Millstone ...

Create successful ePaper yourself
Turn your PDF publications into a flip-book with our unique Google optimized e-Paper software.
<strong>State</strong> <strong>of</strong> <strong>the</strong><strong>Watershed</strong><strong>Report</strong> 2010<strong>Stony</strong> <strong>Brook</strong>-<strong>Millstone</strong> <strong>Watershed</strong> AssociationYour water Your environment Your voice.<strong>State</strong> <strong>of</strong> <strong>the</strong> <strong>Watershed</strong> <strong>Report</strong> 20101~
What is a watershed?A watershed is an area <strong>of</strong> land that drains into aparticular body <strong>of</strong> water, such as a stream, river,pond or lake. A watershed is not determined bypolitical boundaries, but instead is shaped bynature’s hills and valleys. No matter where you live,you live in a watershed – and it’s up to all <strong>of</strong> us toprotect it.© Pennsylvania Department <strong>of</strong> Environmental Protection2~cover photo ©Tom Grimes
Table <strong>of</strong> ContentsI. Introduction ............................................. 5II. Water Quality ........................................... 7a. Bacteria ............................................... 9b. TSS ..................................................... 11c. Nutrients ............................................ 13d. Aquatic Life........................................ 17e. Dissolved Oxygen ............................... 19III. Environmental Policy ............................. 21a. Project for Municipal Excellence ...... 23b. Stream Corridor Protection ............... 25c. Septic System Management ................ 27d. Forest Protection ................................ 29IV. Land Use ................................................. 31a. 1930 ................................................... 32b. 1972 ................................................... 34c. 2002 ................................................... 35V. Findings ................................................. 37VI. Conclusion .............................................. 38VII. Appendix: References& Acknowledgements .............................. 39<strong>State</strong> <strong>of</strong> <strong>the</strong> <strong>Watershed</strong> <strong>Report</strong> 20103~
<strong>Watershed</strong> Map<strong>Stony</strong> <strong>Brook</strong>-<strong>Millstone</strong><strong>Watershed</strong> Reserve4~
IntroductionToday our water is threatened as never before. From population growth andincreased development to environmental changes associated with global warming,central New Jersey’s lakes, rivers, streams and groundwater sources facenumerous challenges. Our watershed is home to hundreds <strong>of</strong> thousands <strong>of</strong> peoplewho rely on our valuable natural resources to maintain <strong>the</strong>ir quality <strong>of</strong> life.For more than six decades, <strong>the</strong> <strong>Stony</strong> <strong>Brook</strong>-<strong>Millstone</strong> <strong>Watershed</strong> Association hasworked to protect clean water and <strong>the</strong> environment in central New Jersey throughconservation, advocacy, science and education. Founded in 1949 by a handful <strong>of</strong>citizens concerned about <strong>the</strong> health <strong>of</strong> our streams, <strong>the</strong> <strong>Watershed</strong> Associationwas one <strong>of</strong> <strong>the</strong> first organizations in <strong>the</strong> nation to protect a region based on naturalboundaries instead <strong>of</strong> political borders.Winner <strong>of</strong> a 2009 NJ Governor’s Environmental Excellence Award for ourenvironmental leadership and dedication to protecting clean water, we protect<strong>the</strong> <strong>Stony</strong> <strong>Brook</strong>-<strong>Millstone</strong> <strong>Watershed</strong> – a 265-square-mile area <strong>of</strong> central NewJersey that drains to <strong>the</strong> <strong>Millstone</strong> River and it’s tributaries, including <strong>the</strong> <strong>Stony</strong><strong>Brook</strong>. Spanning five counties and 26 towns, this region includes a wide range <strong>of</strong>important wildlife habitat and areas critical to <strong>the</strong> health <strong>of</strong> our water, such as <strong>the</strong>dense forests and vernal pools <strong>of</strong> <strong>the</strong> Sourland Mountains, <strong>the</strong> Delaware & RaritanCanal, <strong>the</strong> grasslands <strong>of</strong> Six Mile Run and vast expanses <strong>of</strong> open farmland andsensitive wetlands.Inspired by our 60th Anniversary, we took on <strong>the</strong> challenge <strong>of</strong> compiling this firstevercomprehensive look at <strong>the</strong> <strong>Stony</strong> <strong>Brook</strong>-<strong>Millstone</strong> <strong>Watershed</strong>. Using dataga<strong>the</strong>red in three categories: Water Quality, Environmental Policy and Land Usethis report outlines <strong>the</strong> conditions today, what we as an Association are doing toaddress <strong>the</strong> problems and steps everyone can take to protect clean water and <strong>the</strong>environment.<strong>State</strong> <strong>of</strong> <strong>the</strong> <strong>Watershed</strong> <strong>Report</strong> 20105~
<strong>The</strong> <strong>Watershed</strong> Association’sStreamWatch program monitors<strong>the</strong> health <strong>of</strong> our water at 42locations. Here a Chemical ActionTeam member takes a sample.StreamWatchSites Map6~
Water QualityOur watershed by <strong>the</strong>numbers …native grasses plantedthroughout <strong>the</strong> watershedsince 1997streambank restored since1997removed from localwaterways since 2007If you live in central New Jersey, your drinking water may come from <strong>the</strong> lakes,rivers, streams or groundwater <strong>of</strong> <strong>the</strong> <strong>Stony</strong> <strong>Brook</strong>-<strong>Millstone</strong> <strong>Watershed</strong>, or acombination <strong>of</strong> <strong>the</strong>se sources. With so many people depending on millions <strong>of</strong>gallons <strong>of</strong> water every day, it’s in all <strong>of</strong> our interests to keep our water sourcesclean and healthy.<strong>The</strong> actions we take as individuals – avoiding fertilizing our lawns, removing litter,picking up pet waste – and <strong>the</strong> laws and policies adopted by our towns and <strong>the</strong>state, have a direct effect on <strong>the</strong> quality <strong>of</strong> our streams and groundwater. To ensurewe all have clean water to drink and use and that fish and wildlife have healthyhabitats, <strong>the</strong> <strong>Stony</strong> <strong>Brook</strong>-<strong>Millstone</strong> <strong>Watershed</strong> Association scientifically monitors<strong>the</strong> health <strong>of</strong> our water, cleans and restores ailing waterways, and works to preventfuture degradation.Our StreamWatch Water Quality Monitoring Program, started in 1992, collectschemical and biological data at 42 sites throughout our watershed. Throughchemical testing we analyze water samples for nitrates, orthophosphates,temperature, pH, turbidity, and dissolved oxygen. Through biological testingwe collect and identify insect samples to determine a water quality rating. Andour bacterial monitoring gives an indication <strong>of</strong> how clean our waterways are forswimming by testing for Escherichia coli (abbreviated as E. coli) bacteria. Weprovide every municipality in our watershed with an annual report <strong>of</strong> test resultsand related ordinance recommendations. <strong>The</strong> recent purchase <strong>of</strong> new equipment,a spectrophotometer, is bolstering our testing capabilities by allowing us to confirmhigh test result readings with even more specificity.<strong>The</strong> following pages focus on six parameters used to judge water quality: Bacteria,Total Suspended Solids, Nitrates, Orthophosphates, Aquatic Life and DissolvedOxygen. Data used is from <strong>the</strong> NJ Department <strong>of</strong> Environmental Protection(NJDEP) and <strong>Watershed</strong> Association monitoring efforts. StreamWatch and <strong>the</strong>NJDEP use different analytical methods to determine test results (see Appendix onpage 39 to learn more). <strong>The</strong>se different testing methods and <strong>the</strong> difference in how<strong>of</strong>ten areas are tested account for some <strong>of</strong> <strong>the</strong> contradictions in data on <strong>the</strong> mapsthat follow.<strong>State</strong> <strong>of</strong> <strong>the</strong> <strong>Watershed</strong> <strong>Report</strong> 20107~
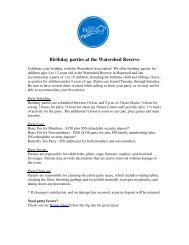
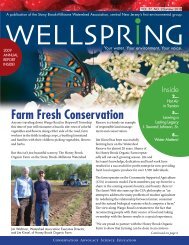
Fecal coliform and Escherichiacoli (E. coli) bacteria live in<strong>the</strong> intestinal tracts <strong>of</strong> animalsand are indicators that o<strong>the</strong>rdisease-causing bacteria maybe in our water.Water Quality -Bacterial DistributionRoyce <strong>Brook</strong>MANVILLEMILLSTONEBOROHILLSBOROUGHFRANKLINEASTAMWELLRockMONTGOMERY<strong>Brook</strong>Cruser <strong>Brook</strong>Back <strong>Brook</strong>RunPike<strong>Millstone</strong>andDelawareRaritanRiverCanalTen Mile RunSix Mile RunNORTHBRUNSWICKNEWJERSEYWESTAMWELLHOPEWELLBOROBeden<strong>Brook</strong>ROCKYHILLPRINCETONHeathcote <strong>Brook</strong>SOUTH BRUNSWICKHOPEWELL<strong>Brook</strong><strong>Stony</strong>Honey<strong>Brook</strong>PRINCETONBOROCarnegieLakeDevil’s<strong>Brook</strong>PLAINSBOROShallow<strong>Brook</strong>StreamWatch/<strong>Watershed</strong>Association SitesMeetsViolatesPENNINGTONNJDEP 2008 Draft IntegratedList results by subwatershedMeetsViolatesNot SampledLAWRENCE<strong>Stony</strong> <strong>Brook</strong>Duck PondRunStreamWatch E. coli data was collectedbetween June 2009 and July 2009.WESTWINDSORCranburyGrovers MillPond<strong>Watershed</strong> Association fecal coliform datawas collected between May 2005 and September 2006.NJDEP Integrated List results based on fecal coliformor E. coli data collected between January 2002 andDecember 2006.<strong>Brook</strong>Big Bear<strong>Brook</strong>Bear <strong>Brook</strong>CRANBURYHIGHTSTOWNEASTWINDSORROBBINSVILLE<strong>Millstone</strong>RockyRiver<strong>Brook</strong>ROOSEVELTMONROEMILLSTONEMANALAPANData Sources: NJ Department <strong>of</strong> Environmental Protection – Draft NJ Integrated Water Quality Monitoring and Assessment<strong>Report</strong> 2008, Stream Drainage Areas [HUC 14] 1999, Streams 2002, Lakes 2002, and <strong>Watershed</strong> Management Area 2000; NJDepartment <strong>of</strong> Transportation – Roads 2007; and SBMWA – StreamWatch data. With <strong>the</strong> exception <strong>of</strong> SBMWA, this secondarymap product has not been verified or authorized by <strong>the</strong> source agencies. Map created by <strong>the</strong> GIS Center <strong>of</strong> <strong>the</strong> <strong>Stony</strong> <strong>Brook</strong>-<strong>Millstone</strong> <strong>Watershed</strong> Association 10/2009. Project: 2009<strong>State</strong><strong>of</strong><strong>the</strong><strong>Watershed</strong>-Bacteria.mxd8~
<strong>State</strong> Water Quality Standard(Primary Contact)Geometric AverageE. coli 126 colony forming units(cfu) / 100 milliliters(mL) <strong>of</strong> waterSingle Sample Maximum235 cfu / 100 mLFecal coliform 200 cfu / 100 mL 400 cfu / 100 mL ** Only 10 percent or less <strong>of</strong> <strong>the</strong> total samples taken during any 30-day period may exceed this amount.BacteriaWhat you can do...at home: pet waste properly (in trash or flushdown <strong>the</strong> toilet – not down a stormdrain). in your backyard and plant shrubs andtall grasses along ponds and lakes todiscourage <strong>the</strong> nesting <strong>of</strong> geese. <strong>the</strong>m out <strong>of</strong> streams, lakes and rivers. septic system.What is it?Escherichia coli (abbreviated as E. coli) is a type <strong>of</strong> bacteria that lives in <strong>the</strong> intestinaltracts <strong>of</strong> animals and humans. While E. coli contamination <strong>of</strong> food can cause serious foodpoisoning, this bacteria’s existence in water bodies is usually harmless. However, it isan indicator that o<strong>the</strong>r pathogens <strong>of</strong> fecal origin – disease-causing bacteria, viruses andparasites – may be present.Why is it important?Swimming or wading in streams with high E. coli levels is considered to be a humanhealth risk.How does <strong>the</strong> watershed measure up?As you can see on <strong>the</strong> map to <strong>the</strong> left, much <strong>of</strong> <strong>the</strong> water in <strong>the</strong> <strong>Stony</strong> <strong>Brook</strong>-<strong>Millstone</strong><strong>Watershed</strong> violates <strong>the</strong> state standard for bacteria. <strong>The</strong> high levels <strong>of</strong> bacteria in our waterare clear indicators <strong>of</strong> <strong>the</strong> significant impact non-point source pollution – or polluted run<strong>of</strong>f– has on our region. When it rains, polluted run<strong>of</strong>f – <strong>of</strong>ten a combination <strong>of</strong> “people”pollution from failing septic systems and leaking sewer pipes, and animal waste (fromlivestock, geese and pets) – washes <strong>of</strong>f <strong>the</strong> land and into our lakes, rivers and streams.High levels <strong>of</strong> bacteria typically spike for three days after big rainstorms, but leaking septicand sewer systems can cause ongoing problems. <strong>Watershed</strong> Association testing hasidentified two hotspot regions – <strong>the</strong> Heathcote <strong>Brook</strong> in South Brunswick and Duck PondRun in West Windsor. <strong>The</strong>re are two distinct testing sites on <strong>the</strong> Heathcote <strong>Brook</strong> thatpinpoint specific problems with leaking sewer pipes and failed septic systems.You’ll note that six StreamWatch testing sites show that areas meet state standards, whileNJDEP data show <strong>the</strong>y do not. <strong>The</strong>se contradictions exist because while both NJDEPand <strong>the</strong> <strong>Watershed</strong> Association test bacteria, <strong>the</strong> frequency and testing methods differ.In addition, one StreamWatch site on <strong>the</strong> <strong>Stony</strong> <strong>Brook</strong> in Hopewell Township violatesstandards for bacteria. <strong>The</strong>re is no NJDEP data available in that subwatershed region.<strong>State</strong> <strong>of</strong> <strong>the</strong> <strong>Watershed</strong> <strong>Report</strong> 20109~
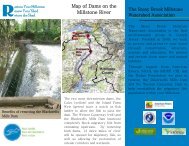
Water with high TSSappears cloudy (left).After a rainstorm, TSSclouds Pike Run inMontgomery Township(right).Water Quality -Total Suspended SolidsRoyce <strong>Brook</strong>MANVILLEMILLSTONEBOROHILLSBOROUGHFRANKLINEASTAMWELLRockMONTGOMERY<strong>Brook</strong>Cruser <strong>Brook</strong>Back <strong>Brook</strong>RunPike<strong>Millstone</strong>andDelawareRaritanRiverCanalTen Mile RunSix Mile RunNORTHBRUNSWICKNEWJERSEYWESTAMWELLHOPEWELLBOROBeden<strong>Brook</strong>ROCKYHILLPRINCETONHeathcote <strong>Brook</strong>SOUTH BRUNSWICKHOPEWELL<strong>Brook</strong><strong>Stony</strong>Honey<strong>Brook</strong>PRINCETONBOROCarnegieLakeDevil’s<strong>Brook</strong>PLAINSBOROShallow<strong>Brook</strong>PENNINGTONLAWRENCE<strong>Stony</strong> <strong>Brook</strong>Cranbury<strong>Brook</strong>Grovers MillPondMONROEDuck PondCRANBURYBig BearRun<strong>Brook</strong>WESTWINDSORHIGHTSTOWN<strong>Millstone</strong>RiverBear <strong>Brook</strong>MANALAPANNJDEP 2008 Draft IntegratedList results by subwatershedMeetsViolatesNJDEP Integrated List results based on datacollected between January 2002 and December 2006.EASTWINDSORROBBINSVILLERocky<strong>Brook</strong>ROOSEVELTMILLSTONENot SampledData Sources: NJ Department <strong>of</strong> Environmental Protection – Draft NJ Integrated Water Quality Monitoring and Assessment<strong>Report</strong> 2008, Stream Drainage Areas [HUC 14] 1999, Streams 2002, Lakes 2002, and <strong>Watershed</strong> Management Area 2000; NJDepartment <strong>of</strong> Transportation – Roads 2007; and SBMWA – StreamWatch data. With <strong>the</strong> exception <strong>of</strong> SBMWA, this secondarymap product has not been verified or authorized by <strong>the</strong> source agencies. Map created by <strong>the</strong> GIS Center <strong>of</strong> <strong>the</strong> <strong>Stony</strong> <strong>Brook</strong>-<strong>Millstone</strong> <strong>Watershed</strong> Association 10/2009. Project: 2009<strong>State</strong><strong>of</strong><strong>the</strong><strong>Watershed</strong>-TSS.mxd~10
<strong>State</strong> Water QualityStandardTotal Suspended SolidsMeetsTSS levels at or below40 mg/LViolatesTSS levels above 40 mg/L.Total Suspended SolidsWhat you can do...at home: downspouts toward it instead <strong>of</strong>pavement to help stormwater soakinto <strong>the</strong> ground on your propertywhere it lands, ra<strong>the</strong>r than runningacross property to streams picking upsediment en route. reduce run<strong>of</strong>f from your property andstabilize soils. in your backyard and plant shrubsand tall grasses along streams to filtersediments out <strong>of</strong> rainfall run<strong>of</strong>f.What is it?Total Suspended Solids (TSS) is a direct measurement <strong>of</strong> <strong>the</strong> particles suspendedin water and removable by lab filtering techniques. Suspended solids consist <strong>of</strong>inorganic elements (silts, clays, sand and rock fragments) and organic elements (algae,zooplankton and bacteria) that are carried along by water as <strong>the</strong>y run <strong>of</strong>f <strong>the</strong> land.Why is it important?Water with high TSS levels, or high sediment loads, is harmful to aquatic life. High levels<strong>of</strong> TSS make water cloudy and block sunlight needed for plant life. When TSS settles itcan smo<strong>the</strong>r eggs and aquatic insects. More TSS also raises <strong>the</strong> cost <strong>of</strong> cleaning waterto make it drinkable.How does <strong>the</strong> watershed measure up?As you can see on <strong>the</strong> map to <strong>the</strong> left, <strong>the</strong> majority <strong>of</strong> <strong>the</strong> areas sampled by <strong>the</strong> NJDEPmeet state standards. <strong>The</strong> <strong>Watershed</strong> Association does not sample TSS. Erosion is <strong>the</strong>leading cause <strong>of</strong> high TSS levels. Conclusion on page 38 to learn how.)Local Advocacy: corridor and forest protectionordinances and encourage your townto improve water quality by updatingstormwater mitigation plans toaddress existing run<strong>of</strong>f problems.<strong>State</strong> <strong>of</strong> <strong>the</strong> <strong>Watershed</strong> <strong>Report</strong> 201011~
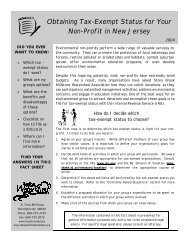
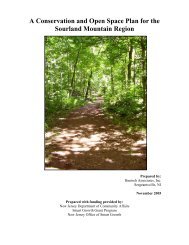
In our lakes, rivers andstreams, nutrients act asfertilizers and canstimulate excessive algaland plant growth.Water Quality -Nitrate DistributionRoyce <strong>Brook</strong>MANVILLEMILLSTONEBOROHILLSBOROUGHFRANKLINEASTAMWELLRockMONTGOMERY<strong>Brook</strong>Cruser <strong>Brook</strong>Back <strong>Brook</strong>RunPike<strong>Millstone</strong>andDelawareRaritanRiverCanalTen Mile RunSix Mile RunNORTHBRUNSWICKNEWJERSEYWESTAMWELLHOPEWELLBOROBeden<strong>Brook</strong>ROCKYHILLPRINCETONHeathcote <strong>Brook</strong>SOUTH BRUNSWICKHOPEWELL<strong>Brook</strong><strong>Stony</strong>Honey<strong>Brook</strong>PRINCETONBOROCarnegieLakeDevil’s<strong>Brook</strong>PLAINSBOROShallow<strong>Brook</strong>StreamWatch SitesMeetsViolatesPENNINGTONNJDEP 2008 Draft IntegratedList results by subwatershedMeetsViolatesNot SampledLAWRENCE<strong>Stony</strong> <strong>Brook</strong>Duck PondRunWESTWINDSORCranburyGrovers MillPondStreamWatch data was collected between January 2008and September 2009.NJDEP Integrated List results based on datacollected between January 2002 and December 2006.<strong>Brook</strong>Big Bear<strong>Brook</strong>Bear <strong>Brook</strong>CRANBURYHIGHTSTOWNEASTWINDSORROBBINSVILLE<strong>Millstone</strong>RockyRiver<strong>Brook</strong>ROOSEVELTMONROEMILLSTONEMANALAPANData Sources: NJ Department <strong>of</strong> Environmental Protection – Draft NJ Integrated Water Quality Monitoring and Assessment<strong>Report</strong> 2008, Stream Drainage Areas [HUC 14] 1999, Streams 2002, Lakes 2002, and <strong>Watershed</strong> Management Area 2000; NJDepartment <strong>of</strong> Transportation – Roads 2007; and SBMWA – StreamWatch data. With <strong>the</strong> exception <strong>of</strong> SBMWA, this secondarymap product has not been verified or authorized by <strong>the</strong> source agencies. Map created by <strong>the</strong> GIS Center <strong>of</strong> <strong>the</strong> <strong>Stony</strong> <strong>Brook</strong>-<strong>Millstone</strong> <strong>Watershed</strong> Association 10/2009. Project: 2009<strong>State</strong><strong>of</strong><strong>the</strong><strong>Watershed</strong>-Nitrates.mxd~12
<strong>State</strong> Water QualityStandardSafe to DrinkFor Aquatic Life to Thrive*Nitrate At or below 10 mg / L Less than 1 mg / L* Research shows that aquatic life needs less than 1 mg / L <strong>of</strong> nitrates to thrive. However, this is notrecognized as an <strong>of</strong>ficial state standard.NutrientsWhat you can do...at home: much and what type <strong>of</strong> fertilizer yourlawn or plants really need. necessary at <strong>the</strong> appropriate rate andtime to help nutrients stay in your yard. with no phosphates. it properly. pipes are properly maintained. backyard streams to filter nutrientsfrom rainfall run<strong>of</strong>f.What is it?Nutrients are needed by all living things to grow and thrive. In this section we aretaking a look at two types <strong>of</strong> nutrients: nitrates and phosphates.Nitrates help build proteins, which are <strong>the</strong> building blocks for growth and colorfor plants. Phosphorus promotes flowering, root development, and helpsprevent stress and disease. <strong>The</strong>se nutrients occur naturally in air, soil, rocks,and organic materials. Sources <strong>of</strong> excess nitrates in streams include fertilizers,animal and pet waste, leaking sewer pipes and malfunctioning septic systems.<strong>The</strong> primary source <strong>of</strong> excess phosphates in streams is from fertilizers, cleaningproducts and industrial uses.Why is it important?Nutrients help support aquatic life, but become detrimental in large quantitieswhen <strong>the</strong>y act as fertilizers to stimulate excessive algal and plant growth instreams. Algal blooms block sunlight and reduce dissolved oxygen in <strong>the</strong> waterwhen <strong>the</strong>y die and decompose. <strong>The</strong> accumulation <strong>of</strong> dead and decomposingplant material can smo<strong>the</strong>r important aquatic insect and fish habitats. Inaddition, nitrates can be toxic to our health when people consume excessamounts through water, plants or animals. Conclusion on page 38 to learn how.)Local Advocacy: corridor, fertilizer, septic and pet wasteordinances.<strong>State</strong> <strong>of</strong> <strong>the</strong> <strong>Watershed</strong> <strong>Report</strong> 201013~
Water Quality -Orthophosphate DistributionRoyce <strong>Brook</strong>MANVILLEMILLSTONEBOROHILLSBOROUGHFRANKLINEASTAMWELLRockMONTGOMERY<strong>Brook</strong>Cruser <strong>Brook</strong>Back <strong>Brook</strong>RunPike<strong>Millstone</strong>andDelawareRaritanRiverCanalTen Mile RunSix Mile RunNORTHBRUNSWICKNEWJERSEYWESTAMWELLHOPEWELLBOROBeden<strong>Brook</strong>ROCKYHILLPRINCETONHeathcote <strong>Brook</strong>SOUTH BRUNSWICKHOPEWELL<strong>Brook</strong><strong>Stony</strong>Honey<strong>Brook</strong>PRINCETONBOROCarnegieLakeDevil’s<strong>Brook</strong>PLAINSBOROShallow<strong>Brook</strong>StreamWatch SitesMeetsViolatesPENNINGTONNJDEP 2008 Draft IntegratedList results by subwatershedMeetsViolatesNot SampledLAWRENCE<strong>Stony</strong> <strong>Brook</strong>Duck PondRunWESTWINDSORCranburyGrovers MillPondStreamWatch data was collected between January 2008and September 2009.Big BearNJDEP Integrated List results based on datacollected between January 2002 and December 2006.<strong>Brook</strong><strong>Brook</strong>Bear <strong>Brook</strong>CRANBURYHIGHTSTOWNEASTWINDSORROBBINSVILLE<strong>Millstone</strong>RockyRiver<strong>Brook</strong>ROOSEVELTMONROEMILLSTONEMANALAPANData Sources: NJ Department <strong>of</strong> Environmental Protection – Draft NJ Integrated Water Quality Monitoring and Assessment<strong>Report</strong> 2008, Stream Drainage Areas [HUC 14] 1999, Streams 2002, Lakes 2002, and <strong>Watershed</strong> Management Area 2000; NJDepartment <strong>of</strong> Transportation – Roads 2007; and SBMWA – StreamWatch data. With <strong>the</strong> exception <strong>of</strong> SBMWA, this secondarymap product has not been verified or authorized by <strong>the</strong> source agencies. Map created by <strong>the</strong> GIS Center <strong>of</strong> <strong>the</strong> <strong>Stony</strong> <strong>Brook</strong>-<strong>Millstone</strong> <strong>Watershed</strong> Association 10/2009. Project: 2009<strong>State</strong><strong>of</strong><strong>the</strong><strong>Watershed</strong>-Orthophosphate.mxd~14
<strong>State</strong> Water QualityStandardFreshwater StreamsLakesTotal Phosphorus * 0.1 mg / L 0.05 mg / L* Because <strong>the</strong>re is no state standard directly for orthophosphate, <strong>the</strong> <strong>Watershed</strong> Association has set an actionlimit for orthophosphate <strong>of</strong> 0.1 mg / L for freshwater streams and 0.05 mg / L for lakes. Streams or lakes withorthophosphates above those levels violate our action limit.Nutrients (continued)NitrateHow does <strong>the</strong> watershed measure up?<strong>The</strong> map on page 12 illustrates that nitrate levels in <strong>the</strong> <strong>Stony</strong> <strong>Brook</strong>-<strong>Millstone</strong><strong>Watershed</strong> meet state standards. According to our StreamWatch data only onesite in our watershed – <strong>the</strong> <strong>Millstone</strong> River in West Windsor – has shown nitratelevels above <strong>the</strong> acceptable limit. <strong>The</strong> cause is undetermined at this time andwe continue to monitor this site.<strong>The</strong>re are also 24 sites (all <strong>of</strong> which meet state standards) tested byStreamWatch where <strong>the</strong>re is no NJDEP data available. This additionalStreamWatch data paints a clearer picture <strong>of</strong> what’s happening throughoutour watershed.OrthophosphateHow does <strong>the</strong> watershed measure up?StreamWatch data on <strong>the</strong> map at left shows that orthophosphates are a seriousproblem in our watershed. Of <strong>the</strong> 31 StreamWatch sites where orthophosphatesare tested, only two meet StreamWatch standards – Devil’s <strong>Brook</strong> and Shallow<strong>Brook</strong> in Plainsboro. <strong>The</strong> high levels <strong>of</strong> orthophosphate in our water are a clearindicator <strong>of</strong> <strong>the</strong> impact over-fertilization has on our region. Most <strong>of</strong> <strong>the</strong> soilsin our watershed already have adequate to high levels <strong>of</strong> phosphate. Addingfertilizer when not necessary to lawns, gardens, fields, etc. leads to excesslevels <strong>of</strong> phosphate in our streams when soils wash into our waterways andcontribute to <strong>the</strong> decline <strong>of</strong> aquatic life. Phosphates can also come fromcleaning products and industrial uses.You’ll note that one <strong>of</strong> <strong>the</strong> StreamWatch testing sites on Beden <strong>Brook</strong> inHopewell Township violates StreamWatch standards, while NJDEP data show<strong>the</strong> area meets state standards. This contradiction probably exists becauseStreamWatch and NJDEP data are not directly comparable based on <strong>the</strong>frequency <strong>of</strong> sample collection and testing methods used. NJDEP collects atleast four orthophosphate samples a year, while <strong>the</strong> <strong>Watershed</strong> Associationtests for orthophosphates 24 times a year.In addition, <strong>the</strong>re are 25 sites (two meet, 23 violate) that StreamWatch testedwhere <strong>the</strong>re is no NJDEP data available. This additional StreamWatch datapaints a clearer picture <strong>of</strong> what’s happening throughout our watershed.<strong>State</strong> <strong>of</strong> <strong>the</strong> <strong>Watershed</strong> <strong>Report</strong> 201015~
<strong>Watershed</strong> Association staff (left)sort out macroinvertebrates, suchas <strong>the</strong> stonefly nymph (right).Water Quality -Aquatic Life DistributionRoyce <strong>Brook</strong>MANVILLEMILLSTONEBOROHILLSBOROUGHFRANKLINEASTAMWELLRockMONTGOMERY<strong>Brook</strong>Cruser <strong>Brook</strong>Back <strong>Brook</strong>RunPike<strong>Millstone</strong>andDelawareRaritanRiverCanalTen Mile RunSix Mile RunNORTHBRUNSWICKNEWJERSEYWESTAMWELLHOPEWELLBOROBeden<strong>Brook</strong>ROCKYHILLPRINCETONHeathcote <strong>Brook</strong>SOUTH BRUNSWICKHOPEWELL<strong>Brook</strong><strong>Stony</strong>Honey<strong>Brook</strong>PRINCETONBOROCarnegieLakeDevil’s<strong>Brook</strong>PLAINSBOROShallow<strong>Brook</strong>StreamWatch SitesNon-ImpairedImpairedPENNINGTONNJDEP 2008 Draft IntegratedList results by subwatershedNon-ImpairedImpairedNot SampledLAWRENCE<strong>Stony</strong> <strong>Brook</strong>Duck PondRunWESTWINDSORCranburyGrovers MillPondStreamWatch data results based on biological monitoringdata collected between March 2008 and July 2009.NJDEP Integrated List results based on biologicalmonitoring data collected between Jan. 2002 andDec. 2006 or, if biological data is not available, on testsfor pH, dissolved oxygen, temperature, total phosphorus,and total suspended solids.<strong>Brook</strong>Big Bear<strong>Brook</strong>Bear <strong>Brook</strong>CRANBURYHIGHTSTOWNEASTWINDSORROBBINSVILLE<strong>Millstone</strong>RockyRiver<strong>Brook</strong>ROOSEVELTMONROEMILLSTONEMANALAPANData Sources: NJ Department <strong>of</strong> Environmental Protection – Draft NJ Integrated Water Quality Monitoring and Assessment<strong>Report</strong> 2008, Stream Drainage Areas [HUC 14] 1999, Streams 2002, Lakes 2002, and <strong>Watershed</strong> Management Area 2000; NJDepartment <strong>of</strong> Transportation – Roads 2007; and SMBWA – StreamWatch data. With <strong>the</strong> exception <strong>of</strong> SBMWA, this secondarymap product has not been verified or authorized by <strong>the</strong> source agencies. Map created by <strong>the</strong> GIS Center <strong>of</strong> <strong>the</strong> <strong>Stony</strong> <strong>Brook</strong>-<strong>Millstone</strong> <strong>Watershed</strong> Association 10/2009. Project: 2009 <strong>State</strong><strong>of</strong><strong>the</strong><strong>Watershed</strong>-AquaticLife.mxd~16
New Jersey Impairment ScoreCategory*Aquatic LifeBiological AssessmentScore**Assessment Result shownon MapNon-Impaired 24-30 Non-ImpairedModerately Impaired 9-21 ImpairedSeverely Impaired 0-6 Impaired* <strong>The</strong> NJDEP classifies both severely and moderately impaired streams as “impaired.” Through our StreamWatchtesting and employment <strong>of</strong> <strong>the</strong> New Jersey Impairment Score, we have determined that <strong>of</strong> <strong>the</strong> 12 StreamWatchsites monitored for aquatic life, two sites are severely impaired (17 percent), nine sites are moderatelyimpaired (75 percent) and one site is non-impaired (8 percent).** For more information about <strong>the</strong> assessment score, view <strong>the</strong> Round 3 Raritan Water Region Benthic MacroinvertebrateData report, available for download on <strong>the</strong> NJDEP website: http://www.nj.gov/dep/wms//bfbm/downloads.html (see pages 8, 9 and 28).What you can do...at home: in your backyard and plant treesalong backyard streams to shade <strong>the</strong>stream, keeping oxygen levels higherfor <strong>the</strong> bugs that live <strong>the</strong>re. contribution <strong>of</strong> “people” pollution toour streams. (See Conclusion on page38 to learn how.)Local Advocacy: corridor, forest protection, fertilizer,pesticide and pet waste ordinances.<strong>The</strong>se ordinances provide shade forstreams and keep pollutants harmfulto aquatic life out <strong>of</strong> our waterways.What is it?Macroinvertebrates are aquatic insects, crustaceans and clams that can be seen with<strong>the</strong> naked eye and inhabit stream bottoms.Why is it important?Macroinvertebrates are an important food source for fish and serve as <strong>the</strong> base <strong>of</strong> <strong>the</strong>food chain. Like <strong>the</strong> canary in <strong>the</strong> coalmine, unhealthy macroinvertebrates are <strong>the</strong> earlywarning system for overall environmental health. <strong>The</strong>y are also important indicators <strong>of</strong>water quality. Different species <strong>of</strong> macroinvertebrates have different tolerance levels topollution – some need very clean water to survive, while o<strong>the</strong>rs are highly tolerant <strong>of</strong>pollution. <strong>The</strong> types <strong>of</strong> macroinvertebrates living in a stream indicate how healthy orpolluted it may be. For example, mayflies need clean well-oxygenated water to survive,while leeches and worms can live almost anywhere. Finding a variety <strong>of</strong> clean waterorganisms is indicative <strong>of</strong> a healthy stream.How does <strong>the</strong> watershed measure up?As you can see on <strong>the</strong> map at left, <strong>the</strong> majority <strong>of</strong> <strong>the</strong> watershed is impaired based onmacroinvertebrate populations. <strong>The</strong> NJDEP estimates that stormwater run<strong>of</strong>f accountsfor 60 percent <strong>of</strong> <strong>the</strong> pollution in surface waters (NJDEP, 2008). As mentioned in <strong>the</strong>previous sections, stormwater carries with it “people” pollution—waste from leakingseptic and sewer systems, excess fertilizers and pesticides, pet and animal waste—toour lakes, rivers and streams. To combat <strong>the</strong> effect <strong>of</strong> “people” pollution on aquatic life,it is important for all <strong>of</strong> us—individuals, businesses, governments, etc.—to change ourbehavior to help protect and improve <strong>the</strong> health <strong>of</strong> our waterways.You’ll note that two <strong>of</strong> <strong>the</strong> StreamWatch testing sites on <strong>the</strong> <strong>Stony</strong> <strong>Brook</strong> in HopewellTownship are impaired, while <strong>the</strong> NJDEP data show <strong>the</strong> area is non-impaired. Inaddition, one StreamWatch site on <strong>the</strong> Beden <strong>Brook</strong> in Hopewell Township is nonimpaired,while NJDEP data show <strong>the</strong> area is impaired. <strong>The</strong>se contradictions existbecause StreamWatch and NJDEP data are not directly comparable based on <strong>the</strong>frequency <strong>of</strong> sample collection and testing methods used. NJDEP’s results are basedon samples taken once over a five-year period while <strong>the</strong> <strong>Watershed</strong> Association collectsmacroinvertebrate samples three times a year, every year.<strong>State</strong> <strong>of</strong> <strong>the</strong> <strong>Watershed</strong> <strong>Report</strong> 201017~
In a joint effort with NJDEP Fishand Wildlife, <strong>Watershed</strong> Associationstaff and volunteers examine <strong>the</strong>species <strong>of</strong> fish living in Pike Runin Montgomery Township.Water Quality -Dissolved OxygenRoyce <strong>Brook</strong>MANVILLEMILLSTONEBOROHILLSBOROUGHFRANKLINEASTAMWELLRockMONTGOMERY<strong>Brook</strong>Cruser <strong>Brook</strong>Back <strong>Brook</strong>RunPike<strong>Millstone</strong>andDelawareRaritanRiverCanalTen Mile RunSix Mile RunNORTHBRUNSWICKNEWJERSEYWESTAMWELLHOPEWELLBOROBeden<strong>Brook</strong>ROCKYHILLPRINCETONHeathcote <strong>Brook</strong>SOUTH BRUNSWICKHOPEWELL<strong>Brook</strong><strong>Stony</strong>Honey<strong>Brook</strong>PRINCETONBOROCarnegieLakeDevil’s<strong>Brook</strong>PLAINSBOROShallow<strong>Brook</strong>StreamWatch SitesMeetsViolatesPENNINGTONNJDEP 2008 Draft IntegratedList results by subwatershedMeetsViolatesNot SampledLAWRENCE<strong>Stony</strong> <strong>Brook</strong>Duck PondRunWESTWINDSORCranburyGrovers MillPondStreamWatch data was collected between January 2008and September 2009.Big BearNJDEP Integrated List results based on datacollected between January 2002 and December 2006.<strong>Brook</strong><strong>Brook</strong>Bear <strong>Brook</strong>CRANBURYHIGHTSTOWNEASTWINDSORROBBINSVILLE<strong>Millstone</strong>RockyRiver<strong>Brook</strong>ROOSEVELTMONROEMILLSTONEMANALAPANData Sources: NJ Department <strong>of</strong> Environmental Protection – Draft NJ Integrated Water Quality Monitoring and Assessment<strong>Report</strong> 2008, Stream Drainage Areas [HUC 14] 1999, Streams 2002, Lakes 2002, and <strong>Watershed</strong> Management Area 2000; NJDepartment <strong>of</strong> Transportation – Roads 2007; and SBMWA – StreamWatch data. With <strong>the</strong> exception <strong>of</strong> SBMWA, this secondarymap product has not been verified or authorized by <strong>the</strong> source agencies. Map created by <strong>the</strong> GIS Center <strong>of</strong> <strong>the</strong> <strong>Stony</strong> <strong>Brook</strong>-<strong>Millstone</strong> <strong>Watershed</strong> Association 10/2009. Project: 2009<strong>State</strong><strong>of</strong><strong>the</strong><strong>Watershed</strong>-DO.mxd~18
<strong>State</strong> Water QualityStandardMeetsViolatesDissolved Oxygen Levels At or Greater than 4.0 ppm Below 4.0 ppmDissolved OxygenWhat you can do...at home: streams to provide shade,keeping <strong>the</strong> water cool andoxygen levels higher for <strong>the</strong> bugsand fish that live <strong>the</strong>re. Conclusion on page 38 to learnhow.)Local Advocacy: stream corridor and forestprotection ordinances to helpprovide shade to streamsthroughout your town. (See page24 to learn about your town’sstream corridor ordinance.)What is it?Dissolved oxygen is produced by plants during photosyn<strong>the</strong>sis or by aeration fromcurrents flowing over rocks and is consumed by fish and o<strong>the</strong>r animals.Why is it important?Oxygen levels are influenced by <strong>the</strong> amount <strong>of</strong> photosyn<strong>the</strong>sis taking place in <strong>the</strong> water,water temperature, salt content and aeration from currents. Fish, macroinvertebrates ando<strong>the</strong>r wildlife need adequate levels <strong>of</strong> dissolved oxygen to survive.How does <strong>the</strong> watershed measure up?As you can see from <strong>the</strong> map at left <strong>the</strong> majority <strong>of</strong> areas tested in our watershed meetstate standards for dissolved oxygen.You’ll note that one StreamWatch testing site on <strong>the</strong> <strong>Stony</strong> <strong>Brook</strong> and one site on <strong>the</strong><strong>Millstone</strong> River, both in Princeton Township, violate state standards, while <strong>the</strong> NJDEP datashow <strong>the</strong> area meets state standards. In addition, one StreamWatch site on Ten Mile Runin Franklin Township meets state standards while NJDEP data show <strong>the</strong> area violates statestandards.Both StreamWatch and NJDEP test to <strong>the</strong> same standard level, but <strong>the</strong>se contradictionsexist because <strong>of</strong> <strong>the</strong> frequency <strong>of</strong> sample collection and testing methods used. NJDEPcollects at least four dissolved oxygen samples a year, while <strong>the</strong> <strong>Watershed</strong> Associationtests dissolved oxygen 24 times a year.<strong>The</strong>re are 15 additional StreamWatch sites (13 meet, two violate) that StreamWatch testedwhere <strong>the</strong>re is no NJDEP data available. This additional StreamWatch data paints a clearerpicture <strong>of</strong> what’s happening throughout our watershed. For those StreamWatch sites thatdo not meet state standards, <strong>the</strong> <strong>Watershed</strong> Association is continuing to monitor to see if<strong>the</strong> problem is ongoing and to look for trends.<strong>State</strong> <strong>of</strong> <strong>the</strong> <strong>Watershed</strong> <strong>Report</strong> 201019~
<strong>The</strong> <strong>Stony</strong> <strong>Brook</strong>-<strong>Millstone</strong> <strong>Watershed</strong>throughout <strong>the</strong> seasons.~20
Environmental PolicyScientifically testing our water to determine its health and quality is just part <strong>of</strong> <strong>the</strong>battle to protect our water resources. To ensure that our water stays clean andhealthy, we need to educate <strong>the</strong> public and enact strong environmental policies at<strong>the</strong> state and local level to protect our waterways and critical lands from pollution,encroachment and development.Throughout our 60-year history, <strong>the</strong> <strong>Watershed</strong> Association has been on <strong>the</strong>forefront <strong>of</strong> environmental protection for our region. In addition to working closelywith municipalities, we have a long tradition <strong>of</strong> advocating for stronger statewidepolicies and legislation. We halted sewage discharges into <strong>the</strong> Delaware & RaritanCanal, stopped Interstate 95 from cutting through <strong>the</strong> Hopewell Valley, helped lead<strong>the</strong> way for enactment <strong>of</strong> <strong>the</strong> NJ Freshwater Wetlands Protection Act, and evenearned special state “Category One” protection for a 10-mile stretch <strong>of</strong> <strong>the</strong> <strong>Stony</strong><strong>Brook</strong> in Hopewell, Lawrence and Princeton.<strong>The</strong> following pages outline four ways <strong>the</strong> <strong>Watershed</strong> Association is working withmunicipalities to ensure that <strong>the</strong>re are adequate protections in place to keep ourwaterways clean and healthy on <strong>the</strong> local level: Project for Municipal Excellence,Stream Corridor Protection, Septic System Maintenance and Forest Protection.<strong>The</strong> environmental policies that we examine in <strong>the</strong> following pages are among<strong>the</strong> most important measures <strong>of</strong> local protection that <strong>the</strong> <strong>Watershed</strong> Associationbelieves municipalities should adopt in order to protect existing water qualityand healthy habitats. By adopting <strong>the</strong> type <strong>of</strong> ordinances discussed in <strong>the</strong>following pages, municipalities can help protect <strong>the</strong> natural resources we havetoday and ensure that <strong>the</strong>y will be around for <strong>the</strong> next generation. As you’ll seefrom <strong>the</strong> maps and data that follow, some towns have stronger protections andenvironmental policies than o<strong>the</strong>rs.<strong>State</strong> <strong>of</strong> <strong>the</strong> <strong>Watershed</strong> <strong>Report</strong> 201021~
Project for MunicipalExcellence MapMANVILLEHILLSBOROUGHMILLSTONEBOROFRANKLINEASTAMWELLMONTGOMERYNORTHBRUNSWICKNEWJERSEYROCKYHILLWESTAMWELLHOPEWELLBOROSOUTH BRUNSWICKHOPEWELLPRINCETONPRINCETONBOROPLAINSBOROPENNINGTONLAWRENCEWESTWINDSORCRANBURYMONROEHIGHTSTOWNMANALAPANEASTWINDSORROOSEVELTROBBINSVILLEMILLSTONE<strong>Report</strong> Finish- Municipality has formally partnered with <strong>the</strong> <strong>Watershed</strong> Association, a Next Steps report has been completed,and <strong>of</strong>ficials are working to enact stronger ordinances that protect clean water and healthy habitatsEnrolled in Program/<strong>Report</strong> in Progress- Municipality has formally partnered with <strong>the</strong> <strong>Watershed</strong> Association, a Next Steps report is currently being draftedNot Enrolled- Municipality has yet to formally partner with <strong>the</strong> <strong>Watershed</strong> AssociationData Source: NJ Department <strong>of</strong> Environmental Protection – Municipal Boundary; NJ Department <strong>of</strong> Transportation – MajorRoad; SBMWA Municipal Excellence 08/09. With <strong>the</strong> exception <strong>of</strong> SBMWA, this secondary map product has not been verifiedor authorized by <strong>the</strong> source agencies. Map created by <strong>the</strong> GIS Center <strong>of</strong> <strong>the</strong> <strong>Stony</strong> <strong>Brook</strong>-<strong>Millstone</strong> <strong>Watershed</strong> Association10/2009. Project: 2009<strong>State</strong><strong>of</strong><strong>the</strong><strong>Watershed</strong>-MuniExc.mxd~22
Project for MunicipalExcellenceWhat you can do...at home: website, your local library or town hall,and read <strong>the</strong> Next Steps report foryour municipality. to assist with policy initiatives we arecurrently working on in your area.Local Advocacy: municipality is protecting naturalresources. Commission, Planning Board andTown Council or Committee meetingsto encourage <strong>the</strong>m to adopt strongerordinances that protect clean waterand healthy habitats.What is it?<strong>The</strong> Project for Municipal Excellence is a program through which <strong>the</strong> <strong>Watershed</strong> Associationestablishes partnerships with local governments to evaluate local planning and improveordinances to protect clean water and healthy habitats. <strong>The</strong> <strong>Watershed</strong> Association founded<strong>the</strong> Project for Municipal Excellence in 2002 to provide a comprehensive approach to planningthat protects natural resources and helps municipalities meet future needs. We produce aNext Steps report with recommendations for each municipality in <strong>the</strong> program and <strong>Watershed</strong>Association staff <strong>the</strong>n assist local <strong>of</strong>ficials with implementing recommendations.In 2004, <strong>the</strong> <strong>Watershed</strong> Association received <strong>the</strong> New Jersey Planning Officials’ Achievementin Planning Award for <strong>the</strong> Project for Municipal Excellence. At least two additional New Jerseyorganizations have adopted and successfully implemented this program. Several groupsacross <strong>the</strong> country are using <strong>the</strong> techniques <strong>of</strong> <strong>the</strong> program to change <strong>the</strong> policies <strong>of</strong> <strong>the</strong>irlocal governments and watersheds.Why is it important?In New Jersey, town councils, committees and planning boards make local land use decisions.Planning boards make decisions based on <strong>the</strong> requirements in local land use plans andordinances. It is imperative that local land use plans and zoning ordinances include protectionfor our shared natural resources; o<strong>the</strong>rwise <strong>the</strong> quality <strong>of</strong> our water and habitats will continueto decline.How does <strong>the</strong> watershed measure up?<strong>The</strong> map on <strong>the</strong> opposite page shows that 16 <strong>of</strong> <strong>the</strong> 26 municipalities in <strong>the</strong> <strong>Stony</strong> <strong>Brook</strong>-<strong>Millstone</strong> <strong>Watershed</strong> have <strong>of</strong>ficially partnered with <strong>the</strong> <strong>Watershed</strong> Association since this projectbegan. We look forward to partnering with additional municipalities, particularly Plainsboroand West Windsor townships because <strong>of</strong> <strong>the</strong> significant amount <strong>of</strong> land <strong>the</strong>y occupy in ourwatershed, to improve local planning and policies that protect clean water and <strong>the</strong> naturalenvironment. We will also continue to assist municipalities already enrolled in <strong>the</strong> program byhelping <strong>the</strong>m streng<strong>the</strong>n <strong>the</strong>ir ordinances. <strong>The</strong> next three maps in this report demonstratesome <strong>of</strong> <strong>the</strong> most important environmental protection ordinances that municipalities canadopt.<strong>State</strong> <strong>of</strong> <strong>the</strong> <strong>Watershed</strong> <strong>Report</strong> 201023~
Ten Mile Run inFranklin Township.Stream Corridor ProtectionOrdinance MapMANVILLEHILLSBOROUGHMILLSTONEBOROFRANKLINEASTAMWELLMONTGOMERYNORTHBRUNSWICKNEWJERSEYROCKYHILLWESTAMWELLHOPEWELLBOROSOUTH BRUNSWICKHOPEWELLPRINCETONPRINCETONBOROPLAINSBOROPENNINGTONLAWRENCEWESTWINDSORCRANBURYMONROEMANALAPANExcellent- Protections for 100+ foot buffers measured from all streambanksand floodplains that apply to all developments and construction- Enforcement penalties for violationsHIGHTSTOWNEASTWINDSORGood- Protections for 75-99 foot buffers measured from all streambanks and floodplains that applyto all developments and construction / OR - Protections for 150 foot buffers measured fromall streambanks and floodplains, but are only applicable to some developmentROBBINSVILLEROOSEVELTMILLSTONEPoor- Protections for less than 100 foot buffers measured from allstreambanks and floodplains, and are only applicable to somedevelopment and constructionBad- No stream corridor protection ordinance has been adopted / OR- General language exists, but it is too vague to be enforceableN/AData Source: NJ Department <strong>of</strong> Environmental Protection – Municipal Boundary; NJ Department <strong>of</strong> Transportation – MajorRoad; SBMWA Stream Corridor Ordinance 08/09. With <strong>the</strong> exception <strong>of</strong> SBMWA, this secondary map product has not beenverified or authorized by <strong>the</strong> source agencies. Map created by <strong>the</strong> GIS Center <strong>of</strong> <strong>the</strong> <strong>Stony</strong> <strong>Brook</strong>-<strong>Millstone</strong> <strong>Watershed</strong> Association10/2009. Project: 2009<strong>State</strong><strong>of</strong><strong>the</strong><strong>Watershed</strong>-StreamCorridor.mxd~24
Stream Corridor ProtectionWhat you can do...at home: apply only <strong>the</strong> amount and type <strong>of</strong>fertilizers that your lawn, garden, andflowers need. before <strong>the</strong>y reach your stream.Local Advocacy: or improve your community’s streamcorridor protection ordinance.What is it?A stream corridor includes <strong>the</strong> stream itself and <strong>the</strong> land immediately surrounding it. <strong>The</strong>secorridors <strong>of</strong>ten include wetlands, forests and floodplains, and can have steep slopes.Protecting stream corridors in <strong>the</strong>ir natural condition is <strong>the</strong> best way to ensure that wehave enough clean water for drinking, recreation, farming and o<strong>the</strong>r uses, and habitats forfish and wildlife.Why is it important?More than half <strong>of</strong> New Jersey families rely on water from streams for drinking andhousehold use. In <strong>the</strong> <strong>Stony</strong> <strong>Brook</strong>-<strong>Millstone</strong> <strong>Watershed</strong> all streams, rain and snowmeltdrain to <strong>the</strong> <strong>Millstone</strong> River. <strong>The</strong> <strong>Millstone</strong> River connects to <strong>the</strong> Raritan River in FranklinTownship and Manville Borough, Somerset County; some <strong>of</strong> that water is withdrawn from<strong>the</strong> river at that point, treated and <strong>the</strong>n piped into homes and businesses throughoutcentral New Jersey.Stream corridors help protect our drinking water because <strong>the</strong> grasses, shrubs and treesthat grow in <strong>the</strong>se locations filter pollutants before <strong>the</strong>y reach <strong>the</strong> stream and slow stormrun<strong>of</strong>f. Protecting <strong>the</strong> health and quality <strong>of</strong> our streams is critical to protecting our drinkingwater and human health, because <strong>the</strong>y provide places for families to play, explore, canoeand fish. Wildlife also depends upon thriving stream corridors for food, water and shelter.Healthy stream corridors save money by lessening flood-related damages and associatedcosts because <strong>the</strong>y allow streams to overflow <strong>the</strong>ir banks in a natural way during floods.By keeping development away from stream corridors we can reduce flood damage.How does <strong>the</strong> watershed measure up?While <strong>the</strong>re are state laws that protect some stream corridors, <strong>the</strong>y are not strongenough to ensure <strong>the</strong> health and quality <strong>of</strong> our streams. <strong>The</strong> <strong>Watershed</strong> Association isworking with municipalities to adopt local stream corridor protection ordinances, whichprotect your water by limiting disturbance and development along streams. As you cansee on <strong>the</strong> map at left, five <strong>of</strong> <strong>the</strong> 26 municipalities in our watershed have “excellent”stream corridor ordinances, while o<strong>the</strong>rs should streng<strong>the</strong>n protections for our streams.<strong>State</strong> <strong>of</strong> <strong>the</strong> <strong>Watershed</strong> <strong>Report</strong> 201025~
Septic Ordinance MapMANVILLEHILLSBOROUGHMILLSTONEBOROFRANKLINEASTAMWELLMONTGOMERYNORTHBRUNSWICKNEWJERSEYROCKYHILLWESTAMWELLHOPEWELLBOROSOUTH BRUNSWICKHOPEWELLPRINCETONPRINCETONBOROPLAINSBOROPENNINGTONLAWRENCEWESTWINDSORCRANBURYMONROEHIGHTSTOWNMANALAPANExcellent- Maintenance requirements, specifically timelines for inspecting andpumping out <strong>the</strong> septic tank, and reserve areas in case <strong>of</strong> system failureEASTWINDSORROOSEVELTMILLSTONEGood- R equirements for septic tank pumping and inspection when a home is being sold / OR- R equirements for pumping community septic systems, but not individual systemsROBBINSVILLEPoor- Meet <strong>the</strong> state regulations that pertain to placementand construction <strong>of</strong> a septic systemN/AData Source: NJ Department <strong>of</strong> Environmental Protection – Municipal Boundary; NJ Department <strong>of</strong> Transportation – MajorRoad; SBMWA Septic Ordinance 08/09. With <strong>the</strong> exception <strong>of</strong> SBMWA, this secondary map product has not been verifiedor authorized by <strong>the</strong> source agencies. Map created by <strong>the</strong> GIS Center <strong>of</strong> <strong>the</strong> <strong>Stony</strong> <strong>Brook</strong>-<strong>Millstone</strong> <strong>Watershed</strong> Association10/2009. Project: 2009<strong>State</strong><strong>of</strong><strong>the</strong><strong>Watershed</strong>-Septic.mxd~26
Septic System ManagementWhat you can do...at home: Call your town, and <strong>the</strong>y will be able totell you if you have a septic system. <strong>the</strong> drain, including oil-based paintsand wood stains. household cleaners down <strong>the</strong> drain. be inspected annually and pumpedevery 3-5 years. However, individualsystems vary depending on <strong>the</strong>ir sizeand age, <strong>the</strong> number <strong>of</strong> people <strong>the</strong>yserve and past performance.What is it?Septic systems process wastewater from <strong>the</strong> toilet, shower, washing machine anddishwasher. When placed in proper locations and maintained regularly, septic systemsare an effective and efficient means <strong>of</strong> wastewater management.Why is it important?Neglect or abuse <strong>of</strong> a septic system will cause it to fail and have negative financial,ecological, and property consequences, such as flooded basements. Septic systemcare and management are <strong>the</strong> responsibility <strong>of</strong> homeowners. As people move intosuburbia from cities where waste is managed by sewers, residents are <strong>of</strong>ten unfamiliarwith how <strong>the</strong>ir lifestyle can affect <strong>the</strong> ability <strong>of</strong> <strong>the</strong>ir septic systems to function properly.Many new residents are unaware that <strong>the</strong>y even own a septic system.In most communities, septic system inspections are not required prior to <strong>the</strong> sale <strong>of</strong>a home. Homebuyers <strong>of</strong>ten unknowingly purchase a home with a failing or abusedsystem. Repair or replacement <strong>of</strong> a failing septic system is expensive, but failure to doso can degrade clean water and healthy habitats.How does <strong>the</strong> watershed measure up?As you can see on <strong>the</strong> map at left, only one municipality has an “excellent” septicmanage wastewater exclusively using sewers. Requiring septic system inspectionsand maintenance can be controversial because homeowners will spend money toregularly inspect, pump, fix or replace <strong>the</strong>ir systems. <strong>The</strong>refore, few communitieshave implemented strict requirements. Because leaking and failing septic systems area major threat to clean water, <strong>the</strong> <strong>Watershed</strong> Association supports local ordinancesthat require a septic system inspection before homes or o<strong>the</strong>r buildings are sold.We also support ordinances that require <strong>the</strong> regular care and maintenance <strong>of</strong> septicsystems because it will protect clean water and <strong>the</strong> environment. Such maintenancewill also usually save money in <strong>the</strong> long run. To educate <strong>the</strong> community, we haveorganized several septic system education forums to help residents understand how<strong>the</strong>y can care for <strong>the</strong>ir septic systems and developed a publication designed to helpresidents learn how best to use and maintain <strong>the</strong>ir septic systems. It is available on ourwebsite (www.<strong>the</strong>watershed.org) and is titled: A Residential Guide to Septic SystemManagement & Maintenance.<strong>State</strong> <strong>of</strong> <strong>the</strong> <strong>Watershed</strong> <strong>Report</strong> 201027~
Tree clearing can lead toproblems with flooding (left).A volunteer helps plant a nativeshrub in Montgomery (right).Forest ProtectionOrdinance MapMANVILLEHILLSBOROUGHMILLSTONEBOROFRANKLINEASTAMWELLMONTGOMERYNORTHBRUNSWICKNEWJERSEYROCKYHILLWESTAMWELLHOPEWELLBOROSOUTH BRUNSWICKHOPEWELLPRINCETONPRINCETONBOROPLAINSBOROPENNINGTONLAWRENCEWESTWINDSORCRANBURYMONROEMANALAPANExcellent- Limitations <strong>of</strong> <strong>the</strong> amount <strong>of</strong> trees/forest that can be cut for new development- Limitations for tree cutting on existing development / AND- Limits <strong>the</strong> amount <strong>of</strong> area that can be cut, requires permits, and has penalties for excessive cuttingHIGHTSTOWNEASTWINDSORROOSEVELTGood- Any two <strong>of</strong> <strong>the</strong> above requirements for “ excellent” ordinances- For example, if <strong>the</strong> Tree Protection ordinance applies to exisiting development,but not new development, and has permits and penalties, it is “good”ROBBINSVILLEMILLSTONEPoor- Any one <strong>of</strong> <strong>the</strong> criteria listed for an “excellent” ordinance- For example, if <strong>the</strong>re is a limitation on <strong>the</strong> amount <strong>of</strong> trees that can be cut only for new developments,but <strong>the</strong>re are no penalties, and <strong>the</strong> clearing can be waived, such an ordinance “needs improvement”None- No forest protection ordinance has been adopted / OR- General language exists, but it is too vague to be enforceable* <strong>The</strong> Boroughs <strong>of</strong> <strong>the</strong> <strong>Stony</strong>-<strong>Brook</strong> <strong>Millstone</strong> <strong>Watershed</strong> are largelyconsidered built-out and include very little, if any streams andassociated buffers. <strong>The</strong>refore, <strong>the</strong>ir ordinances were rated usingcriteria that is slightly amended from that described above.Data Source: NJ Department <strong>of</strong> Environmental Protection – Municipal Boundary; NJ Department <strong>of</strong> Transportation – MajorRoad; SBMWA Forest Ordinance 08/09. With <strong>the</strong> exception <strong>of</strong> SBMWA, this secondary map product has not been verifiedor authorized by <strong>the</strong> source agencies. Map created by <strong>the</strong> GIS Center <strong>of</strong> <strong>the</strong> <strong>Stony</strong> <strong>Brook</strong>-<strong>Millstone</strong> <strong>Watershed</strong> Association10/2009. Project: 2009<strong>State</strong><strong>of</strong><strong>the</strong><strong>Watershed</strong>-Forest.mxd~28
Forest ProtectionWhat you can do...at home: property use native species, whichprovide higher quality habitat and foodsources for wildlife. property and replace <strong>the</strong>m if <strong>the</strong>y arean invasive species. Invasive speciescan crowd out native species. <strong>The</strong>Native Plant Society <strong>of</strong> New Jerseyis a great resource for learning abouttree and plant species, which areconsidered native or invasive.Local Advocacy: ordinance that prohibits plantinginvasive species as landscaping fordevelopments. a woodlands or forest protectionordinance, you can encourage yourlocal <strong>of</strong>ficials to adopt one.What is it?Forest and tree protection are important to a community’s character, provide recreationand shade, and habitat for wildlife. Forests and trees can be protected in several waysincluding preservation, stewardship <strong>of</strong> privately owned lands and by enforcement <strong>of</strong> localordinances restricting <strong>the</strong> amount <strong>of</strong> tree removal permitted when land is developed.Forest and woodlands protection ordinances can also require that when developmentoccurs or trees are removed illegally that a comparable number <strong>of</strong> trees are planted in <strong>the</strong>irplace.Why is it important?As we develop our communities, we increase <strong>the</strong> overall amount <strong>of</strong> hard surfaces suchas roads and building ro<strong>of</strong>tops. During rainstorms, water runs <strong>of</strong>f <strong>the</strong>se surfaces at a veryfast rate. It carries pollution such as oil and grit from streets, chemicals from lawns, andheat from <strong>the</strong>se surfaces to our streams and ground water sources. Trees and forests actas filters, removing much <strong>of</strong> this pollution. Trees also shade streams, making <strong>the</strong>m morehabitable for fish and o<strong>the</strong>r wildlife.How does <strong>the</strong> watershed measure up?Eighteen <strong>of</strong> <strong>the</strong> 26 municipalities in <strong>the</strong> watershed have adopted “excellent” or “good”forest and tree protection ordinances. Princeton Township is <strong>the</strong> most recent municipality*in our watershed to adopt a tree protection ordinance that requires a permit to removetrees and enforces penalties for tree removal. <strong>The</strong> <strong>Watershed</strong> Association continuesto work with local elected <strong>of</strong>ficials to adopt additional forest protection ordinances inplaces where more protection is needed. Hopewell Township and Manville and <strong>Millstone</strong>boroughs have no local ordinances that protect forests in those municipalities.* As <strong>of</strong> January 2010<strong>State</strong> <strong>of</strong> <strong>the</strong> <strong>Watershed</strong> <strong>Report</strong> 201029~
Types <strong>of</strong> Land Use in our <strong>Watershed</strong>1. Left: Stream2. Top right: Walking on trail4. Middle: Agricultural landscape3. Bottom right: Urbanized landscape~30
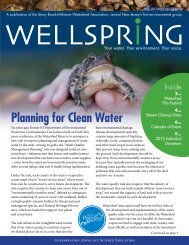
Land UseLand Use Distribution22.0%26.1%26.3%2002 UrbanAgricultureForestWetlands37.0%O<strong>the</strong>r3.0%19.0%197211.9%40.6%19304.2%19.0%20.9%0.3%21.0%0.5%Over <strong>the</strong> last 60 years New Jersey’s population has grown dramatically, just aboutdoubling from 4.8 million residents in 1950 to an estimated 8.6 million in 2008 (U.S.Census Bureau, 2009). Recognized as <strong>the</strong> most densely populated state in <strong>the</strong>nation, New Jersey is projected to reach full build-out in <strong>the</strong> next 15 to 25 years,meaning that all tracts <strong>of</strong> land in our state will ei<strong>the</strong>r be developed or preserved.were developed in <strong>the</strong> <strong>Stony</strong> <strong>Brook</strong>-<strong>Millstone</strong> <strong>Watershed</strong> between 1986 and 2002(<strong>the</strong> latest year for which data is available), a rate <strong>of</strong> approximately 110 acres – ormore than 100 football fields – per month (NJDEP, 2003).More development means more buildings, roads and parking lots, which createmore impervious cover – or surfaces that prevent rainfall from percolating into<strong>the</strong> soil. This increases <strong>the</strong> instances and severity <strong>of</strong> flooding and quantity <strong>of</strong>pollution that enter our streams. Land use also shapes environmental policydecisions. Urban, suburban and rural communities all have <strong>the</strong>ir own challengesand limitations. It is equally important to protect both places with less developmentto keep open spaces and natural areas healthy, and areas <strong>of</strong> more densedevelopment to prevent fur<strong>the</strong>r degradation.48.2%Our watershed by <strong>the</strong>numbers …59,068 acres <strong>of</strong> additional urbandevelopment (1930-2002)52,521 acres <strong>of</strong> farmland lost8,157 acres <strong>of</strong> forest lost<strong>State</strong> <strong>of</strong> <strong>the</strong> <strong>Watershed</strong> <strong>Report</strong> 201031~
Land Use Map 1930* <strong>The</strong> 1930 land use/land change layer was derived bymodifying 1972 land use/land change data based on<strong>the</strong> 1930 aerials.Data Sources: NJ Department <strong>of</strong> Environmental Protection - Land use/Land cover 1972, Streams 2002, and <strong>Watershed</strong>Management Area 2000; and NJ Office <strong>of</strong> Information Technology, Office <strong>of</strong> GIS - AirPhotos 1930. This secondary map producthas not been verified or authorized by <strong>the</strong> source agencies. Map created by <strong>the</strong> GIS Center <strong>of</strong> <strong>the</strong> <strong>Stony</strong> <strong>Brook</strong>-<strong>Millstone</strong><strong>Watershed</strong> Association 10/2009 Project: 2009<strong>State</strong><strong>of</strong><strong>the</strong><strong>Watershed</strong>-LULC1930.mxd~32
Land Use (continued)What you can do...at home: and management it appropriately. your property. Conclusion on page 38 to learn how.)Local Advocacy: policy in your community to encouragesmart planning and zoning decisions. expand its open space preservationprogram.What is it?<strong>The</strong> categories <strong>of</strong> land use included in <strong>the</strong> maps that follow are: wetland,agriculture, forest, urban and o<strong>the</strong>r.Why is it important?Land use is <strong>the</strong> glue that ties water quality and environmental policy toge<strong>the</strong>r. Howwe use or manage <strong>the</strong> land has a direct effect on <strong>the</strong> health and quality <strong>of</strong> ourwater and shapes decisions on environmental policy.How does <strong>the</strong> watershed measure up?<strong>The</strong> series <strong>of</strong> maps in this section illustrate how our watershed’s land use haschanged in <strong>the</strong> years from 1930 to 2002 (<strong>the</strong> latest year for which land usedata is available*).Overall agricultural lands in our watershed have diminished greatly, while urbanareas increased. This change can put additional pressure on our water andenvironment through habitat loss, increased flooding and “people” pollution. On<strong>the</strong> positive side, our watershed has experienced only a 2 percent loss <strong>of</strong> wetlandand a 5 percent loss <strong>of</strong> forested habitat. <strong>The</strong> Sourland Mountains (<strong>the</strong> green bandacross <strong>the</strong> northwest portion <strong>of</strong> <strong>the</strong> watershed) have remained relatively intact, anddevelopment has occurred more slowly near <strong>the</strong> headwaters <strong>of</strong> <strong>the</strong> <strong>Millstone</strong> River(<strong>the</strong> sou<strong>the</strong>rnmost tip <strong>of</strong> <strong>the</strong> watershed).To protect our remaining natural resources, <strong>the</strong> <strong>Watershed</strong> Association works onboth <strong>the</strong> state and local level to support funds and ballot initiatives for open spaceprotection, including <strong>the</strong> Open Space and Land Preservation Bond passed by NewJersey voters in 2009. To date, with our assistance, 22 <strong>of</strong> <strong>the</strong> 26 municipalitieswithin <strong>the</strong> <strong>Stony</strong> <strong>Brook</strong>-<strong>Millstone</strong> <strong>Watershed</strong> have open space funds or programsto preserve land (see chart on page 35). In addition, through <strong>the</strong> acquisition <strong>of</strong>open space and generous land donation <strong>the</strong> <strong>Watershed</strong> Association manages ourown 860-acre <strong>Watershed</strong> Reserve in Hopewell Township. It serves as a modelfor land conservation and responsible land management. We host <strong>the</strong> Honey<strong>Brook</strong> Organic Farm, educate <strong>the</strong> public and work one-on-one with landowners toimplement environmentally conscious land management techniques.* 2007 Land use data is expected to be released no sooner than 2011<strong>State</strong> <strong>of</strong> <strong>the</strong> <strong>Watershed</strong> <strong>Report</strong> 201033~
Land Use Map 1972Data Sources: NJ Department <strong>of</strong> Environmental Protection - Land use/Land cover 1972, Streams 2002, and <strong>Watershed</strong> ManagementArea 2000. This secondary map product has not been verified or authorized by <strong>the</strong> source agency. Map created by<strong>the</strong> GIS Center <strong>of</strong> <strong>the</strong> <strong>Stony</strong> <strong>Brook</strong>-<strong>Millstone</strong> <strong>Watershed</strong> Association 10/2009 Project: 2009<strong>State</strong><strong>of</strong><strong>the</strong><strong>Watershed</strong>-LULC1972.mxd~34
Land Use Map 2002Municipalities with Open Space Funds or ProgramsMunicipality Yes/No Municipality Yes/No Municipality Yes/NoCranbury Township Y Manville Borough N Princeton Borough YEast Amwell Township Y Manalapan Township Y Princeton Township YEast Windsor Township Y <strong>Millstone</strong> Borough N RobbinsvilleTownshipFranklin Township Y <strong>Millstone</strong> Township Y Rocky Hill Borough NHightstown Borough N Monroe Township Y Roosevelt Borough YHillsboroughTownshipHopewell Borough Y North BrunswickTownshipY Montgomery Township Y South BrunswickTownshipYWest AmwellTownshipHopewell Township Y Pennington Borough Y West WindsorTownshipLawrence Township Y Plainsboro Township YYYYYData Sources: NJ Department <strong>of</strong> Environmental Protection - Land use/Land cover 2002, Streams 2002, and <strong>Watershed</strong> ManagementArea 2000. This secondary map product has not been verified or authorized by <strong>the</strong> source agency. Map created by<strong>the</strong> GIS Center <strong>of</strong> <strong>the</strong> <strong>Stony</strong> <strong>Brook</strong>-<strong>Millstone</strong> <strong>Watershed</strong> Association 10/2009 Project: 2009<strong>State</strong><strong>of</strong><strong>the</strong><strong>Watershed</strong>-LULC2002.mxd<strong>State</strong> <strong>of</strong> <strong>the</strong> <strong>Watershed</strong> <strong>Report</strong> 201035~
Water Quality:StreamWatch DataParameter Tested Number <strong>of</strong> Sites that Meet Number <strong>of</strong> Sites thatViolateBacteria 6 12TSS -- -- No StreamWatch dataNitrate 30 1Orthophosphate 2 29Aquatic Life 1 11Dissolved Oxygen 25 6N/ANJDEP DataParameter TestedNumber <strong>of</strong> Municipalitiesthat MeetNumber <strong>of</strong> Municipalitiesthat ViolateBacteria 3 22 17TSS 19 6 21Nitrate 13 0 26Orthophosphate 5 11 25Aquatic Life 9 23 8Dissolved Oxygen 22 4 22* Because NJDEP data is not collected on a municipal boundary basis, <strong>the</strong> total municipalities in this chart do not add up to 26 across eachparameter. Some municipalities may have areas that meet and/or violate and/or are not tested.N/AEnvironmental Policy:Project for Municipal ExcellenceNumber <strong>of</strong> Municipalitieswith Completed <strong>Report</strong>sNumber <strong>of</strong> MunicipalitiesUndergoing Assessment15 1 10Number <strong>of</strong> MunicipalitiesNot EnrolledMunicipal OrdinancesNumber <strong>of</strong> Municipalities With:Stream CorridorProtection OrdinanceExcellent Good Poor Bad / None N/A5 4 8 1 8Septic Ordinance 1 2 15 0 8Forest ProtectionOrdinance11 7 5 3 0Land Use:Land Use Acreage1930 1972 2002Wetland 38,197.35 38,041.88 34,821.66Agriculture 87,847.33 74,217.86 35,326.14Forest 47,974.92 47,652.25 39,818.14Urban 7,573.22 21,335.05 66,640.99O<strong>the</strong>r * 552.66 898.45 5,538.55* O<strong>the</strong>r accounts for barren land or water.~36
Our findings:It’s important to understand <strong>the</strong> interrelated connections between water quality, environmentalpolicy and land use. Here are <strong>the</strong> connections we found: Land use affects water quality and shapes environmental policy. What we do on <strong>the</strong> landhas a direct effect on our water. All three <strong>of</strong> <strong>the</strong> biggest water quality issues facing ourwatershed – bacteria, orthophosphate and aquatic life – are all directly related to howwe care for our land and illustrate <strong>the</strong> huge effect individual actions have on <strong>the</strong> health andquality <strong>of</strong> our water. orthophosphate in our watershed are contributing to <strong>the</strong> decline inaquatic life. With a majority <strong>of</strong> soils in our watershed already laden with phosphate,additional fertilizers packed with phosphates are not needed. Continued use <strong>of</strong> fertilizersand cleaning products with phosphates is contributing to impaired aquatic life. septic and sewer system maintenance is critical to <strong>the</strong>health <strong>of</strong> our water. <strong>The</strong> majority <strong>of</strong> our watershed violates state standards for bacteria,is not safe for swimming and fishing, and where applicable <strong>the</strong> majority <strong>of</strong> municipalitiesin our watershed have poor septic ordinances. Streng<strong>the</strong>ning environmental policy andeducating homeowners is vital to ensuring we all have clean water to drink and use. forests and stream corridors is key to protecting <strong>the</strong> quality<strong>of</strong> our water. Our stream corridors and forests protect our streams by reducing <strong>the</strong> amount<strong>of</strong> sediment and nutrients that reach our streams. Ano<strong>the</strong>r benefit is <strong>the</strong>y help shade ourstreams. All <strong>of</strong> <strong>the</strong>se factors keep dissolved oxygen at acceptable levels. <strong>The</strong> majority <strong>of</strong>our watershed meets state standards for TSS, nitrate and dissolved oxygen. More thanone third <strong>of</strong> our municipalities have “excellent” forest protection ordinances and almostone quarter have “excellent” stream corridor ordinances. It’s critical to streng<strong>the</strong>n forestprotection and stream corridor measures to ensure our water stays healthy. land use changed from primarily anagricultural region to an area with increased urban development our forests and wetlandshave remained relatively intact. As our watershed continues to develop it is vital to protectour forests, wetlands and environmental resources through strong forest and streamcorridor protection ordinances. policies are needed to keep healthy areas in good condition, and faltering areas fromfur<strong>the</strong>r degradation. <strong>The</strong> land use and water quality conditions at hand influence <strong>the</strong>appropriate environmental policy solution.<strong>State</strong> <strong>of</strong> <strong>the</strong> <strong>Watershed</strong> <strong>Report</strong> 201037~
Conclusion<strong>The</strong> <strong>Stony</strong> <strong>Brook</strong>-<strong>Millstone</strong> <strong>Watershed</strong> Association is central New Jersey’s firstenvironmental group. For more than six decades, we have worked to protect cleanwater and <strong>the</strong> environment through a combination <strong>of</strong> conservation, advocacy,science and education.In our watershed increasing population and steady conversion <strong>of</strong> fields, forest andwetlands to asphalt and concrete have had a direct effect on <strong>the</strong> health and quality<strong>of</strong> our water and environment. Today, polluted run-<strong>of</strong>f – “people” pollution fromexcess lawn fertilizers, leaking septic systems and sewer lines, and pet waste – is<strong>the</strong> biggest contributor to water pollution in our watershed.To protect <strong>the</strong> quality <strong>of</strong> our water we need strong environmental policies. <strong>The</strong><strong>Watershed</strong> Association is working with nearly all 26 <strong>of</strong> our watershed municipalitiesto streng<strong>the</strong>n environmental protections. Equally as important, everyone incentral New Jersey needs to take individual action be part <strong>of</strong> <strong>the</strong> solution to ourenvironmental problems. How?Be a part <strong>of</strong> <strong>the</strong> solution to ourenvironmental problems. BecomeRiver-Friendly.Become River-Friendly. From picking up your pet’s waste and testing your soilbefore using lawn fertilizer, to telling your municipal leaders you want see septicmanagement and tree protection ordinances on <strong>the</strong> books in your hometown –toge<strong>the</strong>r we can ensure we all have clean water and a healthy environment foryears to come.Whe<strong>the</strong>r you are a resident, business owner, school or golf course <strong>the</strong> <strong>Watershed</strong>Association’s free River-Friendly stewardship program provides concrete stepsand tools to reducing your individual impact on <strong>the</strong> health <strong>of</strong> <strong>the</strong> <strong>Stony</strong> <strong>Brook</strong>-<strong>Millstone</strong> <strong>Watershed</strong>. Since 2002, more than 2,500 acres in central New Jerseyhave been certified as River-Friendly. Call (609) 737-3735 or email river-friendly@<strong>the</strong>watershed.org to become River-Friendly today.~38
AppendixReferencesNJDEP, 2003. Commissioner’s Udate. September-October 2003. [Online WWW].NJDEP, 2008. DEP Awards $3.2 Million in Grants to Aid Local Water-QualityImprovement Projects. Media Release, May 7, 2008.U.S. Census Bureau, 2009. <strong>State</strong> & County Quickfacts: New Jersey. [Online WWW].Differences in analytical methods:As referenced on page 7, StreamWatch and <strong>the</strong> NJDEP use different analytical methodsto determine results. StreamWatch volunteers analyze nitrates and orthophosphatesusing LaMotte test kits; dissolved oxygen is measured using a modified Winkler titrationmethod; and E. coli is analyzed in-house with <strong>the</strong> Coliscan Easygel method. NJDEPdata for <strong>the</strong>se parameters used to determine <strong>the</strong> 2008 Draft Integrated List results areanalyzed ei<strong>the</strong>r in a lab or in-situ with a meter. Both StreamWatch and NJDEP collectmacroinvertebrate samples and identify <strong>the</strong>m down to family.Special thanks to allthose who made thisreport possible:Jim Waltman,Executive DirectorManaging EditorGwen McNamara,Communications ManagerLayout & DesignJeffrey Tryon, TryographyMapsNicholas Ho, GIS CenterManagerSimcha Rudolph, GISVolunteerWater QualityPeggy Savage, ScienceDirectorBeth April, StreamWatchProgram CoordinatorEnvironmental PolicyJennifer C<strong>of</strong>fey,Policy DirectorJoan McGee, <strong>Watershed</strong>Policy SpecialistLeslie Brecknell,Community AdvocacyCoordinatorAnneli TerryNelson,Community AdvocacyCoordinatorRiver-FriendlyAmy Weaver, LandStewardship Coordinator<strong>State</strong> <strong>of</strong> <strong>the</strong> <strong>Watershed</strong> <strong>Report</strong> 201039~
<strong>Stony</strong> <strong>Brook</strong>-<strong>Millstone</strong> <strong>Watershed</strong> AssociationYour water Your environment Your voice.