

Non-rigid registration between 3D ultrasound and CT ... - isl, ee, kaist
Non-rigid registration between 3D ultrasound and CT ... - isl, ee, kaist
Non-rigid registration between 3D ultrasound and CT ... - isl, ee, kaist

Create successful ePaper yourself
Turn your PDF publications into a flip-book with our unique Google optimized e-Paper software.
IOP PUBLISHINGPhys. Med. Biol. 56 (2011) 117–137PHYSICS IN MEDICINE AND BIOLOGYdoi:10.1088/0031-9155/56/1/008<strong>Non</strong>-<strong>rigid</strong> <strong>registration</strong> <strong>betw<strong>ee</strong>n</strong> <strong>3D</strong> <strong>ultrasound</strong> <strong>and</strong> <strong>CT</strong>images of the liver based on intensity <strong>and</strong> gradientinformationDuhgoon L<strong>ee</strong> 1 , Woo Hyun Nam 1 , Jae Young L<strong>ee</strong> 2 <strong>and</strong> Jong Beom Ra 11 Department of Electrical Engin<strong>ee</strong>ring, KAIST, Daejeon, Korea2 Department of Radiology, Seoul National University Hospital, Seoul, Korea1. IntroductionE-mail: jbra@<strong>ee</strong>.<strong>kaist</strong>.ac.krReceived 30 June 2010, in final form 20 October 2010Published 30 November 2010Online at stacks.iop.org/PMB/56/117AbstractIn order to utilize both <strong>ultrasound</strong> (US) <strong>and</strong> computed tomography (<strong>CT</strong>) imagesof the liver concurrently for medical applications such as diagnosis <strong>and</strong> imageguidedintervention, non-<strong>rigid</strong> <strong>registration</strong> <strong>betw<strong>ee</strong>n</strong> these two types of imagesis an essential step, as local deformation <strong>betw<strong>ee</strong>n</strong> US <strong>and</strong> <strong>CT</strong> images existsdue to the different respiratory phases involved <strong>and</strong> due to the probe pressurethat occurs in US imaging. This paper introduces a voxel-based non-<strong>rigid</strong><strong>registration</strong> algorithm <strong>betw<strong>ee</strong>n</strong> the <strong>3D</strong> B-mode US <strong>and</strong> <strong>CT</strong> images of theliver. In the proposed algorithm, to improve the <strong>registration</strong> accuracy, weutilize the surface information of the liver <strong>and</strong> gallbladder in addition tothe information of the vessels inside the liver. For an effective correlation<strong>betw<strong>ee</strong>n</strong> US <strong>and</strong> <strong>CT</strong> images, we treat those anatomical regions separatelyaccording to their characteristics in US <strong>and</strong> <strong>CT</strong> images. Based on a novelobjective function using a <strong>3D</strong> joint histogram of the intensity <strong>and</strong> gradientinformation, vessel-based non-<strong>rigid</strong> <strong>registration</strong> is followed by surface-basednon-<strong>rigid</strong> <strong>registration</strong> in sequence, which improves the <strong>registration</strong> accuracy.The proposed algorithm is tested for ten clinical datasets <strong>and</strong> quantitativ<strong>ee</strong>valuations are conducted. Experimental results show that the <strong>registration</strong>error <strong>betw<strong>ee</strong>n</strong> anatomical features of US <strong>and</strong> <strong>CT</strong> images is less than 2 mm onaverage, even with local deformation due to different respiratory phases <strong>and</strong>probe pressure. In addition, the lesion <strong>registration</strong> error is less than 3 mm onaverage with a maximum of 4.5 mm that is considered acceptable for clinicalapplications.(Some figures in this article are in colour only in the electronic version)The <strong>ultrasound</strong> (US) imaging system is popularly utilized in various clinical areas, as thistype of imaging is non-invasive, occurs in real-time <strong>and</strong> is less expensive than other imaging0031-9155/11/010117+21$33.00 © 2011 Institute of Physics <strong>and</strong> Engin<strong>ee</strong>ring in Medicine Printed in the UK 117
118 DL<strong>ee</strong>et almodalities such as computed tomography (<strong>CT</strong>) or magnetic resonance imaging (MR imaging).Especially in the case of the liver, US scanning is frequently performed for clinical applicationssuch as diagnoses, biopsies, percutaneous ethanol injection therapies <strong>and</strong> radio-frequencyablations. However, due to lower overall image quality of US images than that of <strong>CT</strong> or MRimages, clinicians often have difficulty in examining target organ(s) in their applications. Toovercome this limit of US imaging, there have b<strong>ee</strong>n several attempts to display or fuse a USimage with its corresponding high-quality <strong>CT</strong> (or MR) image to provide clear informationregarding the anatomy <strong>and</strong>/or target lesion(s) (Lange et al 2004, 2009,L<strong>ee</strong>et al 2008, Penneyet al 2001, 2004, Weinet al 2008, 2010). Given that lesions in a US image are often nearlyinvisible, the corresponding <strong>CT</strong> image is helpful for providing lesion information to cliniciansfor diagnosis <strong>and</strong> planning of US-guided intervention. To achieve a <strong>CT</strong> image preciselyaligned to a US image for the liver, non-<strong>rigid</strong> <strong>registration</strong> <strong>betw<strong>ee</strong>n</strong> US <strong>and</strong> <strong>CT</strong> images isrequired.An objective function, such as a similarity or dissimilarity measure, must be properlydefined for a successful <strong>registration</strong>. However, as the relationship <strong>betw<strong>ee</strong>n</strong> US <strong>and</strong> <strong>CT</strong> imagesvaries with organs, the objective function <strong>betw<strong>ee</strong>n</strong> US <strong>and</strong> <strong>CT</strong> depends on the organ inwhich the <strong>registration</strong> is applied, although there have b<strong>ee</strong>n efforts made in defining an organindependentfunction (Zhang et al 2006). The <strong>registration</strong> <strong>betw<strong>ee</strong>n</strong> the US <strong>and</strong> MR images ofthe brain is introduced by correlating the intensities of the US image with both the intensities<strong>and</strong> gradient magnitudes of the MR image based on a bivariate correlation ratio (Roche et al2001). For the <strong>registration</strong> of the US <strong>and</strong> <strong>CT</strong> prostate images, mutual information has b<strong>ee</strong>nadopted as a similarity measure (Castro-Pareja et al 2005). A <strong>registration</strong> algorithm for theUS <strong>and</strong> <strong>CT</strong> images of the spine was also introduced (Brendel et al 2002). In that paper, afteran estimation of the surface of the spine in both images, the objective function is defined asthe average intensity value of the points in the US image corresponding to sample points onthe estimated surface in the <strong>CT</strong> image.For the <strong>registration</strong> of the US <strong>and</strong> <strong>CT</strong> images of the liver, several algorithms have b<strong>ee</strong>nsuggested. Two of these <strong>registration</strong> algorithms adopt a voxel-based approach (Penney et al2004, Weinet al 2008). As the image characteristics of a US liver image differ from thecharacteristics of a <strong>CT</strong> liver image, these methods typically convert the US image <strong>and</strong>/or<strong>CT</strong>/MR image into a different type of image(s) to correlate the two images. More specifically,one algorithm converts US <strong>and</strong> MR images into vessel probability images by remapping theintensities based on a set of training data (Penney et al 2004). The algorithm then usesthe normalized cross-correlation similarity measure <strong>betw<strong>ee</strong>n</strong> the two probability images tooptimize the <strong>rigid</strong> transformation parameters. The other algorithm generates a simulated USimage from the <strong>CT</strong> image on the basis of US physics (Wein et al 2008). Registration is thenperformed by examining the similarity <strong>betw<strong>ee</strong>n</strong> the simulated <strong>and</strong> original US images basedon the correlation ratio. The semi-affine transformation model is used in this <strong>registration</strong>. Afeature-based approach was also used (Penney et al 2001). In this approach, which uses thevessel centerline <strong>and</strong> liver surface as features, an ICP-based <strong>rigid</strong> <strong>registration</strong> algorithm isdeveloped in which the objective function is given as the average closest distance <strong>betw<strong>ee</strong>n</strong> thefeature samples of the US <strong>and</strong> <strong>CT</strong> images. In this approach, a segmentation step is requiredfor the extraction of features in both US <strong>and</strong> <strong>CT</strong> images.It is known that the liver undergoes respiratory motion <strong>and</strong> that its degr<strong>ee</strong> of movementvaries with the subject (Br<strong>and</strong>ner et al 2006, Shimizu et al 1999). Furthermore, the respiratorymotion of the liver consists of non-<strong>rigid</strong> deformation as well as <strong>rigid</strong> translation. It has b<strong>ee</strong>nfound that in cases involving deformation of the liver, there is an average <strong>registration</strong> error ofapproximately 10 mm <strong>betw<strong>ee</strong>n</strong> the inspiration <strong>and</strong> expiration phases after <strong>rigid</strong> <strong>registration</strong>.<strong>Non</strong>-<strong>rigid</strong> <strong>registration</strong> can successfully compensate for this deformation (Rohlfing et al 2004).
<strong>Non</strong>-<strong>rigid</strong> <strong>registration</strong> <strong>betw<strong>ee</strong>n</strong> <strong>3D</strong> <strong>ultrasound</strong> <strong>and</strong> <strong>CT</strong> images of the liver 119In a <strong>CT</strong> scan, an image is usually acquired at either the end-inspiration phase or th<strong>ee</strong>nd-expiration phase in accordance with the imaging protocol. However, it is practically verydifficult to obtain a US image at the exactly same respiratory phase that corresponds to a <strong>CT</strong>image. Moreover, in some applications, multiple <strong>registration</strong>s of a <strong>CT</strong> image to US imagesin various respiratory phases are required. Hence, it should be considered in the <strong>registration</strong>process that the US <strong>and</strong> <strong>CT</strong> images may be acquired at different respiratory phases. In addition,the probe pressure during US scanning can cause local deformation of organs (Mcgahan et al2004, Tr<strong>ee</strong>cea et al 2002). Therefore, local deformation due to the US probe pressure can alsobe a source of <strong>registration</strong> error in any <strong>registration</strong> <strong>betw<strong>ee</strong>n</strong> the US <strong>and</strong> <strong>CT</strong> images of the liver.This error should also be compensated for. However, all of the aforementioned <strong>registration</strong>algorithms <strong>betw<strong>ee</strong>n</strong> the US <strong>and</strong> <strong>CT</strong> images of the liver are based on a global transformationbased on <strong>rigid</strong> or semi-affine parameters. Hence, they cannot sufficiently compensate for localdeformation due to the probe pressure <strong>and</strong> the different respiratory phases <strong>betw<strong>ee</strong>n</strong> US <strong>and</strong><strong>CT</strong> scans.To describe the spatial relationship <strong>betw<strong>ee</strong>n</strong> US <strong>and</strong> <strong>CT</strong> image precisely with consideringlocal deformations, several trials of non-<strong>rigid</strong> <strong>registration</strong> have b<strong>ee</strong>n attempted. An ICP-basednon-<strong>rigid</strong> <strong>registration</strong> algorithm (Lange et al 2004) used an additional power Doppler (PD)US image to register the <strong>CT</strong> image to a B-mode US image, adopting multilevel B-splines(Xie <strong>and</strong> Farin 2001) for modeling the non-<strong>rigid</strong> transformation. In this algorithm, only thevessel information or the samples of vessel centerlines were utilized for the <strong>registration</strong>. Anon-<strong>rigid</strong> <strong>registration</strong> algorithm was also developed that used combined l<strong>and</strong>mark-intensityinformation (Lange et al 2009). In this algorithm, a few corresponding l<strong>and</strong>mark pairs aremanually selected in advance. Based on this prior knowledge of l<strong>and</strong>marks <strong>and</strong> on thenormalized gradient field (Haber <strong>and</strong> Modersitzki 2006) <strong>betw<strong>ee</strong>n</strong> PD US <strong>and</strong> <strong>CT</strong> images, anenergy functional is defined <strong>and</strong> minimized to estimate the transformation. Instead of usingPD US images, B-mode US images were directly used in a couple of non-<strong>rigid</strong> <strong>registration</strong>algorithms (L<strong>ee</strong> et al 2008, Weinet al 2010). Preliminary research was conducted on thenon-<strong>rigid</strong> <strong>registration</strong> <strong>betw<strong>ee</strong>n</strong> the B-mode US <strong>and</strong> <strong>CT</strong> images of the liver by using a similaritymeasure based on intensity <strong>and</strong> gradient information (L<strong>ee</strong> et al 2008). They adopt a parametrictransformation based on a B-spline fr<strong>ee</strong> form deformation (FFD) model <strong>and</strong> estimate it byminimizing a cost function based on the similarity. Wein et al (2010) have recently extendedtheir previous <strong>registration</strong> algorithm (Wein et al 2008) to the non-<strong>rigid</strong> <strong>registration</strong>. Theypropose a two-component similarity measure based on local cross-correlation <strong>and</strong> maximizeit using a variational <strong>registration</strong> framework for obtaining a deformable transformation.The present paper proposes an accurate voxel-based <strong>registration</strong> algorithm <strong>betw<strong>ee</strong>n</strong> the<strong>3D</strong> B-mode US <strong>and</strong> <strong>CT</strong> images of the liver. The proposed algorithm also focuses on non-<strong>rigid</strong><strong>registration</strong> <strong>and</strong> aims to improve the <strong>registration</strong> accuracy by considering local deformationsdue to patient respiration <strong>and</strong> the US probe pressure, which cannot be compensated for using aglobal <strong>registration</strong> algorithm. In the proposed algorithm, to improve the <strong>registration</strong> accuracy,both the vessel information <strong>and</strong> the surface information of the liver <strong>and</strong> gallbladder (GB)are used for the <strong>registration</strong> of the liver image. Based on the correlation of the intensity<strong>and</strong> gradient information <strong>betw<strong>ee</strong>n</strong> US <strong>and</strong> <strong>CT</strong> images, different similarity measures areconsidered according to the image characteristics of the feature regions, including the livervessels <strong>and</strong> the surfaces of the liver <strong>and</strong> GB in the two images. To describe the similaritymeasures <strong>betw<strong>ee</strong>n</strong> US <strong>and</strong> <strong>CT</strong> images, an objective function based on intensity <strong>and</strong> gradientinformation that we had originally introduced for the <strong>registration</strong> <strong>betw<strong>ee</strong>n</strong> CCD <strong>and</strong> IR imagesis adopted (Kim et al 2008). The proposed <strong>registration</strong> algorithm sequentially performsthe vessel-based <strong>and</strong> surface-based <strong>registration</strong> processes based on corresponding similaritymeasures.
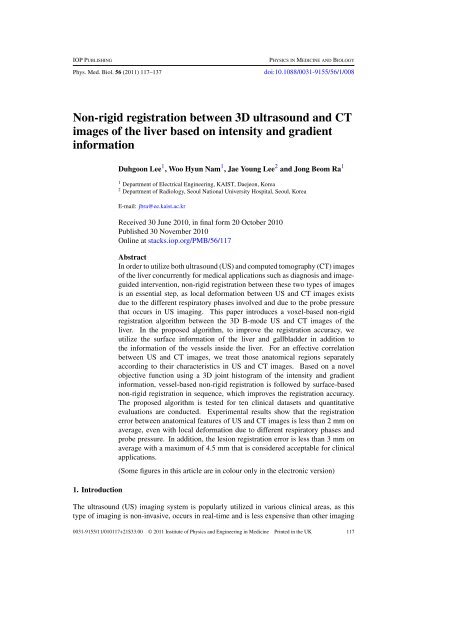
120 DL<strong>ee</strong>et alCoronalSagittalAxialFigure 1. GB surface attached to the liver.The paper is organized as follows. In section 2, the <strong>registration</strong> algorithm based on thevessel <strong>and</strong> surface information is described in detail. Section 3 describes the experimentalresults for the clinical datasets. Finally, the conclusions are given in section 4.2. The proposed method2.1. Anatomical features for <strong>registration</strong>For the two given images of a US image <strong>and</strong> a contrast-enhanced <strong>CT</strong> image, we aim to finda transformation that aligns the <strong>CT</strong> onto the US image through a <strong>registration</strong> process. Forthis process, we utilize several anatomical features in the liver, specifically the vessels, liversurface <strong>and</strong> GB surface attached to the liver. Vessels are well-known features in <strong>registration</strong>s<strong>betw<strong>ee</strong>n</strong> the US <strong>and</strong> <strong>CT</strong> images of the liver because they are visible in both images (Lang<strong>ee</strong>t al 2004, 2009, Penney et al 2001, 2004, Weinet al 2008). The liver surface is alsoidentifiable in both images; hence, some researchers have used it as a meaningful feature for<strong>registration</strong> (L<strong>ee</strong> et al 2008, Penney et al 2001, Weinet al 2008, 2010). Moreover, clinical<strong>3D</strong> US images often include a part of the GB in the region of interest, <strong>and</strong> it is known thata certain part of the GB is attached to the liver (Moore <strong>and</strong> Agur 2007). The <strong>CT</strong> image infigure 1 demonstrates that the GB surface is attached to the liver on the solid lines. We willattempt to use this GB surface as an additional effective feature for the <strong>registration</strong> of the liverimage.To correlate the US <strong>and</strong> <strong>CT</strong> images of the liver, we focus on the intensity <strong>and</strong> gradientinformation for each feature region. The intensity values of vessels in a conventional B-modeUS image are lower than those of the neighboring area of the vessels, as shown in figure 2(a).
<strong>Non</strong>-<strong>rigid</strong> <strong>registration</strong> <strong>betw<strong>ee</strong>n</strong> <strong>3D</strong> <strong>ultrasound</strong> <strong>and</strong> <strong>CT</strong> images of the liver 121(a)(b)(c)(d)Figure 2. Relationship <strong>betw<strong>ee</strong>n</strong> US <strong>and</strong> <strong>CT</strong> images of vessels: (a) US image, (b) contrast-enhanced<strong>CT</strong> image, (c) <strong>and</strong> (d) gradient orientations of a vessel region in US <strong>and</strong> <strong>CT</strong> images, respectively.In a contrast-enhanced <strong>CT</strong> image, the intensity values of vessels are higher than those of softtissue, as shown in figure 2(b). Therefore, in a statistical sense, the intensity values of a USimage are likely related to those of a <strong>CT</strong> image in the vessel region. The edge orientation canalso be a common feature of US <strong>and</strong> <strong>CT</strong> vessels, as shown in figures 2(c) <strong>and</strong> (d). Thus, it canalso be used as important information in the <strong>registration</strong>.The liver surface has high reflectivity to the US beam if the acoustic impedance differenceis large <strong>betw<strong>ee</strong>n</strong> the regions inside <strong>and</strong> outside the liver. Hence, the corresponding liver surfaceprovides high intensity values in US images. Meanwhile, the <strong>CT</strong> liver image shows a definiteboundary for the liver surface by providing different intensity values <strong>betw<strong>ee</strong>n</strong> regions inside<strong>and</strong> outside the liver. Therefore, the liver surface in the <strong>CT</strong> image provides high gradientvalues, which can be related to the high intensity values in the US image, as shown in the solidboxes in figures 3(a) <strong>and</strong> (b). In addition, the edge orientation is useful information, as it isavailable in both US <strong>and</strong> <strong>CT</strong> images <strong>and</strong> is strongly correlated <strong>betw<strong>ee</strong>n</strong> them. Figures 3(c)<strong>and</strong> (d) demonstrate the edge orientation via arrows within a liver surface region.In contrast to the liver surface with a large acoustic impedance difference, the GB surfaceattached to the liver shows a definite boundary with different intensity values <strong>betw<strong>ee</strong>n</strong> regionsinside <strong>and</strong> outside the GB in both US <strong>and</strong> <strong>CT</strong> images, as shown in the dotted boxes infigures 3(a) <strong>and</strong> (b). Hence, the intensity values are directly correlated with each other. Edgeorientations in the GB surface region are also highly correlated, as shown in figures 3(e) <strong>and</strong>(f).2.2. Overview of the proposed algorithmBased on the image characteristics described above, we propose an accurate <strong>registration</strong>algorithm <strong>betw<strong>ee</strong>n</strong> the US <strong>and</strong> <strong>CT</strong> images of the liver. A diagram of the proposed algorithm
122 DL<strong>ee</strong>et al(a)(b)(c)(d)(e)(f)Figure 3. Relationship <strong>betw<strong>ee</strong>n</strong> the US <strong>and</strong> <strong>CT</strong> images of the liver <strong>and</strong> GB surface regions: (a)US image, (b) contrast-enhanced <strong>CT</strong> image, (c) <strong>and</strong> (d) gradient orientations of the liver surfaceregion in US <strong>and</strong> <strong>CT</strong> images, respectively, <strong>and</strong> (e) <strong>and</strong> (f) gradient orientations of the GB surfaceregion in US <strong>and</strong> <strong>CT</strong> images, respectively.is given in figure 4. We first perform preprocessing, which includes an automatic denoisingprocess in the US image <strong>and</strong> automatic denoising <strong>and</strong> semi-automatic anatomical featur<strong>ee</strong>xtraction in the <strong>CT</strong> image, respectively. The <strong>registration</strong> process is then conducted onlyusing the vessel information. Based on the vessel-based <strong>registration</strong> result, <strong>registration</strong> isperformed again using the surface information. Finally, a transformation is estimated usingboth the vessel- <strong>and</strong> surface-based <strong>registration</strong> results <strong>and</strong> a <strong>CT</strong> image registered to the USimage is generated via the estimated transformation. Each step is described in detail in thefollowing subsections.In the algorithm, the <strong>registration</strong> process is divided into the two parts: vessel-based<strong>registration</strong> <strong>and</strong> surface-based <strong>registration</strong>. These are performed sequentially. As vesselscontain salient features in the <strong>3D</strong> space, the non-<strong>rigid</strong> <strong>registration</strong> based on the vesselinformation can provide accurate alignment of the vessels <strong>betw<strong>ee</strong>n</strong> the US <strong>and</strong> <strong>CT</strong> images. Incontrast, the liver <strong>and</strong> GB surfaces have smooth <strong>and</strong> convex shapes in US images. Locating
<strong>Non</strong>-<strong>rigid</strong> <strong>registration</strong> <strong>betw<strong>ee</strong>n</strong> <strong>3D</strong> <strong>ultrasound</strong> <strong>and</strong> <strong>CT</strong> images of the liver 123US image<strong>CT</strong> imagePreprocessingPreprocessingFiltered US image<strong>CT</strong> segments ofvesselsFiltered <strong>CT</strong> image &mask of vesselsRigid <strong>registration</strong>T <strong>rigid</strong>_vessel<strong>Non</strong>-<strong>rigid</strong><strong>registration</strong>T reg_vesselBased onvesselinformationEstimation of thetransformationAutomaticprocedureSemi-automaticprocedureFiltered <strong>CT</strong> image &masks of liver <strong>and</strong> GBsurfaces<strong>CT</strong> segments ofsurfacesT est_vessel<strong>Non</strong>-<strong>rigid</strong><strong>registration</strong>T reg_surfaceFinal estimation ofthe transformationT est_v&sRegistered <strong>CT</strong>Based onsurfaceinformationBased onvessel <strong>and</strong> surfaceinformationFigure 4. The <strong>registration</strong> process.Surface in US imageSurface in <strong>CT</strong> image(a) (b) (c)Figure 5. Schematic illustration of surface alignment ambiguity: (a) relative surface positionsof US <strong>and</strong> <strong>CT</strong> images before non-<strong>rigid</strong> <strong>registration</strong>, (b) <strong>and</strong> (c) two different but well-alignednon-<strong>rigid</strong> <strong>registration</strong> results.salient features on these surfaces is difficult. The liver <strong>and</strong> GB surfaces appearing in aUS image are also only a part of the entire surface in the <strong>CT</strong> image. Therefore, non-<strong>rigid</strong><strong>registration</strong> based only on the surface information cannot guarant<strong>ee</strong> a correct alignment inthe region near the surfaces, although the surfaces of US <strong>and</strong> <strong>CT</strong> images appear to be wellaligned in the <strong>3D</strong> space after <strong>registration</strong> due to the high degr<strong>ee</strong> of fr<strong>ee</strong>dom (DOF) in the non<strong>rigid</strong><strong>registration</strong> process. Figure 5 illustrates this ambiguity in the surface <strong>registration</strong> of theliver.To overcome this inherent limit of a surface <strong>registration</strong> <strong>and</strong> guarant<strong>ee</strong> a more reliable<strong>registration</strong> process for the surface region, a good initial transformation prior to the non-<strong>rigid</strong><strong>registration</strong> <strong>betw<strong>ee</strong>n</strong> the surfaces is necessary. Hence, in the proposed <strong>registration</strong> process,for a more reliable <strong>registration</strong>, the initial transformation is estimated first based on the vesselbased<strong>registration</strong>. This result is then applied to the surface-based <strong>registration</strong>.
124 DL<strong>ee</strong>et alFigure 6. Anatomical features in a <strong>3D</strong> <strong>CT</strong> image for the <strong>registration</strong>.2.3. PreprocessingGiven that the proposed <strong>registration</strong> algorithm is based on the intensity value of each voxel inUS <strong>and</strong> <strong>CT</strong> images, a denoising process is used before <strong>registration</strong>. To remove the noise whilesimultaneously preserving edges even with low contrast, for both the US <strong>and</strong> <strong>CT</strong> images,we apply a noise-constrained filtering algorithm with anisotropic diffusion that considers thenoise characteristics of each image (Krissian et al 2005).As mentioned above, for <strong>registration</strong> <strong>betw<strong>ee</strong>n</strong> the US <strong>and</strong> <strong>CT</strong> images of the liver, it isnecessary to manipulate the anatomical information of the vessels, liver <strong>and</strong> GB that areidentifiable in both images. To contend with this anatomical information, we segment thevessels, liver <strong>and</strong> GB only in the <strong>CT</strong> image. Here, the segmentation process in the <strong>CT</strong> imageis not necessarily automatic; it can be considered as a preoperative processing step that usesvarious complex <strong>and</strong>/or user-interactive approaches for a satisfactory segmentation result. Inthis paper, to segment the organs, we first extract the organs by applying a conventional regiongrowingscheme (Adams <strong>and</strong> Bischof 1994) to a filtered <strong>CT</strong> image. The segmented organs arethen manually refined using <strong>3D</strong> sculpting software. Figure 6 shows a volume-rendered imageof segmented <strong>CT</strong> organs. Based on the segmentation results, we generate masks M <strong>CT</strong>_V ,M <strong>CT</strong>_LS <strong>and</strong> M <strong>CT</strong>_GS of the anatomical features of the vessels <strong>and</strong> surfaces of the liver <strong>and</strong>GB, respectively. The masks include voxels within the regions which are obtained simply bymorphologically dilating the segmented anatomical features with a margin of 3 mm.2.4. Registration based on vessel informationTo utilize the vessel information in the <strong>registration</strong> process, we establish a relationship of theintensity <strong>and</strong> the edge orientation in the vessel region <strong>betw<strong>ee</strong>n</strong> the US <strong>and</strong> <strong>CT</strong> images <strong>and</strong>adopt a similarity measure based on this relationship. By minimizing the cost as defined viathe similarity measure, we first find the parametric transformation T reg_vessel through the <strong>rigid</strong><strong>and</strong> non-<strong>rigid</strong> <strong>registration</strong>s that aligns the vessel region in the <strong>CT</strong> image onto that in the USimage. The transformation T est_vessel for the whole liver, to be used as the initial transformationin the subsequent process, is then estimated based on the obtained T reg_vessel . Details of theprocedure are given below.
<strong>Non</strong>-<strong>rigid</strong> <strong>registration</strong> <strong>betw<strong>ee</strong>n</strong> <strong>3D</strong> <strong>ultrasound</strong> <strong>and</strong> <strong>CT</strong> images of the liver 125Filtered US imageInitial transformationFiltered <strong>CT</strong> image &a mask of anatomical featureGenerate a mask.Transform the image & mask.Calculategradient informationin the mask.Calculategradient informationin the mask.Calculate the cost.Updatelocal transformationparameters.Minimum?NoYesEndFigure 7. The proposed non-<strong>rigid</strong> <strong>registration</strong> scheme used in figure 4.2.4.1. Rigid <strong>registration</strong>. To obtain the <strong>rigid</strong> transformation, T <strong>rigid</strong>_vessel , <strong>betw<strong>ee</strong>n</strong> the US<strong>and</strong> <strong>CT</strong> images of the liver, an ICP-based <strong>rigid</strong> <strong>registration</strong> algorithm is applied that uses thecenterlines of the vessels in the liver (Nam et al 2010). To extract the centerlines of segmentedvessels in the <strong>CT</strong> image, we apply Bitter’s skeletonization method to the pre-segmented vessels(Bitter et al 2001). For the centerlines of the vessels in the US image, we adopt our previouslypresented automatic feature extraction algorithm in a <strong>3D</strong> B-mode US image (Nam et al 2008).2.4.2. <strong>Non</strong>-<strong>rigid</strong> <strong>registration</strong>. The <strong>rigid</strong> transformation T <strong>rigid</strong>_vessel is used as the initialtransformation to obtain the non-<strong>rigid</strong> transformation T reg vessel . This can be represented asT reg vessel (x) = T <strong>rigid</strong> vessel (x) + T local (x) . (1)Here, x denotes a point in the US image <strong>and</strong> T local denotes the local transformation.Additionally, T local is obtained through the proposed non-<strong>rigid</strong> <strong>registration</strong> algorithm. Inthe algorithm, a B-spline FFD model known to be appropriate for liver motion modeling(Rohlfing et al 2004) is also adopted.The overall structure of the proposed non-<strong>rigid</strong> <strong>registration</strong> algorithm is illustrated infigure 7. As inputs to the algorithm, the filtered US <strong>and</strong> <strong>CT</strong> images <strong>and</strong> the <strong>CT</strong> mask ofanatomical feature are applied through the preprocessing step described in subsection 2.2.Initial transformation is applied through the <strong>rigid</strong> <strong>registration</strong> described in subsection 2.4.1.Note that by focusing only on the features in the mask, we can avoid interferences fromoutside the mask in the <strong>registration</strong> procedure. First, a mask of the corresponding US featureis automatically generated from the filtered <strong>3D</strong> US image. The <strong>CT</strong> mask is also deformed basedon the updated parameters <strong>and</strong> the gradient information in the mask regions of both the US<strong>and</strong> the deformed <strong>CT</strong> images is then calculated. Using the intensity <strong>and</strong> gradient informationin the overlapping mask region, the cost is calculated. This consists of an objective function<strong>and</strong> a constraint. It is minimized through an optimization process to determine T reg_vessel .Indetermining T reg_vessel , as only masked vessel regions are used, it is possible not only to reducethe computation time but also to alleviate any undesirable effects of noisy non-vessel regionsduring the <strong>registration</strong> process.
126 DL<strong>ee</strong>et alMask. An accurate <strong>CT</strong> vessel mask can be determined because user-interactive vesselsegmentation is allowed in the preprocessing step. On the other h<strong>and</strong>, for a given accurate<strong>CT</strong> vessel mask, a relatively low accuracy of the US vessel mask is acceptable because onlythe overlapping mask <strong>betw<strong>ee</strong>n</strong> US <strong>and</strong> <strong>CT</strong> is used for <strong>registration</strong>. Hence, we determine USvessel c<strong>and</strong>idates using only an adaptive threshold scheme, which is a part of a complicatedvessel extraction algorithm for <strong>3D</strong> B-mode US images (Nam et al 2008). In the scheme, thethreshold is given asTh 1 (n) = μ LN (n) − σ LN (n), (2)where μ LN (n) is the mean of the intensities in a <strong>3D</strong> local window with N voxels centeredat voxel n <strong>and</strong> σ LN (n) is the st<strong>and</strong>ard deviation of the intensities in the local window. Thevoxels with intensities that are lower than the threshold Th 1 are regarded as vessel c<strong>and</strong>idates.The vessel mask M US_V is then determined as a dilated version of the vessel c<strong>and</strong>idates. Thegradient information of the US <strong>and</strong> deformed <strong>CT</strong> images is then extracted only in the vesselmasks <strong>and</strong> the cost is calculated only in the overlapping region of the two vessel masks fromthe US <strong>and</strong> deformed <strong>CT</strong> images.Edge orientation. To obtain the edge orientation information, it is necessary to calculate agradient vector at each voxel. To obtain the gradient vectors, we adopt an eigen analysis ofa structure tensor (Harris <strong>and</strong> Stephens 1988). The structure tensor S at each voxel can bewritten as⎛ ⎞⎛G xK ρ ∗ G 2 ⎞x K ρ ∗ G x G y K ρ ∗ G x G zS(∇I)= K ρ ∗ ⎝G y⎠ (G x G y G z ) = ⎝K ρ ∗ G y G x K ρ ∗ G 2 y K ρ ∗ G y G z⎠ , (3)G z K ρ ∗ G z G x K ρ ∗ G z G y K ρ ∗ G 2 zwhere G x , G y <strong>and</strong> G z denote the intensity gradients along the x, y <strong>and</strong> z directions in image I,respectively. Additionally, the Gaussian convolution kernel, K ρ , with the st<strong>and</strong>ard deviationρ can be expressed asK ρ (x,y,z)= (2πρ 2 ) −1 · exp(− x2 + y 2 + z 2 ). (4)2ρ 2Through eigenvalue decomposition, S can be rewritten as⎛⎞ ⎛μ 1 0 0 ω T ⎞1S(∇I) = (ω 1 ω 2 ω 3 ) ⎝ 0 μ 2 0 ⎠ ⎝ω T ⎠2 . (5)0 0 μ 3 ω T 3Here, the eigenvectors ω 1 <strong>and</strong> ω 3 represent the directions of the maximum <strong>and</strong> minimumintensity variations, respectively, while the eigenvalues μ 1 <strong>and</strong> μ 3 denote the magnitudes ofω 1 <strong>and</strong> ω 3 , respectively. A voxel with an anisotropic nature has a large difference <strong>betw<strong>ee</strong>n</strong> itsmaximum <strong>and</strong> minimum eigenvalues <strong>and</strong> is likely to locate on an edge. Hence, we regard ω 1as the edge orientation <strong>and</strong> μ 1 – μ 3 as the gradient magnitude. To alleviate the noise effect,we discriminate the edge region R inagivenmaskM as follows:R = {x |μ 1 (x) − μ 3 (x) > Th 2 , x ∈ M } . (6)Objective function. To manipulate a feasible relationship of the vessel intensity <strong>and</strong>edge orientation <strong>betw<strong>ee</strong>n</strong> the US <strong>and</strong> <strong>CT</strong> images of the liver for <strong>registration</strong> (refer tosubsection 2.1), an objective function previously introduced by the authors is adopted.This function was developed for CCD <strong>and</strong> IR image <strong>registration</strong> (Kim et al 2008). As therelationship <strong>betw<strong>ee</strong>n</strong> those multimodal images is similar to that <strong>betw<strong>ee</strong>n</strong> US <strong>and</strong> <strong>CT</strong> images
<strong>Non</strong>-<strong>rigid</strong> <strong>registration</strong> <strong>betw<strong>ee</strong>n</strong> <strong>3D</strong> <strong>ultrasound</strong> <strong>and</strong> <strong>CT</strong> images of the liver 127in the liver, the adopted objective function utilizing both the intensity <strong>and</strong> edge orientationinformation is considered proper for a <strong>registration</strong> <strong>betw<strong>ee</strong>n</strong> the US <strong>and</strong> <strong>CT</strong> images of the liver.To obtain the objective function, we first construct a <strong>3D</strong> joint histogram, h(a,b,o(θ)).Here, a <strong>and</strong> b denote the intensity values of images A <strong>and</strong> B, respectively, <strong>and</strong> o(θ) denotesthe orientation coincidence of the two images. This is represented aso(θ) = 1 + cos(2θ) , (7)2where θ is the difference <strong>betw<strong>ee</strong>n</strong> the edge orientation angles in images A <strong>and</strong> B. Theobjective function F is then defined asF(A,B) = W(A,B)· E(A,B). (8)Here, the entropy term E is determined asE(A,B) = H(A,B,O)− M(A,B), (9)where M(A,B) represents the mutual information <strong>and</strong> H(A,B,O) is the <strong>3D</strong> joint entropycalculated from this <strong>3D</strong> joint histogram. The weighting term is determined asW(A,B) = 1 − C(A,B), (10)where the coincidence measure C is given as∑x∈(RC(A,B) =A ∩R B ) 2 · o (θ x). (11)N A + N BHere, R A <strong>and</strong> R B denote the edge regions which are obtained by using equation (6) in imagesA <strong>and</strong> B, respectively, <strong>and</strong> N A <strong>and</strong> N B denote the numbers of voxels in R A <strong>and</strong> R B , respectively.The weighting term W represents the disagr<strong>ee</strong>ment in the orientation. When two images arecorrectly registered, it is expected that W is minimized.Based on equations (7)–(11), the objective function regarding the vessels can be writtenasF vessel (I US ,I <strong>CT</strong> ′ ) = W(I US,I <strong>CT</strong> ′ ) · E(I US,I <strong>CT</strong> ′ ⎧ ∑) ⎫⎪⎨(1 + cos(2θ x ) ⎪⎬=⎪⎩ 1 −x∈(R US V ∩R <strong>CT</strong> V )N US + N <strong>CT</strong> ⎪ ⎭·{H(I US ,I <strong>CT</strong> ′ ,O)− M(I US,I <strong>CT</strong> ′ )}, (12)where I US <strong>and</strong> I ′ <strong>CT</strong> denote the US <strong>and</strong> deformed <strong>CT</strong> images, respectively, R US_V <strong>and</strong> R <strong>CT</strong>_Vdenote the regions corresponding to the vessel edges in the two vessel masks M US_V <strong>and</strong>M ′ <strong>CT</strong>_V of I US <strong>and</strong> I ′ <strong>CT</strong>, respectively, <strong>and</strong> N US <strong>and</strong> N <strong>CT</strong> denote the numbers of pixels in R US_V<strong>and</strong> R <strong>CT</strong>_V , respectively. While the weighting term W is determined in the overlapping regionof R US_V <strong>and</strong> R <strong>CT</strong>_V , the entropy term E is determined only for the overlapping region of M US_V<strong>and</strong> M ′ <strong>CT</strong>_V of I US <strong>and</strong> I ′ <strong>CT</strong>, respectively.Cost. We now define a cost function that provides the minimum value when two images arecorrectly registered:CF vessel = F vessel + λ vessel · F constraint . (13)As a constraint function, F constraint , we adopt an incompressibility constraint (Rohlfing <strong>and</strong>Maurer 2003) which is used for regularization in the non-<strong>rigid</strong> <strong>registration</strong> of the liver images(Rohlfing et al 2004). The constraint function is expressed asF constraint = 1 ∑|log (J T (x))|, (14)N Dx∈D
128 DL<strong>ee</strong>et alwhere D denotes the entire region of a US image, N D is the number of voxels in D <strong>and</strong> J Tdenotes the Jacobian determinant. To find the minimum value of the cost function whichprovides the optimized transformation parameters, the gradient descent scheme (Rueckertet al 1999) is adopted in this paper.2.4.3. Transformation estimation. Although the transformation T reg_vessel is determined forthe entire region of a US image, the transformation is accurate <strong>and</strong> reliable only in the vesselregions since the vessel information is used for <strong>registration</strong>. Hence, it is not sufficient to usethis as the initial transformation of the subsequent surface <strong>registration</strong> procedure. To obtaina better initial transformation, we re-estimate the transformation on the basis of a thin-platespline (TPS) model because this model tends to provide a smoothly varying transformationamong control points (Hajnal et al 2001).To use the TPS model, we choose sample points p in the US image that are mapped tovoxels p ′ in the pre-segmented vessels of the <strong>CT</strong> image. We regard p <strong>and</strong> p ′ as correspondingcontrol point pairs. The transformation based on a TPS is then given asn∑T est vessel (x) = A · x + {b i φ (|p i − x|)}, (15)i=1where A denotes the affine matrix, b i denotes the non-affine coefficients, φ represents a radialbasis function <strong>and</strong> n is the number of vessel point correspondences. Here, A <strong>and</strong> b i aredetermined using the corresponding pairs p <strong>and</strong> p ′ . The transformation T est_vessel is consideredas a refined version of T reg_vessel . It is a good initial transformation for further refinement.2.5. Registration based on surface informationAlthough at this point we have obtained the transformation T est_vessel , its level of accuracy isnot satisfactory because it relies only on the vessel information. To improve the <strong>registration</strong>accuracy, we use the liver surface as additional useful information because it is clearlyidentifiable in both US <strong>and</strong> <strong>CT</strong> images of the liver. To improve the accuracy further, wealso adopt the GB surface which is attached to the liver as additional surface information.2.5.1. Manipulation of the liver surface. Based on the liver surface relationship <strong>betw<strong>ee</strong>n</strong>US <strong>and</strong> <strong>CT</strong> images as described in subsection 2.1, we define an objective function for the<strong>registration</strong> in the liver surface region. While the objective function in the vessel region,F vessel , is determined using the intensity values <strong>and</strong> edge orientations from both the US <strong>and</strong>the <strong>CT</strong> images, this function in the liver surface region, F liver_surface , is determined using thegradient magnitudes instead of the intensity values in the <strong>CT</strong> image:F liver surface (I US ,I <strong>CT</strong> ′ ) = W(I US,I <strong>CT</strong> ′ ) · E(I US, ∣ ∣ ∇I′ ∣)⎧<strong>CT</strong>∑⎫⎪⎨(1 + cos(2θ x ) ⎪⎬=⎪⎩ 1 −x∈(R US LS ∩R <strong>CT</strong> LS )N US + N <strong>CT</strong> ⎪ ⎭·{H(I US , |∇I <strong>CT</strong> ′ |,O)− M(I US, |∇I <strong>CT</strong> ′ |)}. (16)Here, R US_LS <strong>and</strong> R <strong>CT</strong>_LS denote the edge regions in the two liver surface masks M US_LS <strong>and</strong>M ′ <strong>CT</strong>_LS of I US <strong>and</strong> I ′ <strong>CT</strong>, respectively, <strong>and</strong> |∇I ′ <strong>CT</strong>| denotes the gradient magnitude of the imageI ′ <strong>CT</strong>. As expressed by equation (12), the entropy term E is determined only for the overlappingregion of M US_LS <strong>and</strong> M ′ <strong>CT</strong>_LS of I US <strong>and</strong> I ′ <strong>CT</strong>.
<strong>Non</strong>-<strong>rigid</strong> <strong>registration</strong> <strong>betw<strong>ee</strong>n</strong> <strong>3D</strong> <strong>ultrasound</strong> <strong>and</strong> <strong>CT</strong> images of the liver 129Figure 8. A US image <strong>and</strong> overlay of a mask for the liver surface on the US image. ‘A’ indicatesan unwanted high echogenic structure.According to equation (16), the objective function is calculated only within the overlappingmask region. To determine the mask of I US automatically, we first segment the liver surface byadopting an algorithm based on a Hessian matrix analysis (Nam et al 2008) <strong>and</strong> then exp<strong>and</strong>the surface with a certain margin. The segmentation of the liver surface is straightforwardfor the liver surface attached to the diaphragm, which is located far from the probe contactposition. However, the segmentation of the liver surface beneath the probe contact position isdifficult due to unwanted high echogenic structures coming from several sources, such as thefat layer of the abdominal wall (s<strong>ee</strong> layer A in figure 8). To solve this problem, we first removethe segment corresponding to the liver surface attached to the diaphragm with a distance largerthan a certain value (a value of 25 mm is heuristically obtained from our datasets) from theprobe contact position. We then select the surface located farthest from the probe contactposition from among the remaining segments. After segmenting the liver surface attached tothe diaphragm <strong>and</strong> the surface near the probe contact position, we generate a liver surfacemask M US_LS of the US image which includes the voxels within the region obtained by dilatingthe extracted surfaces, as demonstrated in figure 8.2.5.2. Manipulation of the GB surface. As the GB surface relationship <strong>betw<strong>ee</strong>n</strong> US <strong>and</strong> <strong>CT</strong>images is similar to that of the vessels, as described in subsection 2.1, we adopt the objectivefunction of the vessels as the objective function for the GB surface region:F GB surface (I US ,I <strong>CT</strong> ′ ) = W(I US,I <strong>CT</strong> ′ ) · E(I US,I <strong>CT</strong> ′ ⎧ ∑) ⎫⎪⎨(1 + cos(2θ x ) ⎪⎬=⎪⎩ 1 −x∈(R US GS ∩R <strong>CT</strong> GS )N US + N <strong>CT</strong> ⎪ ⎭·{H(I US ,I <strong>CT</strong> ′ ,O)− M(I US,I <strong>CT</strong> ′ )}. (17)Here, R US_GS <strong>and</strong> R <strong>CT</strong>_GS denote regions corresponding to GB edges in the two GB masksM US_GS <strong>and</strong> M ′ <strong>CT</strong>_GS of I US <strong>and</strong> I ′ <strong>CT</strong>, respectively. Note also that the entropy term Eis determined only for the overlapping region of M US_GS <strong>and</strong> M ′ <strong>CT</strong>_GS of I US <strong>and</strong> I ′ <strong>CT</strong>,respectively.As mentioned in subsection 2.3, the GB surface attached to the liver was by this pointobtained through the pre-processing step of the <strong>CT</strong> image. Hence, the corresponding maskcan be generated by exp<strong>and</strong>ing the GB surface. Meanwhile, the GB surface mask of the USimage can be determined using the same scheme used for the US liver surface mask.
130 DL<strong>ee</strong>et al2.5.3. Application of the surface information to the <strong>registration</strong>. Basedontheaboveobjective functions for the surface information, non-<strong>rigid</strong> <strong>registration</strong> is performed toalign those surfaces. This non-<strong>rigid</strong> <strong>registration</strong> process is nearly identical to that insubsection 2.4.2. We define the two cost functions for the liver surface <strong>and</strong> the GB surface asfollows:CF liver surface = F liver surface + λ liver surface · F constraint , (18)CF GB surface = F GB surface + λ GB surface · F constraint . (19)To obtain the optimal transformation, it may be necessary to minimize the two costssimultaneously. However, instead of doing this, the transformation can be obtained byalternately minimizing the two costs. The degr<strong>ee</strong> of local deformation of the surfaces, whichshould be offset in the non-<strong>rigid</strong> <strong>registration</strong> process, depends on the initial transformation.Moreover, this degr<strong>ee</strong> can differ depending on the surface. Hence, alternate minimizationof the two costs is considered more efficient for obtaining the desired transformation, as itallows more DOF in the deformation of each surface in the <strong>registration</strong> with B-spline FFDtransformation. We also use a gradient descent optimization scheme for minimization, as inthe vessel-based <strong>registration</strong>.2.6. Final estimation of the transformationThrough the <strong>registration</strong> processes based on the vessel <strong>and</strong> surface information, we can achieveaccurate correspondences of the vessels, liver surface <strong>and</strong> GB surface attached to the liver<strong>betw<strong>ee</strong>n</strong> US <strong>and</strong> <strong>CT</strong> images. As in the vessel case in subsection 2.4.3, pairs of correspondingpoints on the surfaces can also be obtained simply by choosing the sample points in the USimage that are mapped to voxels of the pre-segmented <strong>CT</strong> image surfaces. Using those pairson vessels <strong>and</strong> surfaces, we attempt to estimate the final transformation <strong>betw<strong>ee</strong>n</strong> the US <strong>and</strong><strong>CT</strong> images for the whole liver. The final transformation T est_v&s is determined by referring toequation (15).3. Experiments3.1. Data acquisition <strong>and</strong> experimental conditionsTo evaluate the performance of the proposed algorithm, we use ten datasets obtained fromvolunt<strong>ee</strong>rs. The study protocol was approved by the Institutional Review Board of SeoulNational University Hospital, <strong>and</strong> written informed consent was obtained from each volunt<strong>ee</strong>r.For evaluation of lesion <strong>registration</strong> performance, we use five datasets that include clearlyvisible lesion(s) in both US <strong>and</strong> <strong>CT</strong> images so that it (they) can be segmented in both images.In each dataset, contrast-enhanced <strong>3D</strong> <strong>CT</strong> images were acquired at the end-inspirationwith a breath-hold using a Siemens Sensation 16 <strong>CT</strong> scanner. The typical image dimension <strong>and</strong>voxel size in these images were 512 × 512 × 220 <strong>and</strong> 0.65 × 0.65 × 1.0 mm 3 , respectively,although there were slight variations. <strong>3D</strong> B-mode US images were also acquired using aMedison Accuvix V10 <strong>ultrasound</strong> scanner equipped with a mechanical <strong>3D</strong> US probe. Atypical image dimension is 200 × 124 × 148 in the Cartesian coordinates with an isotropicvoxel size of 1.82 mm 3 . For the experiment, we acquired <strong>3D</strong> US images at the respiratoryphase of close-expiration with a breath-hold. This point is clearly distinct from the respiratoryphase in the <strong>CT</strong> images.To extract the gradient information, the value of Th 2 was empirically set to 10 in all of theUS images. Meanwhile, in the <strong>CT</strong> images, the value of Th 2 was set to 100, which is common
<strong>Non</strong>-<strong>rigid</strong> <strong>registration</strong> <strong>betw<strong>ee</strong>n</strong> <strong>3D</strong> <strong>ultrasound</strong> <strong>and</strong> <strong>CT</strong> images of the liver 131Table 1. Registration accuracy test for ten clinical datasets.Value: mean (±STD) (mm)Rigid (vessels) <strong>Non</strong>-<strong>rigid</strong> (vessels) <strong>Non</strong>-<strong>rigid</strong> (vessels <strong>and</strong> surfaces)Average Vessels Surface Average Vessels Surface Average Vessels Surfaces4.95 (2.26) 3.78 (0.72) 5.67 (2.60) 3.81 (2.47) 1.88 (0.27) 5.02 (2.48) 1.78 (0.37) 1.90 (0.25) 1.71 (0.43)for vessel <strong>and</strong> GB surface regions. It was set to 500 for the liver surface regions. Those valuesof Th 2 were determined to be low enough to extract the desired gradient information withintheir masks. The <strong>3D</strong> joint histograms used to calculate the entropy values of the objectivefunctions were generated with 32 × 32 × 32 bins, as in a recent study (Kim et al 2008). TheB-spline FFD transformation was defined by using a 13 × 9 × 10 mesh of control points withuniform spacing of 20 voxels for the US image. The weighting values of λ vessel , λ liver_surface<strong>and</strong> λ GB_surface were also empirically set to 10, 50 <strong>and</strong> 50, respectively, for all datasets.3.2. Experimental resultsFigures 9 <strong>and</strong> 10 show the <strong>registration</strong> results <strong>betw<strong>ee</strong>n</strong> the <strong>3D</strong> US <strong>and</strong> <strong>CT</strong> images. For a simplevisual assessment of the <strong>registration</strong> accuracy, we indicate the corresponding locations withseveral pairs of arrows in both images. The top-left image in each figure is a US image, thetop-right image is the <strong>rigid</strong>ly registered <strong>CT</strong> image, the bottom-left image is an intermediateresult obtained from the <strong>registration</strong> based on the vessel information <strong>and</strong> the bottom-rightimage is the final result of the proposed algorithm. The figures demonstrate that accuratecorrespondences can be obtained in the liver surface region (<strong>and</strong> the GB surface region infigure 10) as well as in the vessel regions. A comparison of the top-right <strong>and</strong> bottom-leftimages verifies that local deformation in the vessel region can be properly compensated forby a non-<strong>rigid</strong> <strong>registration</strong>. The bottom-right images clearly demonstrate the improvement ofthe <strong>registration</strong> accuracy due to the additional use of the surface information.For the quantitative evaluation of the proposed <strong>registration</strong> algorithm, we adopt a distancebasedmeasure on the basis of the anatomical features of the vessels, the liver surface <strong>and</strong> theGB surface. The distance measure for a pair of US <strong>and</strong> <strong>CT</strong> images can be written as follows:DM = 1 ∑minN {d (T est v&s(x US ), x <strong>CT</strong> )}. (20)A x <strong>CT</strong> ∈Bx US ∈AHere, A <strong>and</strong> B denote the set of feature samples in the US <strong>and</strong> <strong>CT</strong> images, respectively. N Ais the number of samples in A, <strong>and</strong> d(·) denotes a function representing the distance <strong>betw<strong>ee</strong>n</strong>the two input points. Set A (or B) consists of vessel centerlines, liver surface <strong>and</strong> GB surfacein the US image (or the <strong>CT</strong> image). Set A for the US image is mainly extracted on the basisof the feature extraction algorithm (Nam et al 2008). Some manual segmentation tasks areperformed for refinement of those features. Meanwhile, set B for the <strong>CT</strong> image is determinedby using the segmentation method that is described in subsection 2.3. To extract the vesselcenterlines in the <strong>CT</strong> image, we apply Bitter’s skeletonization method to the segmented vessels(Bitter et al 2001). Table 1 shows the averaged DM <strong>and</strong> its st<strong>and</strong>ard deviation (STD) for theclinical datasets. In the table, to verify the improvement of the <strong>registration</strong> accuracy ofthe proposed algorithm, we represent quantitative errors for <strong>rigid</strong> <strong>registration</strong> using vessels(subsection 2.4.1), for non-<strong>rigid</strong> <strong>registration</strong> using vessels (subsection 2.4.3) <strong>and</strong> for theproposed <strong>registration</strong> using both vessels <strong>and</strong> the surface information (subsection 2.6). It isclear that the overall DM for both regions of vessels <strong>and</strong> the surface is less than 2 mm, evenwith greatly different respiratory phases <strong>betw<strong>ee</strong>n</strong> the US <strong>and</strong> <strong>CT</strong> images. The DM for surface
132 DL<strong>ee</strong>et alUSRigid(vessels)<strong>Non</strong>-<strong>rigid</strong>(vessels)(a)<strong>Non</strong>-<strong>rigid</strong>(vessels + surface)USRigid(vessels)<strong>Non</strong>-<strong>rigid</strong>(vessels)(b)<strong>Non</strong>-<strong>rigid</strong>(vessels + surface)Figure 9. Comparison of vessel-based <strong>rigid</strong>, vessel-based non-<strong>rigid</strong> <strong>and</strong> vessel <strong>and</strong> surface-basednon-<strong>rigid</strong> <strong>registration</strong> results. The arrows show several typical positions for comparison. (a) Axialslice, (b) sagittal slice.regions decreases significantly after being processed by the proposed <strong>registration</strong> algorithm.This shows that the algorithm can be helpful in improving the <strong>registration</strong> accuracy of a targetlesion even when the lesion is located far from any vessels but near the surface.We also measured the fiducial <strong>registration</strong> error (FRE) by defining it as the rootmean-squareof the distances <strong>betw<strong>ee</strong>n</strong> corresponding fiducial points. The fiducial pointcorrespondences in the liver were selected on vessel bifurcations by an expert. For eachdataset, four to six point correspondences were obtained for the FRE measurement. Table 2
<strong>Non</strong>-<strong>rigid</strong> <strong>registration</strong> <strong>betw<strong>ee</strong>n</strong> <strong>3D</strong> <strong>ultrasound</strong> <strong>and</strong> <strong>CT</strong> images of the liver 133USRigid(vessels)<strong>Non</strong>-<strong>rigid</strong>(vessels)<strong>Non</strong>-<strong>rigid</strong>(vessels + surface)Figure 10. Comparison of vessel-based <strong>rigid</strong>, vessel-based non-<strong>rigid</strong> <strong>and</strong> vessel- <strong>and</strong> surface-basednon-<strong>rigid</strong> <strong>registration</strong> results. The white arrow shows the GB surface attached to the liver in theUS image; the black arrows are located at the position of the white arrow in each registered image.Table 2. Fiducial <strong>registration</strong> error for the datasets in table 1.Value: mean (±STD) (mm)Rigid (vessels) <strong>Non</strong>-<strong>rigid</strong> (vessels) <strong>Non</strong>-<strong>rigid</strong> (vessels <strong>and</strong> surfaces)4.80 (2.62) 2.43 (1.13) 2.39 (1.06)shows the averaged FRE <strong>and</strong> its st<strong>and</strong>ard deviation for the ten clinical datasets. In the table,after the non-<strong>rigid</strong> <strong>registration</strong> process, the FRE decreases significantly.As mentioned earlier, lesions are visible both in the US <strong>and</strong> <strong>CT</strong> images in the five datasets.To evaluate the <strong>registration</strong> accuracy of lesions, they were manually segmented <strong>and</strong> delineatedin both images by an expert via a software tool. We then measured the distance <strong>betw<strong>ee</strong>n</strong>the centers (DC) of a pair of corresponding lesions, US L <strong>and</strong> <strong>CT</strong> ′ L, in the US <strong>and</strong> registered<strong>CT</strong> images. In addition, to observe the degr<strong>ee</strong> of overlap <strong>betw<strong>ee</strong>n</strong> the lesions in the US <strong>and</strong>registered <strong>CT</strong> images, we adopted an overlap measure (OM) (Camara et al 2007). This isdefined as follows:n(US L ∩ <strong>CT</strong> ′ L)OM =× 100. (21)min {n(US L ), n(<strong>CT</strong> ′ L)}As the volume of a segmented lesion can vary depending on the imaging modality <strong>and</strong> onimaging conditions such as the degr<strong>ee</strong> of the diffusion of the contrast agent in the <strong>CT</strong> case, theUS L <strong>and</strong> <strong>CT</strong> ′ L volumes can differ from each other despite the fact that they originate from thesame lesion. Therefore, the minimum value <strong>betw<strong>ee</strong>n</strong> the US L <strong>and</strong> <strong>CT</strong> ′ L volumes is used as thedenominator in equation (21).Table 3 shows the DC <strong>and</strong> OM values for the five datasets. In datasets C <strong>and</strong> E, twolesions are identified in each case, while one lesion is identified in the remaining datasetsA, B <strong>and</strong> D. Hence, seven lesions are evaluated in total to quantitatively examine the lesion<strong>registration</strong> error. As shown in the table, the average DC value is 2.84 mm <strong>and</strong> the DC values
134 DL<strong>ee</strong>et alTable 3. Accuracy test of lesion <strong>registration</strong> for five patient datasets.Rigid(vessels)<strong>Non</strong>-<strong>rigid</strong>(vessels)<strong>Non</strong>-<strong>rigid</strong>(vessels <strong>and</strong>surfaces)Lesion type DC OM DC OM DC OMPatient (diameter (mm)) (mm) (%) (mm) (%) (mm) (%)A Hemangioma (10.3) 3.42 68 0.52 100 0.47 100B Hemangioma (23.2) 10.50 62 4.52 95 4.48 94C Cyst_1 (12.2) 4.25 71 1.21 99 1.36 99Cyst_2 (22.7) 5.08 81 4.54 88 2.75 90D Cyst (18.3) 12.40 20 2.56 87 3.31 86E Cyst_1 (6.2) 6.44 0 6.43 10 3.86 88Cyst_2 (18.9) 7.85 59 5.25 86 3.62 90Average 7.13 52 3.58 81 2.84 92range from 0.47 to 4.48 mm, which are considered to be acceptable for image-guided liverintervention (Lange et al 2004). Additionally, in cyst_2 in C <strong>and</strong> in both cysts in E, the use ofthe surface information improves the <strong>registration</strong> accuracy. Meanwhile, it is noted in cyst_1in C <strong>and</strong> in the cyst in D, the DC values of the proposed algorithm show a slight increasecompared to those of the non-<strong>rigid</strong> <strong>registration</strong> process based on the vessels. However, it isconsidered that the accuracy of lesion <strong>registration</strong> is not degraded in the proposed algorithm,as the OM values are mostly preserved. Among the datasets, we select the <strong>registration</strong>results for datasets C <strong>and</strong> E that include two identifiable lesions. These are shown infigure 11. In this figure, the white contours of lesions of a US image are superimposedonto the registered <strong>CT</strong> image. These contours help to illustrate that the proposed algorithmprovides very good <strong>registration</strong> accuracy for lesions <strong>and</strong> for the anatomical features of thevessels <strong>and</strong> the surface.Based on the quantitative evaluations above, the proposed algorithm is shown to provideaccurate non-<strong>rigid</strong> <strong>registration</strong> results. These accurate results stem from the efficientmanipulation of the anatomical information in the non-<strong>rigid</strong> <strong>registration</strong> framework. Asthe proposed <strong>registration</strong> algorithm can offset local deformation of the liver due to the USprobe pressure <strong>and</strong>/or due to the different respiration phases <strong>betw<strong>ee</strong>n</strong> US <strong>and</strong> <strong>CT</strong> images, w<strong>ee</strong>xpect that the algorithm can be applied to a range of clinical areas in which high <strong>registration</strong>accuracy is required, such as liver surgery. The proposed algorithm can provide new clinicalsolutions pertaining to image-guided diagnoses <strong>and</strong> intervention strategies.To obtain the final registered <strong>CT</strong> image in our experiments, user interaction was notrequired except for anatomical feature segmentation in the <strong>CT</strong> preprocessing step which canbe considered a preoperative procedure. Hence, the proposed algorithm is fully automatic in theintraoperative procedure. For real-time intraoperative applications, however, the computationtime of the algorithm is a bottleneck, since two main non-<strong>rigid</strong> <strong>registration</strong> steps in figure 4requires several hours of execution time on a st<strong>and</strong>ard PC. The acceleration of computationtime is required as future work for real-time applications.An application example of the proposed algorithm is a real-time concurrent displaysystem for <strong>3D</strong> US <strong>and</strong> <strong>CT</strong> images. In such a system, multiple-respiratory-phase <strong>CT</strong> imagesare obtained through the non-<strong>rigid</strong> <strong>registration</strong> of a pre-scanned single-respiratory-phase <strong>CT</strong>image to real-time multiple-respiratory-phase US images. This display would be very usefulfor image-guided intervention involving the liver. Given that computation time of the <strong>3D</strong>
<strong>Non</strong>-<strong>rigid</strong> <strong>registration</strong> <strong>betw<strong>ee</strong>n</strong> <strong>3D</strong> <strong>ultrasound</strong> <strong>and</strong> <strong>CT</strong> images of the liver 135USRigid(vessels)<strong>Non</strong>-<strong>rigid</strong>(vessels)<strong>Non</strong>-<strong>rigid</strong>(vessels + surface)(a)USRigid(vessels)<strong>Non</strong>-<strong>rigid</strong>(vessels)(b)<strong>Non</strong>-<strong>rigid</strong>(vessels + surface)Figure 11. Registration results for two patient datasets. From the top left, a B-mode US slice <strong>and</strong>its registered <strong>CT</strong> slices are shown. The superimpositions of the contours of the lesions extractedfrom the US slice are depicted for (a) patient C <strong>and</strong> (b) patient E in table 3.non-<strong>rigid</strong> <strong>registration</strong> process is too slow for real-time execution, however, it is necessaryto improve the computation time or to consider a system consisting of a preoperative stagerequiring a high computational load <strong>and</strong> an intraoperative stage requiring a low computationalload (Blackall et al 2005, Huang et al 2009). These approaches using the proposed algorithmare left for future work.4. ConclusionsAn accurate <strong>registration</strong> algorithm for the <strong>3D</strong> B-mode US <strong>and</strong> <strong>CT</strong> images of the liver ispresented in this paper. For accurate <strong>registration</strong>, we utilize the anatomical features of the
136 DL<strong>ee</strong>et alliver surface <strong>and</strong> the GB surface in addition to that of the vessels. To correlate the US <strong>and</strong> <strong>CT</strong>images in the regions corresponding to these anatomical features, the intensity information<strong>and</strong> the gradient information, including the magnitude <strong>and</strong> orientation, are incorporated intoa cost function using a previous <strong>3D</strong>-joint-histogram-based objective function proposed bythe authors. To obtain intermediate parametric transformations, the <strong>registration</strong> algorithmproposed here sequentially performs vessel-based <strong>and</strong> surface-based <strong>registration</strong> processeson the basis of the corresponding cost functions. The algorithm then estimates the finaltransformation based on the obtained parametric transformations. Through quantitativ<strong>ee</strong>valuations, the proposed algorithm was demonstrated to be capable of providing <strong>registration</strong>results which are meaningful for clinical applications such as image-guided surgery <strong>and</strong>intervention. It should be emphasized that the proposed algorithm can accurately register a <strong>3D</strong><strong>CT</strong> image to a US image regardless of local deformation which can occur due to the differentrespiratory phases <strong>betw<strong>ee</strong>n</strong> the two images <strong>and</strong> due to the pressure from the US probe whenapplied to the contact area of the patient.AcknowledgmentsThe authors would like to thank Medison Co. Ltd for the financial support of this work.Thanks also to Professor B I Choi in the Department of Radiology, Seoul National UniversityHospital, <strong>and</strong> to D G Hyun in Medison R&D for the helpful discussions, collaboration, <strong>and</strong>for their involvement with the data acquisition stages of this study.ReferencesAdams R <strong>and</strong> Bischof L 1994 S<strong>ee</strong>ded region growing IEEE Trans. Pattern Anal. Mach. Intell. 16 641–7Bitter I, Kaufman A E <strong>and</strong> Sato M 2001 Penalized-distance volumetric skeleton algorithm IEEE Trans. Vis. Comput.Graphics. 7 195–206Blackall J M, Penney G P, King A P <strong>and</strong> Hawkes D J 2005 Alignment of sparse fr<strong>ee</strong>h<strong>and</strong> 3-D <strong>ultrasound</strong> withpreoperative images of the liver using models of respiratory motion <strong>and</strong> deformation IEEE Trans. Med.Imaging 24 1405–16Br<strong>and</strong>ner E D, Wu A, Chen H, Heron D, Kalnicki S, Kom<strong>and</strong>uri K, Gerszten K, Burton S, Ahmed I <strong>and</strong> Shou Z 2006Abdominal organ motion measured using 4D <strong>CT</strong> Int. J. Radiat. Oncol. Biol. Phys. 65 554–60Brendel B, Winter S, Rick A, Stockheim M <strong>and</strong> Ermert H 2002 Registration of <strong>3D</strong> <strong>CT</strong> <strong>and</strong> <strong>ultrasound</strong> datasets of thespine using bone structures Comput. Aided Surg. 7 146–55Camara O, Delso G, Colliot O, Moreno-Ingelmo A <strong>and</strong> Bloch I 2007 Explicit incorporation of prior anatomicalinformation into a non<strong>rigid</strong> <strong>registration</strong> of thoracic <strong>and</strong> abdominal <strong>CT</strong> <strong>and</strong> 18-FDG whole-body emission PETimages IEEE Trans. Med. Imaging 26 164–78Castro-Pareja C R, Zagrodsky V, Bouchet L <strong>and</strong> Shekhar R 2005 Automated prostate localization in external-beamradiotherapy using mutual information-based <strong>registration</strong> of treatment planning <strong>CT</strong> <strong>and</strong> daily <strong>3D</strong> <strong>ultrasound</strong>images Int. Congr. Ser. 1281 435–40Haber E <strong>and</strong> Modersitzki J 2006 Intensity gradient based <strong>registration</strong> <strong>and</strong> fusion of multi-modal images MedicalImage Computing <strong>and</strong> Computer-Assisted Interventation—MICCAI 2006 (Copenhagen, Denmark, Oct. 2006)Hajnal J V, Hill D L G <strong>and</strong> Hawkes D J 2001 Medical Image Registration (Boca Raton, FL: CRC Press)Harris C <strong>and</strong> Stephens M 1988 A combined corner <strong>and</strong> edge detector Alvey Vision Conf. 1988 (Manchester, UK, Aug.1988)Huang X, Ren J, Guiraudon G, Boughner D <strong>and</strong> Peters T M 2009 Rapid dynamic image <strong>registration</strong> of the beatingheart for diagnosis <strong>and</strong> surgical navigation IEEE Trans. Med. Imaging 28 1802–13Kim Y S, L<strong>ee</strong> J H <strong>and</strong> Ra J B 2008 Multi-sensor image <strong>registration</strong> based on intensity <strong>and</strong> edge orientation informationPattern Recognit. 41 3356–65Krissian K, Kikinis R, Westin C F <strong>and</strong> Vosburgh K 2005 Speckle-constrained filtering of <strong>ultrasound</strong> images IEEEConf. on Computer Vision <strong>and</strong> Pattern Recognition 2005 (San Diego, California, USA, June 2005)
<strong>Non</strong>-<strong>rigid</strong> <strong>registration</strong> <strong>betw<strong>ee</strong>n</strong> <strong>3D</strong> <strong>ultrasound</strong> <strong>and</strong> <strong>CT</strong> images of the liver 137Lange T, Eulenstein S, Hunerbein M, Lamecher H <strong>and</strong> Schlag P 2004 Augmenting intraoperative <strong>3D</strong> <strong>ultrasound</strong>with preoperative models for navigation in liver surgery Medical Image Computing <strong>and</strong> Computer-AssistedInterventation—MICCAI 2004 (Saint-Malo, France, Sept. 2004)Lange T, Papenberg N, Heldmann S, Modersitzki J, Fischer B, Lamecher H <strong>and</strong> Schlag P M 2009 <strong>3D</strong> <strong>ultrasound</strong>-<strong>CT</strong><strong>registration</strong> of the liver using combined l<strong>and</strong>mark-intensity information Int. J. CARS. 4 79–88L<strong>ee</strong> D, Nam Kim Y S, L<strong>ee</strong> J H <strong>and</strong> Ra J B 2008 <strong>Non</strong>-<strong>rigid</strong> <strong>registration</strong> of <strong>3D</strong> <strong>ultrasound</strong> <strong>and</strong> <strong>CT</strong> images in the liverusing intensity <strong>and</strong> gradient information Proc. CARS 2008 (Barcelona, Spain, June 2008)Mcgahan J P, Ryu J <strong>and</strong> Fogata M 2004 Ultrasound probe pressure as a source of error in prostate localization forexternal beam radiotherapy Int. J. Radiat. Oncol. Biol. Phys. 60 788–93Moore K L <strong>and</strong> Agur A M R 2007 Essential Clinical Anatomy 3rd edn (Baltimore, MD: Lippincott Williams <strong>and</strong>Wilkins)Nam W H, Kang D-G, L<strong>ee</strong> D <strong>and</strong> Ra J B 2008 Anatomical feature extraction in <strong>3D</strong> B-mode <strong>ultrasound</strong> liver imagesfor <strong>CT</strong>-<strong>ultrasound</strong> affine <strong>registration</strong> Proc. CARS 2008 (Barcelona, Spain, June 2008)Nam W H, Kang D-G, L<strong>ee</strong> D <strong>and</strong> Ra J B 2010 Robust <strong>registration</strong> of 3-D <strong>ultrasound</strong> <strong>and</strong> <strong>CT</strong> images of the liver forimage-guided intervention IEEE ISBI 2010 (Rotterdam, The Netherl<strong>and</strong>s, April 2010)Penney G P, Blackall J M, Hayashi D, Sabharwal T, Adam A <strong>and</strong> Hawkes D J 2001 Overview of an <strong>ultrasound</strong> to <strong>CT</strong>or MR <strong>registration</strong> system for use in thermal ablation of liver metastases Proc. Medical Image Underst<strong>and</strong>ing<strong>and</strong> Analysis 2001 (Birmingham, UK, July 2001)Penney G P, Blackall J M, Hamady M S, Sabharwal T, Adam A <strong>and</strong> Hawkes D J 2004 Registration of fr<strong>ee</strong>h<strong>and</strong> <strong>3D</strong><strong>ultrasound</strong> <strong>and</strong> magnetic resonance liver images Med. Image Anal. 8 81–94Roche A, Pennec X, Mal<strong>and</strong>ain G <strong>and</strong> Ayache N 2001 Rigid <strong>registration</strong> of 3-D <strong>ultrasound</strong> with MR images: a newapproach combining intensity <strong>and</strong> gradient information IEEE Trans. Med. Imaging 20 1038–49Rohlfing T <strong>and</strong> Maurer C R 2003 Volume-preserving non<strong>rigid</strong> <strong>registration</strong> of MR breast images using fr<strong>ee</strong>-formdeformation with an incompressibility constraint IEEE Trans. Med. Imaging 22 730–41Rohlfing T, Maurer C R, O’Dell W <strong>and</strong> Zhong J 2004 Modeling liver motion <strong>and</strong> deformation during the respiratorycycle using intensity-based non<strong>rigid</strong> <strong>registration</strong> of gated MR images Med. Phys. 31 427–32Rueckert D, Sonoda L I, Hayes C, Hill D L G, Leach M O <strong>and</strong> Hawkes D J 1999 <strong>Non</strong><strong>rigid</strong> <strong>registration</strong> using fr<strong>ee</strong>-formdeformations: application to breast MR images IEEE Trans. Med. Imaging 18 712–21Shimizu S, Shirato H, Xo B, Kagei K, Nishioka T, Hashimoto S, Tsuchiya K, Aoyama H <strong>and</strong> Miyasaka K 1999Thr<strong>ee</strong>-dimensional movement of a liver tumor detected by high-sp<strong>ee</strong>d magnetic resonance imaging Radiother.Oncol. 50 367–70Tr<strong>ee</strong>cea G M, Pragera R W, G<strong>ee</strong>a A H <strong>and</strong> Berman L 2002 Correction of probe pressure artifacts in fr<strong>ee</strong>h<strong>and</strong> <strong>3D</strong><strong>ultrasound</strong> Med. Image Anal. 6 199–214Wein W, Brunke S, Khamene A, Callstrom M R <strong>and</strong> Navab N 2008 Automatic <strong>CT</strong>-<strong>ultrasound</strong> <strong>registration</strong> fordiagnostic imaging <strong>and</strong> image-guided intervention Med. Image Anal. 12 577–85Wein W, Kutter O, Aichert A, Zikic D, Kamen A <strong>and</strong> Navab N 2010 Automatic non-linear mapping of pre-procedure<strong>CT</strong> volumes to <strong>3D</strong> <strong>ultrasound</strong> IEEE ISBI 2010 (Rotterdam, The Netherl<strong>and</strong>s, April 2010)Xie Z <strong>and</strong> Farin G E 2001 Deformation with hierarchical B-splines Mathematical Methods for Curves <strong>and</strong> Surfaces(Nashville, TN: V<strong>and</strong>erbilt University) pp 545–54Zhang W, Noble J A <strong>and</strong> Brady J M 2006 Real time 3-D <strong>ultrasound</strong> to MR cardiovascular image <strong>registration</strong> using aphase-based approach IEEE ISBI 2006 (Arlington, Virginia, USA, April 2006)