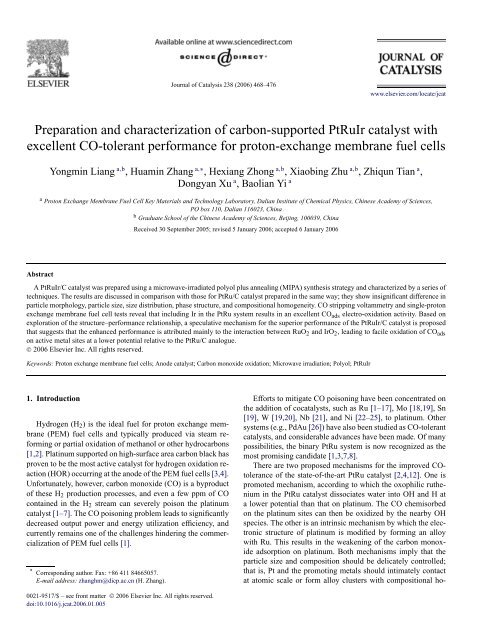
Preparation and characterization of carbon-supported PtRuIr ...
Preparation and characterization of carbon-supported PtRuIr ...
Preparation and characterization of carbon-supported PtRuIr ...

You also want an ePaper? Increase the reach of your titles
YUMPU automatically turns print PDFs into web optimized ePapers that Google loves.
470 Y. Liang et al. / Journal <strong>of</strong> Catalysis 238 (2006) 468–476slurry. Then 25 µl <strong>of</strong> the slurry was applied to the surface <strong>of</strong>the vitreous <strong>carbon</strong> electrode to form a thin layer about ca.0.196 cm 2 in geometric area. A saturated calomel electrode(SCE), which has a potential <strong>of</strong> 0.242 V versus the reversiblehydrogen electrode (RHE) <strong>and</strong> a large surface area platinumfoil, were used as the reference electrode (separated by an electrolytebridge) <strong>and</strong> the counter electrode, respectively. Beforeeach measurement, the solution was purged with high-puritynitrogen for 30 min. Pure CO was then bubbled for 30 minwith the potential held at −0.224 versus SCE to allow completeadsorption <strong>of</strong> CO onto the active catalytic sites. ThisCO adsorption potential is typical for application in a PEMfuel cell [21]. After each adsorption, CO remained in the solutionwas removed by bubbling high-purity nitrogen for 30 min.Two cyclic voltammetries were collected between −0.242 <strong>and</strong>0.96 V versus SCE with a scan rate <strong>of</strong> 20 mV/s. The first potentialsweep was conducted to electro-oxidize the irreversiblyadsorbed CO <strong>and</strong> the second sweep to verify the complete oxidation<strong>of</strong> the adsorbed species. All potentials throughout thispaper were referred to SCE. The amount <strong>of</strong> CO ads was estimatedby integration <strong>of</strong> the CO ads stripping peak, correctedfor the electric double-layer capacitance. The electrochemicallyactive surfaces <strong>of</strong> the catalysts were obtained as described previously[9] assuming a monolayer <strong>of</strong> linearly adsorbed CO <strong>and</strong>the charge density required for oxidation as 0.42 mC/cm 2 .The catalytic activity for HOR in the presence <strong>of</strong> 100 ppmCO <strong>of</strong> DICP <strong>PtRuIr</strong>/C <strong>and</strong> DICP PtRu/C were evaluated asthe single PEM fuel cell anode catalysts <strong>and</strong> compared withthat for the E-TEK PtRu/C catalyst. For all three anodes, thecatalyst powder (metal + <strong>carbon</strong> support) was maintained at∼1 mg/cm 2 to ensure the same thickness, <strong>and</strong> hence the sameelectric resistance, <strong>of</strong> the catalyst layers. The anode metalloadings were kept at ca. 0.4 mg/cm 2 . In all cases, the cathodesadopted the commercial 50 wt% Pt/C catalyst (JohnsonMatthey) with platinum loading <strong>of</strong> 0.37 mg/cm 2 , with Nafion112 (H + form, Du Pont) used as the membrane. Fabrication <strong>of</strong>the electrodes <strong>and</strong> membrane electrode assemblies (MEAs) followedthe process reported by Ticianelli et al. [17]. TheMEAshad an active area <strong>of</strong> 5 cm 2 . In all cases, oxygen instead <strong>of</strong> airwas used as the oxidant to minimize polarization at the cathode,thus making the difference <strong>of</strong> the anode catalysts moreapparent. The fuel gas (100 ppm CO/H 2 ) <strong>and</strong> oxygen were humidifiedat temperatures <strong>of</strong> 90 <strong>and</strong> 85 ◦ C, respectively, beforefeeding into the cells. The cells were operated at 80 ◦ C <strong>and</strong>0.2 MPa. The inlet <strong>and</strong> outlet gases <strong>of</strong> the anodes <strong>of</strong> the fuelcells were analyzed by gas chromatography (Shimadzu, GC-14A, FID), <strong>and</strong> mass balance calculation was carried out todetermine the conversion <strong>of</strong> <strong>carbon</strong> monoxide in the hydrogenrichstream to <strong>carbon</strong> dioxide.on particle size <strong>and</strong> size distribution. The typical bright-fieldTEM images <strong>of</strong> the DICP <strong>PtRuIr</strong>/C <strong>and</strong> DICP PtRu/C catalystsare shown in Figs. 1a <strong>and</strong> 1b, respectively. It can be seenthat the spherical metal particles <strong>of</strong> the two catalysts are uniformlydispersed on the <strong>carbon</strong> supports, with some aggregatesobserved in DICP PtRu/C. Figs. 2a <strong>and</strong> 2b show the histograms<strong>of</strong> the particle size distributions. The particle size for the DICP<strong>PtRuIr</strong>/C catalyst ranges between 1 <strong>and</strong> 5 nm, with a mean di-3. Results <strong>and</strong> discussionIt is well known that metal particle morphology, particlesize, <strong>and</strong> size distribution strongly affect catalyst properties[34]. With this in mind, we first carried out TEM examinationon the as-prepared DICP <strong>PtRuIr</strong>/C <strong>and</strong> DICP PtRu/Ccatalysts to study the effect <strong>of</strong> including Ir in the PtRu systemFig. 1. Bright-field TEM images <strong>of</strong> (a) DICP <strong>PtRuIr</strong>/C <strong>and</strong> (b) DICP PtRu/Ccatalysts.
Y. Liang et al. / Journal <strong>of</strong> Catalysis 238 (2006) 468–476 471ameter d m <strong>of</strong> 2.9 nm. For the DICP PtRu/C catalyst, the meanparticle diameter is 3.2 nm <strong>and</strong> the size distribution is 1–7 nm.The small particle size <strong>and</strong> the homogeneous size distribution<strong>of</strong> both catalysts are ascribed to the rapid reduction <strong>of</strong> the metalsalts <strong>and</strong> easy nucleation <strong>of</strong> the metal particles in ethylene glycolfacilitated by microwave irradiation [32,34,36,38]. Theincreaseddispersion <strong>of</strong> the DICP <strong>PtRuIr</strong>/C catalyst with respectto that <strong>of</strong> the DICP PtRu/C catalyst may be attributed to theenhanced agglomeration resistance associated with iridium oxides[39].Most researchers now agree that PtRu nanoparticles with anaverage diameter <strong>of</strong> 2–4 nm exhibit the best electrocatalytic activityfor application in PEM fuel cells [33,38,40]. Although itis not yet clear whether this size range is also an optimum valuefor the ternary <strong>PtRuIr</strong> nanocomposite, it is apparent that theaddition <strong>of</strong> iridium has a rather small effect on particle shape,particle size, <strong>and</strong> size distribution.ICP-AES was conducted to determine the bulk metal contentin the DICP <strong>PtRuIr</strong>/C <strong>and</strong> DICP PtRu/C catalysts. Theresults, presented in Table 1, show that the content <strong>of</strong> Pt <strong>and</strong>/orIr in both catalysts is relatively close to their nominal values;however, Ru content is comparatively lower than their nominalvalues. Two factors may be responsible for the low Ru contentin the two samples. Incineration treatment <strong>of</strong> the samples beforethe elemental analysis is performed may result in loss <strong>of</strong> volatileruthenium oxides. Moreover, the relatively weaker interaction<strong>of</strong> Ru 3+ compared with those for PtCl 6 2− <strong>and</strong> IrCl 6 2− , withthe surface groups <strong>of</strong> the support could contribute to less adsorption<strong>of</strong> Ru 3+ on the support <strong>and</strong> thus the low Ru content[11]. The Pt:Ru:Ir <strong>and</strong> Pt:Ru atomic ratios, as calculated fromthe measured contents, are 1.37:1:1.46 <strong>and</strong> 1.2:1, respectively.The on-particle EDS analysis was used to monitor the compositionalhomogeneity <strong>of</strong> individual particles. It should benoted that variation <strong>of</strong> the composition for the individual particlesis relatively small. The Pt:Ru:Ir <strong>and</strong> Pt:Ru atomic ratiosmeasured by EDS turn out to be 1.07:1:1.23, <strong>and</strong> 1.13:1, respectively,which are in good agreement with the bulk values.XRD analyses were performed to obtain structural information<strong>of</strong> the catalysts. Fig. 3 showstheXRDpatterns<strong>of</strong>theDICP<strong>PtRuIr</strong>/C <strong>and</strong> DICP PtRu/C catalysts. As it is shown in thefigure, both <strong>of</strong> the nanocomposites exhibit only characteristicdiffraction peaks (marked in the figure) <strong>of</strong> the fcc platinum [13,16,33]. No diffraction peaks, which would be attributed to pureruthenium <strong>and</strong> iridium or their oxides/hydroxides, appear inthe XRD patterns. The diffraction peaks <strong>of</strong> the DICP <strong>PtRuIr</strong>/Ccatalyst are found to shift positively with respect to those <strong>of</strong>the DICP PtRu/C analogue. The average crystallite sizes forthe DICP PtRu/C <strong>and</strong> DICP <strong>PtRuIr</strong>/C catalysts, calculated byScherrer’s formula [13,34], are 3.0 <strong>and</strong> 3.3 nm, respectively,which are very close to those obtained by TEM. Bragg’s equation[13] is used to obtain the lattice parameters <strong>of</strong> 3.834 Å forthe DICP <strong>PtRuIr</strong>/C catalyst <strong>and</strong> 3.886 Å for the DICP PtRu/Ccatalyst. A comparison with the values <strong>of</strong> 3.916 Å for <strong>carbon</strong><strong>supported</strong>platinum <strong>and</strong> 3.860 Å for bulk PtRu alloy may supportthe idea that the metals form alloy [3,13]. However, forthe moment, we would be cautious in drawing the conclusion<strong>of</strong> alloy formation in our ternary <strong>PtRuIr</strong>/C catalyst, because accordingto our experience, the small size <strong>and</strong> the support maycause distortion <strong>of</strong> the lattice planes, <strong>and</strong> obtaining direct pro<strong>of</strong>Fig. 2. Histograms <strong>of</strong> metal particles diameters for (a) DICP <strong>PtRuIr</strong>/C <strong>and</strong>(b) DICP PtRu/C catalysts.Table 1Metal content in DICP <strong>PtRuIr</strong>/C, DICP PtRu/C <strong>and</strong> DICP Ir/C catalystsCatalystsampleMetal nominalcontent a (wt%)Metal actualcontent b (wt%)Pt Ru Ir Pt Ru IrDICP <strong>PtRuIr</strong>/C 15.98 8.28 15.74 13.54 5.13 14.24DICP PtRu/C 26.3 13.7 – 24.02 10.41 –DICP Ir/C – – 40 – – 37.4a As calculated from metal content <strong>of</strong> 40 wt% <strong>and</strong> atomic ratio <strong>of</strong> 1:1:1 forPt:Ru:Ir or <strong>of</strong> 1:1 for Pt:Ru.b As determined from ICP-AES analyses.Fig. 3. Powder XRD patterns <strong>of</strong> DICP <strong>PtRuIr</strong>/C <strong>and</strong> DICP PtRu/C catalysts.
472 Y. Liang et al. / Journal <strong>of</strong> Catalysis 238 (2006) 468–476Fig. 4. (a) CO-stripping voltammograms <strong>of</strong> DICP <strong>PtRuIr</strong>/C, DICP PtRu/C <strong>and</strong>E-TEK PtRu/C catalysts in 0.5 M H 2 SO 4 at 25 ◦ C. (b) Voltammetry behavior<strong>of</strong> DICP <strong>PtRuIr</strong>/C <strong>and</strong> DICP PtRu/C catalysts at low potential region. Scanningrate: 20 mV/s.is very difficult for alloy formation even in binary catalysts.More intensive studies are needed to attain reliable conclusion.Some techniques, such as X-ray spectroscopy (XAS) <strong>and</strong>temperature-programmed reduction (TPR)/microcalorimetry <strong>of</strong>adsorbed CO, may be useful for this investigation [41,42].CO stripping voltammetry is commonly used to test the activity<strong>of</strong> a catalyst for electrochemically oxidizing adsorbed COon the catalyst. Fig. 4a shows the CO stripping voltammograms<strong>of</strong> the DICP <strong>PtRuIr</strong>/C, DICP PtRu/C, <strong>and</strong> E-TEK PtRu/C catalystsin 0.5 M H 2 SO 4 at 25 ◦ C after full adsorption <strong>of</strong> CO<strong>and</strong> subsequent purging <strong>of</strong> the solution with high-purity N 2 .The figure also shows the second sweeping voltammograms.It should be noted that, due to the different microstructures <strong>and</strong>macrostructures <strong>of</strong> various electrocatalysts related to the differentcompositions <strong>and</strong> the synthesis routes, the current in thecyclic voltammetry measurements is usually normalized by themetal loadings (viz., mA/mg metal ) to compare the catalytic activity<strong>of</strong> the different electrocatalysts [9]. Therefore, all <strong>of</strong> thecurrents in our CO stripping voltammetry measurements arenormalized per milligram <strong>of</strong> total metal.It can be seen in Fig. 4a that adsorbed CO has been oxidizedcompletely in a single scan, <strong>and</strong> no CO oxidation ismonitored during the second scan for all three catalysts. Thepeak potential for CO ads electro-oxidation on DICP <strong>PtRuIr</strong>/C,E-TEK PtRu/C, <strong>and</strong> DICP PtRu/C are 0.25, 0.31, <strong>and</strong> 0.45 Vversus SCE, respectively, indicating that addition <strong>of</strong> Ir in thePtRu system leads to an enhanced activity for CO ads oxidation,even higher than that for the commercial PtRu/C catalyst.Fig. 4b reveals the voltammetry behavior <strong>of</strong> DICP <strong>PtRuIr</strong>/C <strong>and</strong>DICP PtRu/C catalysts at low potential region, showing that theDICP <strong>PtRuIr</strong>/C catalyst exhibits a hydrogen oxidation peak inthe hydride region (−0.192 →−0.158 V vs. SCE) comparedwith DICP PtRu/C [38]. This is the result <strong>of</strong> hydrogen electrooxidationvia transient holes in the CO adlayer on metal activesites <strong>of</strong> DICP <strong>PtRuIr</strong>/C, implying the different surface structures<strong>of</strong> the two catalysts [43].Although normalization <strong>of</strong> the current by the metal loadingsfacilitates the comparison <strong>of</strong> the different catalysts <strong>and</strong> can representthe economic efficiency <strong>of</strong> the catalysts, the mass-currentdensity does not take into account the number <strong>of</strong> surface activemetal sites [9]. Usually, the electrochemically active surface(EAS) is used to reflect the intrinsic electrocatalytic activity,(i.e., the number <strong>of</strong> the active surface metal sites) <strong>of</strong> a catalyst[9]. The EAS <strong>of</strong> DICP <strong>PtRuIr</strong>/C, E-TEK PtRu/C, <strong>and</strong>DICP PtRu/C, calculated from the area <strong>of</strong> the correspondingelectrocatalytic oxidation peak for CO ads are 64.3, 49.2, <strong>and</strong>30.6 m 2 /g metal, respectively. These results further reveal thatDICP <strong>PtRuIr</strong>/C has very high CO ads electro-oxidation activity.It is interesting to note that DICP <strong>PtRuIr</strong>/C has not only a muchlower peak potential for CO ads oxidation, but also a higher EAScompared with those for DICP PtRu/C catalyst. Generally, theparticle size can affect the EAS <strong>of</strong> an electrocatalyst [9]. Asdemonstrated by TEM <strong>and</strong> XRD, however, the particle size <strong>and</strong>size distribution <strong>of</strong> the DICP <strong>PtRuIr</strong>/C <strong>and</strong> DICP PtRu/C catalystsare close. Although smaller particles <strong>of</strong> DICP <strong>PtRuIr</strong>/Ccatalyst can contribute to some extent to more active metal sitesfor CO ads electro-oxidation, we believe that such a small differencein particle size <strong>of</strong> the two catalysts should not produce asignificant difference in the number <strong>of</strong> active sites.Herein we suggest that this may be rationalized by recognizingtwo possibilities. One <strong>of</strong> these is that iridium may adsorbCO or that addition <strong>of</strong>, say, Ir in the PtRu system may increasethe active metal sites for CO adsorption <strong>and</strong> electro-oxidation.Bearing this in mind, we prepared 40% Ir/C in the same wayas for the DICP <strong>PtRuIr</strong>/C <strong>and</strong> DICP PtRu/C catalysts. The Ircontent <strong>of</strong> the DICP Ir/C catalyst is given in Table 1. Figs. 5a<strong>and</strong> 5b show the TEM image <strong>and</strong> the histogram <strong>of</strong> the particlesize distributions <strong>of</strong> DICP Ir/C catalyst, respectively. As itis shown in Fig. 5, the metal particles are uniformly dispersedon the support. The mean particle diameter is 3.0 nm <strong>and</strong> thesize ranges between 1 <strong>and</strong> 7 nm, which are close to those <strong>of</strong> theDICP <strong>PtRuIr</strong>/C <strong>and</strong> the DICP PtRu/C catalysts. Fig. 6 showsthe CO stripping voltammogram <strong>of</strong> DICP Ir/C catalyst. As canbe seen in Fig. 6, the peak potential <strong>of</strong> CO ads electro-oxidationfor DICP Ir/C catalyst is 0.66 V versus SCE, which is 410 mVhigher than that for DICP <strong>PtRuIr</strong>/C <strong>and</strong> 210 mV higher than thatfor DICP PtRu/C. Integration <strong>of</strong> the CO ads stripping peak givesa 40.4 m 2 /g metal <strong>of</strong> EAS. The EAS for the DICP <strong>PtRuIr</strong>/Ccatalyst approximates to the summation <strong>of</strong> the values <strong>of</strong> DICPPtRu/C <strong>and</strong> DICP Ir/C catalysts. This may support the abovementionedsupposition that inclusion <strong>of</strong> Ir in the PtRu systemcould increase the active metal sites for CO adsorption <strong>and</strong>electro-oxidation. The much lower peak potential for CO oxidationon DICP <strong>PtRuIr</strong>/C with respect to DICP PtRu/C <strong>and</strong>
Y. Liang et al. / Journal <strong>of</strong> Catalysis 238 (2006) 468–476 473Fig. 6. CO-stripping voltammogram <strong>of</strong> DICP Ir/C catalyst in 0.5 M H 2 SO 4 at25 ◦ C. Scanning rate: 20 mV/s.Fig. 7. PEM fuel cell polarization curves comparing DICP <strong>PtRuIr</strong>/C <strong>and</strong> DICPPtRu/C as the anode catalysts with the commercial E-TEK 40 wt% PtRu/Ccatalyst. Anode catalyst powder loading: 1 mg/cm 2 . Cathode: the commercialJohnson Matthey 50 wt% Pt/C catalyst with platinum loading <strong>of</strong> 0.37 mg/cm 2 .Cell temperature: 80 ◦ C. Fuel gas: 100 ppm CO/H 2 (0.2 MPa) , oxidant: O 2(0.2 MPa). The fuel gas <strong>and</strong> the oxidant are humidified at 90 <strong>and</strong> 85 ◦ C, respectively,before feeding into the cell. The MEAs have an active area <strong>of</strong> 5 cm 2 .Fig. 5. (a) Bright-field TEM image <strong>and</strong> (b) the histogram <strong>of</strong> metal particlesdiameters <strong>of</strong> DICP Ir/C catalyst.DICP Ir/C is attributed to the interaction between the specieson the catalyst surface (vide infra). Moreover, the low EAS <strong>of</strong>the DICP PtRu/C catalyst may also arise from the formation <strong>of</strong>an improper alloy [9].It is surprising that DICP PtRu/C catalyst, although preparedby the same way as that for DICP <strong>PtRuIr</strong>/C catalyst, exhibitsmuch lower activity for CO ads electro-oxidation. This could bepresumably ascribed to its surface structure associated with thenonoptimum synthesis conditions [9,13,41].Fig. 7 shows the polarization curves with all <strong>of</strong> the currentdensities normalized per cm 2 <strong>of</strong> active area <strong>of</strong> the MEAs. As indicatedin Fig. 7, the DICP <strong>PtRuIr</strong>/C catalyst outperforms boththe DICP PtRu/C catalyst <strong>and</strong> the E-TEK PtRu/C catalyst at allrecorded current densities. For example, at a current density <strong>of</strong>100 mA/cm 2 , the voltage for DICP <strong>PtRuIr</strong>/C is 0.864 V, whichis 50 mV higher that for DICP PtRu/C <strong>and</strong> 35 mV higher thanthat for E-TEK PtRu/C. The performance results <strong>of</strong> the catalystsin the single cells are in good agreement with those in COstripping voltammetry measurements.Analyses <strong>of</strong> inlet <strong>and</strong> outlet anode gases <strong>of</strong> the cells werecarried out by means <strong>of</strong> gas chromatography. Mass balancecalculations showed that ca. 70, 46, <strong>and</strong> 55% <strong>of</strong> <strong>carbon</strong> monoxidewere converted to <strong>carbon</strong> dioxide for the DICP <strong>PtRuIr</strong>/C,DICP PtRu/C <strong>and</strong> E-TEK PtRu/C catalysts, respectively, at100 mA/cm 2 , indicating that the promoted mechanism occurson these catalysts. The trend <strong>of</strong> the analyses appears to be thesame as those in the CO stripping voltammetry measurements<strong>and</strong> in the single-cell tests.To shed more light on the nature <strong>of</strong> excellent CO-tolerantperformance <strong>of</strong> our DICP <strong>PtRuIr</strong>/C nanocomposite (i.e., to underst<strong>and</strong>the factors causing the enhancement in CO ads electrooxidationactivity), we performed XPS analyses <strong>of</strong> DICP<strong>PtRuIr</strong>/C <strong>and</strong> DICP PtRu/C catalysts to determine the oxidationstates <strong>of</strong> the metals on the catalyst surface. It should benoted that the particle size <strong>of</strong> the two catalysts (∼3 nm) is inthe range <strong>of</strong> XPS scrutiny [17,23]. Because the Ru3d regionoverlays with the C1s region, the less-intense Ru3p region wasthus analyzed. The deconvolution <strong>of</strong> the Pt4f core-level regionwas carried out by referring to the literature sources [9,14,16,22–24,27,34,44], while the Ru3p <strong>and</strong> Ir4f regions are deconvo-
474 Y. Liang et al. / Journal <strong>of</strong> Catalysis 238 (2006) 468–476Fig. 9. XPS core level spectra for Pt 4f (a) <strong>and</strong> Ru3p 3/2 (b) photoemission fromDICP PtRu/C catalyst.Fig. 8. XPS core level spectra for Pt4f (a), Ru3p 3/2 (b) <strong>and</strong> Ir 4f (c) photoemissionfrom DICP <strong>PtRuIr</strong>/C catalyst.luted according to [9,10,14,16,23,24,27,44] <strong>and</strong> [27,38,44,45],respectively.Figs. 8a–8c show the XPS spectra for Pt4f, Ru3p 3/2 , <strong>and</strong>Ir4f core-level regions <strong>of</strong> the DICP <strong>PtRuIr</strong>/C catalyst. Deconvolution<strong>of</strong> the Pt4f region shows the presence <strong>of</strong> three pairs<strong>of</strong> doublets. The most intense doublet with binding energies <strong>of</strong>71.3 eV (Pt4f 7/2 ) <strong>and</strong> 74.5 eV (Pt4f 5/2 ) was attributed to metallicPt. Peaks at 72.2 <strong>and</strong> 75.6 eV could be assigned to Pt 2+ asin either PtO or Pt(OH) 2 . The third doublet found at 74.5 <strong>and</strong>77.3 eV appears to be Pt 4+ , possibly as PtO 2 ; 64.6% <strong>of</strong> theplatinum exists as metallic Pt, 20.3% exists as PtO or Pt(OH) 2 ,<strong>and</strong> 15.1% exists as PtO 2 . The Ru3p 3/2 spectrum was deconvolutedinto two peaks at 461.2 <strong>and</strong> 462.5 eV, which correspondto metallic Ru <strong>and</strong> RuO 2 ; 70.3% <strong>of</strong> the Ru exists as metallicRu, <strong>and</strong> 29.7% exists as RuO 2 . The most intense Ir4f peak <strong>of</strong>the DICP <strong>PtRuIr</strong>/C catalyst lies near the Pt4f satellites. Afterthese satellites were removed, a resolved signal was discerned.Deconvolution <strong>of</strong> the signal showed the presence <strong>of</strong> two doublets.Comparison <strong>of</strong> the observed binding energies with thosereported in the literature suggests that the two species are metallicIr <strong>and</strong> IrO 2 . The deconvolution results suggest that 89% <strong>of</strong>the iridium is present as the metal state <strong>and</strong> 11% is present asthe oxidized state.Figs. 9a–9b show the XPS spectra for Pt4f <strong>and</strong> Ru3p 3/2 regions<strong>of</strong> the DICP PtRu/C catalyst. Like those for the DICP<strong>PtRuIr</strong>/C catalyst, here the Pt4f signal is also deconvoluted intothree pairs <strong>of</strong> doublets attributed to metallic Pt, Pt 2+ , <strong>and</strong> PtO 2 .Platinum in the DICP PtRu/C catalyst is also predominantly inthe metallic state (69.8%). The PtO [or Pt(OH) 2 ] <strong>and</strong> PtO 2 accountfor 15.7 <strong>and</strong> 15.5%, respectively. The Ru3p 3/2 spectrumconsists <strong>of</strong> 84.6% metallic Ru <strong>and</strong> 15.4% RuO 2 .It is noteworthy that no chloride was detected by XPS forthe two catalysts. This finding indicates the complete removal<strong>of</strong> this detrimental species.Up to now, we have compared the as-prepared DICP<strong>PtRuIr</strong>/C <strong>and</strong> DICP PtRu/C catalysts in terms <strong>of</strong> metal particlemorphology, particle size, size distribution, compositional homogeneity,phase information <strong>and</strong> surface metal oxidation state,<strong>and</strong> other factors. It appears that the enhanced performance <strong>of</strong>the DICP <strong>PtRuIr</strong>/C catalyst should be ascribed mainly to theiridium additives.Previous studies have established that the IrO 2 has goodelectronic conductivity <strong>and</strong> high electrocatalytic activity toward
Y. Liang et al. / Journal <strong>of</strong> Catalysis 238 (2006) 468–476 475oxygen evolution in acid medium [27–30]. Our gas chromatographyanalysis has shown that much more <strong>carbon</strong> monoxide isoxidized on the DICP <strong>PtRuIr</strong>/C catalyst than on the two PtRu/Canalogues (vide ante). Therefore, we believe that iridium additives,at least IrO 2 , serve as cocatalysts for electro-oxidation<strong>of</strong> CO chemisorbed on Pt, hence releasing more active Pt sitesfor HOR. Contribution <strong>of</strong> metallic Ir to CO ads electro-oxidationshould not be ruled out for the moment, <strong>and</strong> more intensive investigationis needed.As mentioned above, the particle sizes <strong>of</strong> both the DICP<strong>PtRuIr</strong>/C <strong>and</strong> DICP PtRu/C catalysts are within the range <strong>of</strong>XPS scrutiny. Based on the relative concentrations <strong>of</strong> the surfacespecies <strong>and</strong> the bulk content <strong>of</strong> the metals (see Table 1) inthe two as-prepared catalysts, RuO 2 accounts for ca. 1.5% inDICP <strong>PtRuIr</strong>/C <strong>and</strong> 1.6% in DICP PtRu/C. It is interesting thatalthough RuO 2 has a higher activity for the oxygen evolutionreaction than IrO 2 [29] <strong>and</strong> the RuO 2 content is slightly higherin the DICP PtRu/C catalyst, it has a much lower activity forCO ads electro-oxidation than that <strong>of</strong> the DICP <strong>PtRuIr</strong>/C catalyst,as indicated by CO stripping voltammetry <strong>and</strong> single-cellmeasurements. The RuO 2 –IrO 2 interaction may play a beneficialrole <strong>and</strong> facilitate elimination <strong>of</strong> CO ads from the active Ptsites. Gasteiger et al. [15] demonstrated the ability <strong>of</strong> Ru surfaceatoms to provide nucleation sites for oxygen-containing species(e.g., hydroxyl group) at lower potentials than that for Pt. Kötz<strong>and</strong> Stucki [29] reported a higher affinity <strong>of</strong> oxygen for Ru thanthat for Ir.We suggest that the excellent performance <strong>of</strong> our DICP<strong>PtRuIr</strong>/C catalyst can be attributed to the facile electro-oxidation<strong>of</strong> CO ads promoted by iridium additives. It is supposed thatin our <strong>PtRuIr</strong> system, RuO 2 –IrO 2 interaction promotes the formation<strong>of</strong> hydroxyl species by dissociating water at a lowerpotential with respect to the PtRu system. Moreover, this interactioncould also weaken the bonding between the hydroxylspecies <strong>and</strong> the catalyst surface as compared with the bondingon PtRu nanoparticles. The more weakly adsorbed hydroxylspecies further promotes electro-oxidation <strong>of</strong> CO ads on the activemetal sites at a lower potential, thus improving the performance.Although this mechanism appears to be rather speculative,it may be <strong>of</strong> relevance in explaining the excellent catalyticactivity <strong>of</strong> our <strong>PtRuIr</strong>/C catalyst for HOR in the presence <strong>of</strong><strong>carbon</strong> monoxide.It has been established that the stability <strong>of</strong> RuO 2 in acidmedia is significantly improved by admixture <strong>of</strong> IrO 2 [29,30].Thus, the inclusion <strong>of</strong> Ir in the PtRu system may be advantageousto the long-term stability <strong>of</strong> PEM fuel cells. However,because the issue <strong>of</strong> electrocatalyst stability is critical <strong>and</strong> complicated[24], more intensive investigation is warranted.It should be noted that alloying with some other metals canmake platinum less reactive to <strong>carbon</strong> monoxide [3,6]; that is,the Pt–CO ads bond is weakened or CO ads coverage is reduced[42], as postulated by the intrinsic mechanism (vide ante). Theweakened Pt–CO ads bond can also contribute to the facilitation<strong>of</strong> CO ads oxidation. This may occur in our DICP <strong>PtRuIr</strong>/C catalyst.However, as discussed in XRD section, the formation <strong>of</strong>ternary alloy for the DICP <strong>PtRuIr</strong>/C catalyst is far from conclusiveat this stage; whether there is an intrinsic mechanism inthis catalyst merits detailed investigation.4. ConclusionIn summary, a <strong>carbon</strong>-<strong>supported</strong> <strong>PtRuIr</strong> catalyst was synthesizedvia the MIPA strategy. The <strong>PtRuIr</strong>/C catalyst displayedgreatly enhanced activity for CO ads electro-oxidation,even higher than that <strong>of</strong> the commercial E-TEK PtRu/C catalyst.Characterizations showed that the superior performance<strong>of</strong> the <strong>PtRuIr</strong>/C catalyst should result from the iridium additives,particularly IrO 2 . A speculative mechanism associatedwith the excellent performance <strong>of</strong> <strong>PtRuIr</strong>/C is proposed. It issupposed that the superior activity for CO ads electro-oxidation<strong>of</strong> the catalyst should be attributed mainly to the interaction betweenRuO 2 <strong>and</strong> IrO 2 . We believe that the excellent electrocatalyticactivity <strong>of</strong> our <strong>carbon</strong>-<strong>supported</strong> <strong>PtRuIr</strong> nanocompositefor HOR in the presence <strong>of</strong> CO is encouraging for the research<strong>and</strong> development <strong>of</strong> PEM fuel cells. Further refinement <strong>of</strong> thepreparative conditions will hopefully afford even better catalystperformance.AcknowledgmentsThe financial support <strong>of</strong> the National Natural Science Foundation<strong>of</strong> China (grants 50236010 <strong>and</strong> 20206030) is appreciated.References[1] P. Costamagna, S. Srinivasan, J. Power Sources 102 (2001) 242.[2] G. Hoogers, D. Thomposett, CATTECH 3 (1999) 106.[3] E. Antolini, Mater. Chem. Phys. 78 (2003) 563.[4] E. Antolini, J. Appl. Electrochem. 34 (2004) 563.[5] P.K. Babu, H.S. Kim, E. Oldfield, A. Wieckowski, J. Phys. Chem. B 107(2003) 7595.[6] E. Christ<strong>of</strong>fersen, P. Liu, A. Ruban, H.L. Skriver, J.K. Nørskov, J. Catal.199 (2001) 123.[7] J.J. Baschuk, X. Li, Int. J. Energy Res. 25 (2001) 695.[8] T.J. Schmidt, M. Noeske, H.A. Gasteiger, R.J. Behm, P. Britz, W. Brijoux,H. Bönnemann, Langmuir 13 (1997) 2591.[9] Y. Takasu, T. Fujiwara, Y. Murakami, K. Sasaki, M. Oguri, T. Asaki,W. Sugimoto, J. Electrochem. Soc. 147 (2000) 4421.[10] D.L. Boxall, G.A. Deluga, E.A. Kenik, W.D. King, C.M. Lukehart, Chem.Mater. 13 (2001) 891.[11] Y.M. Liang, H.M. Zhang, B.L. Yi, Z.H. Zhang, Z.C. Tan, Carbon 43(2005) 3144.[12] C. Lu, R.I. Masel, J. Phys. Chem. B 105 (2001) 9793.[13] V. Radmilović, H.A. Gasteiger, P.N. Ross Jr., J. Catal. 154 (1995) 98.[14] C. Bock, C. Paquet, M. Couillard, G.A. Botton, B.R. MacDougall, J. Am.Chem. Soc. 126 (2004) 8028.[15] H.A. Gasteiger, N. Marković, P.N. Ross Jr., E.J. Cairns, J. Phys. Chem. 98(1994) 617.[16] B. Yang, Q. Lu, Y. Wang, L. Zhuang, J. Lu, P. Liu, J. Wang, R. Wang,Chem. Mater. 15 (2003) 3552.[17] G.A. Camara, M.J. Giz, V.A. Paganin, E.A. Ticianelli, J. Electroanal.Chem. 537 (2002) 21.[18] G. Samjeské, H. Wang, T. Löffler, H. Baltruschat, Electrochim. Acta 47(2002) 3681.[19] M. Götz, H. Wendt, Electrochim. Acta 43 (1998) 3637.[20] P. Shen, K. Chen, A.C.C. Tseung, J. Electrochem. Soc. 142 (1995) L85.[21] D.C. Papageorgopoulos, M. Keijzer, F.A. de Bruijn, Electrochim. Acta 48(2002) 197.
476 Y. Liang et al. / Journal <strong>of</strong> Catalysis 238 (2006) 468–476[22] T.C. Deivaraj, W. Chen, J.Y. Lee, J. Mater. Chem. 13 (2003) 2555.[23] K.W. Park, J.H. Choi, B.K. Kwon, S.A. Lee, Y.E. Sung, H.Y. Ha, S.A.Hong, H. Kim, A. Wieckowski, J. Phys. Chem. B 106 (2002) 1869.[24] K.W. Park, J.H. Choi, B.K. Kwon, S.A. Lee, C. Pak, H. Chang, Y.E. Sung,J. Catal. 224 (2004) 236.[25] H.R. Colón-Mercado, H. Kim, B.N. Popov, Electrochem. Commun. 6(2004) 759.[26] T.J. Schmidt, Z. Jusys, H.A. Gasteiger, R.J. Behm, U. Endruschat, H. Bönnemann,J. Electroanal. Chem. 501 (2001) 132.[27] Y.Y. Dai, Z.T. Liu, Q.Z. Jiang, D.Y. Zhang, Z.F. Ma, Chin. J. NonferrousMetals 14 (2004) 402.[28] A. Chen, D.J. La Russa, B. Miller, Langmuir 20 (2004) 9695.[29] R. Kötz, S. Stucki, Electrochim. Acta 31 (1986) 1311.[30] L.A. da Silva, V.A. Alves, M.A.P. da Silva, S. Trasatti, J.F.C. Boodts, Electrochim.Acta 42 (1997) 271.[31] D.R. Lide (Ed.), H<strong>and</strong>book <strong>of</strong> Chemistry <strong>and</strong> Physics, eightieth ed., CRCPress LLC, New York, 1999, p. 148, chap. 6.[32] S. Komarneni, R. Pidugu, Q.H. Li, R. Roy, J. Mater. Res. 10 (1995) 1687.[33] X. Li, W.X. Chen, J. Zhao, W. Xing, Z.D. Xu, Carbon 43 (2005) 2168.[34] Z. Liu, L.M. Gan, L. Hong, W. Chen, J.Y. Lee, J. Power Sources 139(2005) 73.[35] K.Y. Chan, J. Ding, J. Ren, S. Cheng, K.Y. Tsang, J. Mater. Chem. 14(2004) 505.[36] R. Harpeness, A. Gedanken, Langmuir 20 (2004) 3431.[37] I. Dobrosz, K. Jiratova, V. Pitchon, J.M. Rynkowski, J. Mol. Catal. A:Chem. 234 (2005) 187.[38] Y. Verde, G. Alonso-Nunez, M. Miki-Yoshida, M. José-Yacamán, V.H.Ramos, A. Keer, Catal. Today 107–108 (2005) 826.[39] T. Kobayashi, A. Ueda, Y. Yamada, H. Shioyama, Appl. Surf. Sci. 223(2004) 102.[40] B.L. Gratiet, H. Remita, G. Picq, M.O. Delcourt, J. Catal. 164 (1996) 36.[41] D.G. Liu, J.F. Lee, M.T. Tang, J. Mol. Catal. A: Chem. 240 (2005) 197.[42] Y.J. Zhang, A. Maroto-Valiente, I. Rodriguez-Ramos, Q. Xin, A. Guerrero-Ruiz,Catal. Today 93–95 (2004) 619.[43] H.A. Gasteiger, N.M. Marković, P.N. Ross Jr., J. Phys. Chem. 99 (1995)16757.[44] A. Hamnett, B.J. Kennedy, Electrochim. Acta 33 (1988) 1613.[45] J.L. Zang, G.X. Xiong, Chin. J. Catal. 1 (1980) 73.