Annual Report 2002
Annual Report 2002
Annual Report 2002

Create successful ePaper yourself
Turn your PDF publications into a flip-book with our unique Google optimized e-Paper software.
A L F A G R O U P A N N U A L R E P O R T 2 0 0 2ACHIEV EMENTSAs one of the leading financial-industrial groups inRussia, and as one of the largest investors intoemerging markets in the world, Alfa Group, its companies,and its people are recognised by prestigiousindependent organisations and the media asleaders in their industries. Following is a selectionof some of this recognition:We are leading...by exampleALL RUSSIAN COMPETITION“GOLDEN WEB-SITE”Golden Telecom: 1st place, “Corporate Web-Site” (<strong>2002</strong>)3RD ALL RUSSIAN COMPETITION“RUSSIAN ORGANIZATIONWITH HIGH SOCIAL EFFICIENCY”OAO “Volga” (managed by Alfa-Eco): “Best Companyin Paper and Pulp Industry” (<strong>2002</strong>)3RD ANNUAL NATIONAL AWARDIN MEDIA-BUSINESS “MEDIA-MANAGEROF RUSSIA – 2003”Alexander Gafin, Director of Public Relations andMarketing of Alfa Bank: 1st Place,“PR–Industry” (2003)AMERICAN SOCIETYFOR COMPETITIVENESSTNK: Philip B. Crosby Medallion for EntrepreneurialLeadership (2001)ASSOCIATION OF MANAGERS ANDKOMMERSANT PUBLISHING HOUSE“1000 Most Professional Managers in Russia”(2001-No.1; <strong>2002</strong>-No.11) Mikhail Fridman, Chairmanof the Supervisory Board of Directors of Alfa Group;(2001-No.9) Pyotr Aven, President of Alfa Bank;(2001-No.21; <strong>2002</strong>-No.5 ) German Khan,Deputy Chairman of Management Board and ExecutiveDirector of TNK“Industrial Leaders” (No.1) Financial Sector – PyotrAven, President of Alfa Bank; (No. 1) Inter-industrialGroups – Mikhail Fridman, Chairman of theSupervisory Board of Directors of Alfa Group (<strong>2002</strong>)“200 Most Professional Financial Officers” (No. 1) TeijoPanko, Chief Financial Officer at Alfa Bank (<strong>2002</strong>)“200 Most Professional IT Directors” (No. 3) MartinPilecky, Director of Information Technology at AlfaBank (<strong>2002</strong>)“200 Most Professional HR Directors” (No.12) MarinaMalykhina, HR Director at Alfa Bank (<strong>2002</strong>)BUSINESS WEEKMAGAZINEVimpelCom: 1st Place, “Best TelecommunicationCompany in the Worldand Best IT Company in Russia” (<strong>2002</strong>)Mikhail Fridman, Chairmanof the Supervisory Board of Directorsof Alfa Group: “The Stars of Europe –25 Leaders” (2003)CANNES LIONSAlfaInsurance: 1st Place, “Best Creative Ideafor a Television Commercial” (2001)CAREER MAGAZINEJoseph Bakaleinik, CFO of TNK: “Best CFO inRussia” (2000)EFFIE AWARDSVimpelCom: “Brand of the Year – BeeLine GSM”(2000, <strong>2002</strong>)TNK: “Brand of the Year – TNK Petrol Stations”(<strong>2002</strong>)EMERGING MARKETS INVESTORMAGAZINEAlfa Bank: “Best Domestic Bank” (2001)EUROMONEY MAGAZINEAlfa Bank: “Highly RecommendedBank – Russia” (2000),Best Bank in Russia” (<strong>2002</strong>)EUROMONEY’S CENTRALEUROPEAN MAGAZINEAlfa Bank: “Best Bank in Russia”(1997, 1998, 1999, 2000, 2001)EXPERT MAGAZINE(Awards for Best <strong>Annual</strong> <strong>Report</strong>s)Alfa Group: “Internet Presentation”(2001 - Nominee; <strong>2002</strong> - Winner),“Richness of Information” (<strong>2002</strong> - Nominee),“Classic Genre” (<strong>2002</strong> - Nominee)Alfa Bank: “Classic Genre” (2000 - Winner),“Internet Presentation” (2000 - Winner; <strong>2002</strong> -Nominee), Richness of Information”(2000, 2001 - Winner; <strong>2002</strong> - Nominee),“Design and Printing” (2001 - Nominee)Alfa-Eco: “Design and Printing” (<strong>2002</strong> - Nominee)EXPERT MAGAZINEAlfa Bank: “Best Reputation Among FinancialOrganisations” (<strong>2002</strong>)FINANCIAL TIMES – ENERGYTNK: “World’s Best Oil and Gas Company” (2000)GENEVA INSTITUTE OF BUSINESSAND MANAGEMENT, GRM CONSULT(SWITZERLAND),TECHNOMICCONSULTANTS AND RUSSIA-SWITZERLANDBUSINESS CLUBOAO “Volga” (Managed by Alfa-Eco): “Gold Medalfor Irreproachable Business Reputation” (<strong>2002</strong>)GLOBAL FINANCE MAGAZINEAlfa Bank: “Best Russian Domestic Bank” (1999, 2000,2001, <strong>2002</strong>, 2003)Alfa Bank: “Best Russian Trade Finance Bank” (2001,<strong>2002</strong>, 2003)Alfa Bank: “Best M&A Advisor” (2003)INSTITUTE OF CORPORATEGOVERNANCEVimpelCom: Highest Overall Corporate GovernanceRating for a Russian Company (2000, 2001, <strong>2002</strong>)INSTITUTE OF ECONOMIC STRATEGYAND ECONOMIC STRATEGY MAGAZINEAlfa Bank: 1st Place, “Leading Russian Companies”(<strong>2002</strong>)AlfaInsurance: 3rd Place, “Leading Russian InsuranceCompanies” (<strong>2002</strong>)Alfa Group Consortium: 1st Place, “100 LeadingCompanies with the Highest Rating Status AAAand Maximum Strategic Level 90.0” (<strong>2002</strong>)INTERNATIONAL ASSOCIATIONOF BUSINESS COMMUNICATIONSPerekriostok: 1st Place, “Golden Net – Foodstuffs”(<strong>2002</strong>, 2003)TNK: 1st Place, “Golden Net – Petrol Stations” (<strong>2002</strong>)INTERNATIONAL BEVERAGEINDUSTRY FORUMAlfa-Eco: Gold Medal for 1700 Cognac; Bronze Medalsfor Smirnov Vodka and Armina 5 Star Brandy (2001)INTERNATIONAL ACADEMYOF ACHIEVEMENTMikhail Fridman, Chairman of the Supervisory Boardof Directors of Alfa Group:“The Golden Plate Award” (2003)INTERNATIONAL EXHIBITION(ECOPRODEXPO)Perekriostok: Grand Prix – “Supermarketof 21st Century” (2003)10TH INTERNATIONAL EXHIBITION“PRODEXPO-2003”Trade House of P.A. Smirnov’s Descendants (managedby Alfa-Eco): Gold Medal for Smirnov Vodka No. 21;Silver Medal for Liqueur “Mozzevelovaya” and“Klyukvennaya”; Bronze Medal for Liqueur“Limonnichek” and “Perzovaya”IZVESTIA NEWSPAPERAlfa Bank: 1st Place, “Best Bank Web-Sites” (2000)KOMPANIYA MAGAZINETNK: “Best Fuel and Energy Company” (2000)VimpelCom: “Best Telecommunications Company” (2001)Josef Bakaleinik, CFO of TNK:“Best Financial Manager” (2001)Alex Knaster, CEO of Alfa Bank:“Best Manager – Finance Sector” (2000)Simon Kukes, President of TNK:“Best Manager – Oil & Gas Sector” (2000, 2001)Jo Lunder, President and COO of VimpelCom:“Best Manager – Retail and Distribution” (2000)Stewart Reich, CEO of Golden Telecom Inc :“Best Manager – Telecommunications” (2000)MONEY MAGAZINE“Top Managers in Russia”(2001) (No.19) MikhailFridman, Chairman of the Supervisory Board of Directorsof Alfa Group; (No.24) Alexander Fain, General Directorof Alfa-Eco Group; (No. 32) German Khan, DeputyChairman of Management Board and Executive Directorof TNK; (No.34 ) Simon Kukes, President of TNK;(No.93) Jo Lunder, President and COO of VimpelComMOSCOW INTERNATIONALCURRENCY ASSOCIATIONAlfa Bank: Best Currency Dealing – Russia (<strong>2002</strong>)MOSCOW INTERNATIONALADVERTISING FESTIVALAlfa Bank: 1st Place, “TV-Advertising” (<strong>2002</strong>)NATIONAL ASSOCIATION OF STOCKMARKETS PARTICIPANTS (NAUFOR)STOCK MARKET ELITE AWARDSAlfa Bank: “Best Credit Institution” (2001, <strong>2002</strong>),“Best Trading Institution” (<strong>2002</strong>);“Best Institution in Bond Market” (<strong>2002</strong>)NATIONAL TRADE ASSOCIATIONPerekriostok:“Best Trading Chain” (2001);“Best Chain in Central Region” (<strong>2002</strong>)OIL & GAS INVESTOR MAGAZINETNK: “Prize for Great Achievements in CorporateGovernance” (<strong>2002</strong>)ROSBUSINESSCONSULTING ET ALVimpelCom: “Best Service Company” (1999)Lev Khasis, Chairman of the Board of Directors ofPerekriostok: National Award “Person of the Year -Manager of Retail Business” (<strong>2002</strong>)STANDARD & POOR’SAlfa Bank: “Best Outlook of All Rated Banks inRussia” (1999)STATE COMMITTEE ON STANDARDSOF THE RUSSIAN FEDERATIONTNK’s Ecologically Friendly High-Octane Gasoline:“Best Russian Products” (1998)ST. PETERSBURG FAIR OF WINE & VODKATrade House of P.A. Smirnov’s Descendants (managedby Alfa-Eco): Gold Medal for Smirnov Vodka No.21,Liqueur “Sukharnichek” and “Brusnichnaya”Alfa-Eco: Gyumri Cognac; Grand Gold Medal forCognac “1700 years of Christianity in Armenia” (<strong>2002</strong>)THE BANKER MAGAZINEAlfa Bank: “Bank of the Year – Russia” (2000);“1000 Best Banks in the World”(<strong>2002</strong>)UNION OF ENTREPRENEURSAlexander Fain, General Director of Alfa-Eco Group:“Best Entrepreneur of the Decade –Trading Activities” (2001)
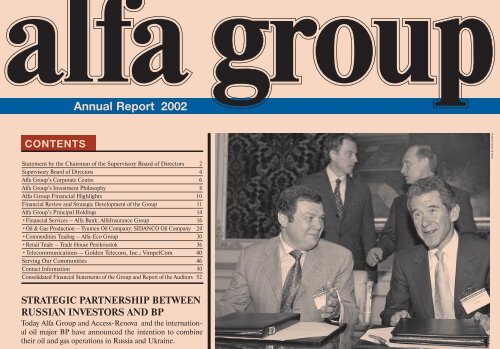
ALFA GROUPANNUAL REPORT<strong>2002</strong>LEADERSHIP2 ● CONTINUED STRONG PERFORMANCE ● NEW STRATEGIC INVESTMENTS ● PROFITABLE EXITS FROM INVESTMENTS ● CORPORATE RESPONSIBILITY & TRANSPARENCY3Statementby the Chairmanof the SupervisoryBoard of Directors<strong>2002</strong> will be remembered as one of the mostdifficult for global economies in decades. Poorbusiness models were exposed, large companiesfiled for bankruptcy and corporate credibilitywas called into question. By contrast,Russia was, to a large extent, insulated fromglobal events and enjoyed robust economicgrowth, relative political stability, a continuingstrategic shift towards the West, controlledinflation, a stable rouble exchange rate, slowbut steady legislative reform success, increasingrepatriation of offshore Russian capital,double-digit growth in average real wagesaccompanied by healthy increases in consumerspending, a shrinking and manageableforeign debt, sovereign credit rating upgradesto two notches away from investment grade,and high world oil prices. Against thisfavourable backdrop, Russia’s debt and equitymarkets were among the best performing in theworld for a second year running, with thebenchmark RTS Index returning 39.9% (USDollar terms) in <strong>2002</strong>.Alfa Group Consortium participated fully inthese positive developments, and ended the yearstronger and in a better position to deliver shareholdervalue over the long-term. Thanks in largepart to oil-inspired earnings, <strong>2002</strong> marked AlfaGroup’s fourth consecutive year of strong profitabilitywith net profits of US $626 million in<strong>2002</strong> and US $3.11 billion in cumulative profitsover the past four-year period ended <strong>2002</strong>. In<strong>2002</strong>, we grew shareholders’ equity to its highesteverlevel of US $2.52 billion at 31 December<strong>2002</strong>. US $1 invested into the Group at 1 January2000 would have grown to US $20.81 (a 1,981%return) over this three-year period ended 31December <strong>2002</strong>. By comparison, US $1 investedin the RTS over the same three-year periodwould have grown to US $2.05 (a 105% return).During <strong>2002</strong> and 2003, we made significantfurther strategic investment into the telecommunicationsand oil and gas sectors: In the latterhalf of <strong>2002</strong>, we acquired an effective 20.1%stake in Kyivstar GSM, Ukraine’s largest cellularcommunications company, for US$93.2 million; In November <strong>2002</strong> and inAugust 2003, we funded a total of US $117 million– representing the second and finaltranches – to VimpelCom-R for the continuedaggressive Russian regional expansion of itscellular network; In August 2003, we acquiredan effective 25.1% stake in MegaFon, the thirdlargest wireless telecommunications servicecompany in Russia; In December <strong>2002</strong>, TNKacquired, jointly with Sibneft, an approximate75% stake in Slavneft, for US $1.86 billion, thesecond largest privatisation tender in Russia’shistory.At the end of <strong>2002</strong>, we took a strategic decisionto exit two of our investments. We completed thesale of United Food Company, selling UFC’ssugar and grain businesses to a private strategicinvestor for an attractive price. Also in December<strong>2002</strong>, we sold our entire interest in our internationalcommodities trading business, CrownResources AG, in a management-led buyout.
Despite the continuing problems which Russiafaces in attracting foreign direct investment,Alfa Group continues to attract sizeable equityinvestment from both foreign strategic and foreignportfolio investors. Effective 1 January2003, Alfa Group and Access/Renova togetherwith British Petroleum merged virtually all oftheir Russian and Ukrainian oil and gas assetsinto TNK-BP, a new holding company, to formRussia’s third largest (by production andreserves) oil company. Under the terms of thedeal, TNK-BP is owned 50% by BP, 25% byAlfa Group and the remaining 25% byAccess/Renova. BP paid cash of US $2.6 billionto Alfa Group and Access/Renova at the closeof the deal and BP will pay three annual tranchesof US $1.25 billion in BP shares from 2004-2006. Also, Alfa Group and Access/ Renovawill receive an additional US $1.35 billion fromBP upon contribution of our approximate 50%stake in Slavneft to TNK-BP. The deal is the“BP entered Russia five years ago whenwe bought ten percent of SIDANCO. Wehad a tough time initially, but after thepresent management and ownershipstructure was established early in 2001we have gradually built an important,mutually beneficial relationship with theowners of AAR [Alfa Group and Access-Renova] and learned a great deal aboutdoing business in Russia...This is a majorstrategic step into a country with massiveoil and gas reserves and immensepotential for future growth.” – Lord JohnBrowne, CEO of BP, on BP’s investment intoRussia, 11 February 2003.largest single foreign direct investment inRussian history. Also, in April 2003, we sold anapproximate 7.7% stake in Trade HousePerekriostok to Templeton Strategic EmergingMarkets Fund LDC.In addition to new investment, for a number ofyears, foreign investors have invested successfullywith us, including Telenor (into VimpelComand VimpelCom-R) and the EBRD, CapitalInternational Inc. and Baring Vostok CapitalPartners (into Golden Telecom). Since our initialinvestments into US-listed VimpelCom andGolden Telecom in the second-half of 2001,VimpelCom’s share price has risen by 259% andGolden Telecom’s share price has risen by 217%through 31 August 2003. We have for a longtime, considered our ability to invest successfullyalongside foreign investors as an importantcompetitive advantage – one which enables usto fully develop our companies and one whichgives us a logical and attractive means of exitingour investments. Our history of co-operationwith BP exemplifies this.During <strong>2002</strong>, a worldwide economic slowdown,accompanied by historically low global interestrates, coupled with improving fundamentals inour companies, helped us to attract longer,cheaper and more stable financing. Our companieswere among the first Russian companies toaccess capital through the Eurobond marketssince the Russian economic crisis of 1998:VimpelCom in April <strong>2002</strong> issued US $250 millionin 3-year Eurobonds; Alfa Bank at the endof <strong>2002</strong> issued US $175 million in 3-yearEurobonds; and TNK, at the end of <strong>2002</strong> floatedUS $400 million in 5-year Eurobonds, andan additional US $300 million offering of thesame Eurobond in Q1 2003.As has been the case in prior years, we continueto re-invest large portions of our profits backinto our businesses on the belief that this is thebest and highest use of our capital. In the threeyearperiod ended 31 December <strong>2002</strong>, we havepaid out US $121.1 million (equivalent 4.6%)of three-year cumulative net profits as dividends.In addition, we injected fresh capitalinto our businesses during <strong>2002</strong>-2003 – US$104.4 million into Alfa Bank, US $30 millioninto Perekriostok and US $55.1 million intoAlfa-Eco.There is an underlying strength to Russia whichis more compelling than simply undervaluedassets and oil. There are a handful of Russiancompanies which continue to make the rightmoves by positioning themselves to fully availthemselves of the changes which are now takingplace in the Russian marketplace. We are confidentthat the fundamentals by which we operate– fundamentals which embrace corporateresponsibility and transparency, and the investmentphilosophy to which we adhere – astraight forward and successful investment philosophywhich has served us well for more than14 years – will continue to play a central role inthe long-term success of Alfa Group.On behalf of the Supervisory Board ofDirectors, I wish to thank all of our clients andpartners for their business and for their continuedconfidence in <strong>2002</strong> and to restate ourcommitment to them in 2003 and beyond.Also, I especially want to express my appreciationto the thousands of Alfa Group employeesfor their continuing loyal and talented contributions.Mikhail Fridman15 September 20034 5Supervisory Board of DirectorsThe Supervisory Board ofDirectors of Alfa Groupis the Group’s supremeconsultative and oversight bodythat sets the general direction forthe strategic development of theGroup as a whole as well as of itsindividual companies. TheSupervisory Board comprises10 members who represent themain companies of the Group.The majority of SupervisoryBoard members are non-executivedirectors.The Supervisory Board meetingsare held once every two weeks,and serve as a forum to exchangeideas and opinions about thecurrent developments in theworld economic and politicalarenas. The Supervisory Boardalso considers key strategicissues for the Group, includingthe review of major financial andinvestment transactions, thecritical evaluation of companyperformance, and the developmentof strong corporate governanceand control mechanisms.The <strong>Annual</strong> Meeting of theGroup is held each April atwhich time the SupervisoryBoard reviews the results of theyearly performance, approvesperformance-related compensationfor top executives, ratifiesforward-looking budgets, andagrees on the overall strategy ofeach of the Group’s companies.Mikhail FridmanChairman of theSupervisory Board of AlfaGroup Consortium■ Mr. Fridman is a principal founderof Alfa Group Consortium. He graduatedfrom the Moscow Institute of Steeland Alloys and two years later togetherwith other investors, he foundedAlfa-Eco, a trading company on whichhe built Alfa Group Consortium. Mr.Fridman was born in Lvov, Ukraine in1964.German KhanExecutive Directorof TNK-BP■ Mr. Khan, from August 2003 is anExecutive Director in the newly formedTNK-BP. Не is a former DeputyChairman of the Management Boardand an Executive Director of TNK.Under Mr. Khan’s management, aprogramme for the transformation ofTNK into a vertically integrated oil andgas company was initiated and astrategic alliance with British Petroleumwas achieved. Mr. Khan is agraduate of the Moscow Institute ofSteel and Alloys. He was born in Kiev,Ukraine in 1961.Alexei KuzmichovChairman of the Boardof Directors of Alfa-EcoGroup■ Mr. Kuzmichov is responsible forthe strategic co-ordination and developmentof commodity trading activitieswithin the Alfa Group through theGroup’s domestic trading arm — Alfa-Eco. Mr. Kuzmichov is also a memberof the Board of Directors of AlfaFinance Holdings SA, the holdingcompany for the Group’s investmentsin banking, oil and gas, and certaintelecommunications assets. Mr.Kuzmichov is a graduate of theMoscow Institute of Steel and Alloys.Не was born in Kirov, Russia in 1962.During <strong>2002</strong> Alexei Reznikovich and LevKhasis joined the Supervisory Board. They addsignificant functional expertise, strategic insightinto management issues and a deep and practicalunderstanding of the Russian consumermarkets.The scope of activity of the Supervisory Boardof Directors and of our companies’ Boards isregulated by the Group Statute and corporateregulations, which are periodically reviewedand appended as the need arises. The year <strong>2002</strong>has seen the continued strengthening of theBoards of Directors of our Group companiesdue to improvements in their operating proceduresand appointment of new independentdirectors. Still, the Supervisory Board reflectson the important topics and shares its collectiveinsight and experience with the leadership ofour Group companies, to push the frontiers oftheir businesses’ success.Managerial power is highly devolved within the Alfa Group,avoiding the centralisation more common in Russian businessgroups and leaving him as its chairman, time to “think aboutstrategy and philosophy - I am not a machine for makingdecisions...”“Lunch with the FT: Mikhail Fridman”, Financial Times, 14 March 2003
ALFA GROUPANNUAL REPORT<strong>2002</strong>14 ■ PROGRESSIVE THINKING ■ FORESIGHT ■ DYNAMISM ■ TRANSPARENCY ■ SAVVY15Alfa Group ConsortiumFounded in 1989, Alfa Group Consortium is one of Russia’s largest privately owned financial-industrial conglomerates with interests inoil, commodities trading, commercial and investment banking, ins urance, retail trade and telecommunications. The Group typicallyfocuses on value-oriented, longer-term opportunities, primarily in R ussia and the CIS, but also invests in other markets which form partof the Group’s strategic business objectives.ALFA GROUP ’S MAIN HOLDINGS■ FINANCIAL SERVICES■ OIL & GAS PRODUCTION■ COMMODITIES TRADING■ RETAIL TRADE■ TELECOMMUNICATIONSAlfa Bank GroupLargest private bank in Russia. Wide range of financial services, includingcommercial and investment banking, trade finance, and asset management.AlfaInsurance GroupLeading issuer of non-obligatory insurance in Russia.Tyumen Oil Company4th largest (by production), 3rd largest (by reserves), vertically integrated oiland gas company in Russia.SIDANCO Oil CompanyTop-ten (by production), 5th largest (by reserves) vertically integrated oil andgas company in Russia.Alfa-Eco GroupCommodities trading and distribution in Russia, CIS and Southeast Asia. Strategic investmentinto telecommunications. Large-scale investment into industrial assets.Trade House PerekriostokLeading chain of supermarkets and one hypermarket in Moscow and otherpopulation centres in Russia.Golden Telecom, Inc.Leading facilities-based provider of integrated telecommunications andInternet services in major population centres in Russia and CIS.VimpelComLeading wireless telecommunications service company in Russia.– From 1 January 2003, TNK and SIDANCO along with British Petroleum’s Russian and Ukrainian oil assets are united under a single holding company, TNK-BP.TNK-BP is the 3rd largest (by oil production and reserves) oil and gas company in Russia.
FINANCIAL SERVICESALFA GROUPANNUAL REPORT<strong>2002</strong>16 17Alfa BankCommercial BankingFounded in 1990, Alfa Bank has developed rapidly to become Russia’s largest privately owned bank. It provides a full rangeof banking products and services in commercial and investment banking, asset management and leasing. Spread over ninetime zones, the Bank has the second largest branch network in Russia and the CIS and fully licensed banking subsidiaries inUkraine, Kazakhstan and the Netherlands as well as brokerage operations in the United Kingdom and the United States.History<strong>2002</strong> was the twelfth year of Alfa Bank’ssuccessful operation in the Russian andinternational financial markets. Although12 years is not a long period when judgedagainst the history of some internationalbanks, it is nevertheless a noteworthyachievement in post-Soviet Russia.Financial Highlightswww.alfabank.comIn <strong>2002</strong>, Alfa Bank’s net profits increased to US $105 million, a 22% increase on 2001, while total assets grew by 51%during <strong>2002</strong>, reaching US $4.12 billion at year-end <strong>2002</strong>. This increase in total assets came primarily from the Bank’sexpanding customer loan portfolio, which rose by 69% to US $2.4 billion. This increase would not have been possiblewithout a corresponding increase in the Bank’s deposit base, which rose by 39% to US $2.62 billion (including bills ofexchange) by year-end <strong>2002</strong>. The Bank also registered a healthy increase in its net interest margin, increasing it by 71%over 2001 to US $190 million in <strong>2002</strong>.Retail BusinessAlfa Bank pays a great deal of attention tothe servicing of customers and providingthem with a full range of banking services.The balance on individual rouble and foreigncurrency accounts rose by 62% during<strong>2002</strong> to US $788 million placing Alfa Banksecond among Russian banks in retaildeposits in Russia. Also, by the end of<strong>2002</strong>, Alfa Bank had issued 350,000 plasticcards, making it one of the top fourRussian plastic card issuers on the market.In April 2003, Alfa Bank officiallylaunched its innovative retail businessmodel, operating under the “Alfa BankExpress” brand name, with elevenbranches in downtown Moscow, andplans for a further nine to fifteen branchesby the end of 2003. The new branchesaim to bring the retail business closerto the customer by making it accessible,As a financial supermarket with a strong capital base and asubstantial range of commercial banking services, Alfa Bankmaintains relations with a large number of enterprisesengaging in a variety of economic activities and offers productswhich are tailored to individual client needs. Equippedwith the latest technology, the Bank offers an ever-growingarray of financial and banking services.transparent, and enjoyable. Alfa BankExpress has a simple and easily understandablemulti-channel product offering,24-hour service, a fully operationalcall centre, and a field sales force, whichis supported by effective businessprocesses, an advanced IT-platform, anda strong branding campaign. There areplans to convert existing Alfa Bankbranches into a new format, introduce anon-line banking facility, and increase therange of products and functionalitiesavailable to customers. A regional expansionstrategy for Alfa Bank Express is alsoplanned for the nearest future.Regional NetworkIn <strong>2002</strong> a number of Alfa Bank brancheswere set-up across Russia includingMurmansk, Ulianovsk, and Kemerovo.Also, twelve new offices were establishedin Moscow and other Russian regions.Currently, Alfa Bank’s branch networkstretches from Sakhalin in the east toKaliningrad in the west.International NetworkThe Bank also has subsidiary banks inKazakhstan and Ukraine as well as in theNetherlands, the latter being the only100% privately owned Russian commercialbank (Amsterdam Trade Bank or“ATB”) with a comprehensive bankinglicense in the European Union. Alfa Bankoperates brokerages in London and NewYork to service the international clientbase of the Bank’s securities divisions.Alfa Securities in London was founded inJune 2000 and is licensed by UK’sFinancial Services Authority (“FSA”). AlfaSecurities was the first Russian companyDuring <strong>2002</strong> and 2003, Alfa Bank continuedto receive accolades from the internationalfinancial media. In <strong>2002</strong>, AlfaBank was recognised by Euromoney as“Best Bank in Russia”. In early 2003,Global Finance, an influential US businessjournal, named Alfa Bank “Best Bank inRussia” for the fifth consecutive year,“Best Trade Finance Bank in Russia” forthe third consecutive year and “Best M&AAdviser”.Net Operational Income by Segment5%8%16%48%Net Profit / Loss (‘ooo USD)Alfa Bank’s Presence in Russia and Other CountriesAlfa Bank’s long-term current ratings areFitch (B, with positive outlook), Moody’s(B1, with stable outlook) and Standard &Poor’s (B, with stable outlook). In <strong>2002</strong>and 2003 Alfa Bank’s ratings wereaffirmed by all three international ratingagencies.23%Corporate FinanceFX, MMAlfa Bank became the first private Russianbank to sign the official Memorandum onco-operation with the Overseas PrivateInvestment Corporation of the US (OPIC)during the visit by Alfa Bank’s managementteam to the United States in June <strong>2002</strong>.Fixed IncomeInvestments Available For SaleSource: Company dataCommercial BankSource: <strong>Annual</strong> audited IFRS/IAS standalone financial statements
to obtain a FSA license after the 1998Russian financial crisis. Alfa Bank also hasNASD registered Alfa Capital Markets(USA) Inc in New York to facilitate brokerageand dealer operations in the US.Financial InstitutionsIn cooperation with its foreign partners,Alfa Bank provides a refined and diversifiedrange of services in the areas of tradeand project finance, clearing, foreignexchange and banknote services. During<strong>2002</strong>, Alfa Bank expanded its alreadyextensive relations with major banks inEurope, North America, Asia, Africa andLatin America. This activity was in partfacilitated by Alfa Bank’s leading positionamong Russian non-government banks inproviding global clearing services.In November <strong>2002</strong>, Alfa Bank launchedand priced a three-year, US $175 millionEurobond, the first Russian Eurobondissued by a privately owned financialinstitution since the crisis of 1998. Thedeal size was increased from an initiallyplanned amount of US $150 million andwas still more than two times oversubscribed.In January 2003, Alfa Bank obtained a twoyearUS $50 million unsecured syndicatedloan from a consortium of leading internationalbanks arranged by ING and ABNAMRO. This was the largest unsecuredfacility received by a private Russian financialinstitution in the international loanmarket since Russia’s 1998 financial crisis.LendingIn <strong>2002</strong>, the extension of loans, bank guaranteesand other credit related productswere considerably intensified and enlargeddue to a broader client base, andthe use of loan facilities by newly openedbranches. As such, in <strong>2002</strong> income derivedfrom lending activity made the largestoverall contribution to the Bank’s aggregateincome. An expanding and diversifiedclient base has enabled the Bank tospread the risk of its loan portfolio acrossdifferent sectors of the economy.Specifically, the Bank significantlyincreased lending to manufacturing, construction,trade and commerce enterprisesbeginning in 2001 and continuingthrough <strong>2002</strong>. Despite the large increasein the Bank’s lending base, the creditprocess at Alfa Bank continues to be basedon a strict lending and risk managementculture, which is exemplified by the outstandingquality of the loan portfolio.Currency and InterbankMarketsFor several years, Alfa Bank has enjoyed aleading position on the domestic andinternational foreign exchange markets,including the markets of the CIS. <strong>2002</strong>saw the further steady growth of theBank’s revenues from currency operationsin the Russian market caused by asustainable increase in the volume ofclient operations, and by an increase involume of Alfa Bank’s operations on theMoscow Interbank Currency Exchange(“MICEX”). Today, Alfa Bank has between9% and 11% share of the RR/USD market.Total daily turnover in RR/US dollar transactionsgrew by more than 30% during<strong>2002</strong> – from US $150 million inDecember 2001 to US $200 million inDecember <strong>2002</strong>.Throughout <strong>2002</strong> Alfa Bank consolidatedits position as one of the key market makerson the interbank markets. Thisprocess was facilitated by the Bank’s flexibleand forward looking approach todealing with customer requirements, thecreation of new products and the use ofdifferent forms of collateral such as securities,deposits and other liquid instruments.Alfa Bank’s annual turnover in theinterbank market grew to approximately15 billion roubles, which represents about10-15% share of the total market volume.Total daily turnover in US Dollar interbanktransactions grew to US $50-150million.18 19Investment BankingEquity Markets andTradingAccording to a survey conducted by theFederal Securities Commission in <strong>2002</strong>,Alfa Bank was the leading bank in termsof volumes of equity transactions on theMICEX. At the same time, Alfa Bank’sposition also strengthened on both theRTS Stock Exchange and ADR markets.Overall, the Bank ranks among the topthree most active Russian market participants,with an overall trading volume inexcess of US $5 billion per annum.Through the implementation of newtechnology and financial services, theBank has been able to integrate its securitiesbusiness into a broader range ofbanking services offered to clients.Internet trading system “Alfa-Direct,”launched in 2001, continues to successfullyattract investors with the number ofresident accounts increasing by 100% in<strong>2002</strong> and with volumes exceeding US $3billion per annum.In <strong>2002</strong>, Alfa Bank further developed itscapital markets business and was the onlyfinancial institution to act as co-lead managerin the primary placements of bothWimm-Bill-Dann on the NYSE andRosBusinessConsulting on the local market.Fixed Income Trading andCapital MarketsAlfa Bank is the leader in many segmentsof this market. Importantly, Alfa Bank is amarket maker in local bonds as well as incorporate and sovereign Eurobonds. Also,Alfa Bank’s extensive branch networkensures access to regional issuers and createspossibilities for an objective assessmentof their creditworthiness.One of the highlights of <strong>2002</strong> in the areaof fixed income trading was that profitsfrom REPO operations increased sevenfoldas compared to the previous year.Income from Capital Markets and commissionsincreased three-fold.Asset ManagementAlfa Bank, through its subsidiary AlfaCapital, is a trusted leader in the Russianfinancial markets in asset managementservices to a wide range of investors,including private individuals, pensionfunds, insurance companies and corporatetreasury departments. With over 1 millionunit holders, Alfa Capital manages the mostwidely held mutual fund in Russia. In <strong>2002</strong>the Fund’s per unit rouble price increasedby approximately 35%. In 2003, the mostimportant strategic goals will be the attractionof pension fund assets for managementand the effective use of existing distributionchannels in the Bank’s branchnetwork to market and sell a range ofnewly created family of investment funds.Corporate FinanceIn <strong>2002</strong>, the strategic co-operation andsynergies between commercial andinvestment banking sides of Alfa Bankensured the Bank’s success in the area ofcorporate finance. A summary of some ofthe more significant transactions whichthe Bank’s Corporate Finance team wereinvolved in <strong>2002</strong> and early 2003:• Acquisition of a blocking stake in South-Ural Cellular Telephone Company Ltd.(YUST) by Svyazinvest;• Acquisition of a 50% stake in Sovintel byGolden Telecom, Inc.;• US $175 million Eurobond issue for AlfaBank;• Sale of Solikamsk power station (Permenergo)to Solikamskbumprom;• Strategic advisory to RAO UES on structuralreform issues;• Acquisition of a blocking stake inKyivstar GSM by Alfa Bank;• Merger of Far East and Sibir telecommunicationcompanies as part of the overallrestructuring of Svyazinvest;• Private placement of Wimm-Bill-Dann;• Initial public offering of Wimm-Bill-Dann;• Acquisition of a super majority stake inKharkov Milk Plant by Wimm-Bill-Dann;• Acquisition of a super majority stake inSIDANCO by TNK.S T R A T E G YKeeping in line with Alfa Bank’s main strategic objective of maintaining theleading position in the Russian financial services industry, in <strong>2002</strong> the Bankfocused its efforts on diversifying its client portfolio, extending the maturityprofile of its funding base and reducing bank-wide operational costs. These key managementinitiatives will be further implemented in 2003 with the development of theexisting regional network and the opening of the new retail “Alfa Bank Express”branches in Moscow and other large cities, successful capital raising in the internationalcapital markets and the implementation of new IT platforms which will allow the Bankto reduce and control costs in years to come. All of these steps will allow Alfa Bank toincrease its market share among the growing segment of small and medium-sizedenterprises and retail customers, provide clients with longer-term competitively pricedcredit products and allow the Bank’s management to prudently mitigate any futureoperational uncertainty presented by the developing Russian economic landscape.The Bank’s investment banking business will be developed around the expansion of itscore client base both in Russia and abroad and continued divestment of assets, whichwere acquired during early privatisation. Focal points for 2003 and beyond are thedelivery of Alfa Bank’s investment products and brokerage services to the retail marketthough the use of the expanding branch network and information technologies underthe existing Internet brokerage Alfa-Direct. These efforts will be enhanced by theintroduction of new products for futures and options trading which will allow clientsto expand their exposure to the growing domestic securities market. In addition, foreignclients will be offered new means of accessing the Russian market through theintroduction of the Alfa Bank family of private equity funds, which are scheduled forlaunch in 2003.Advertisement of Alfa Bank safety deposit boxes, stressing trustworthiness and focus on customer needs.
20 21AlfaInsurance GroupAlfaInsurance Group of Companies is one of Russia’s largestinsurers and is consistently ranked amongst the top fiveinsurance companies on the market. The Group offers adiversified portfolio of services including comprehensivebusiness insurance programs and an extensive productrange for individuals. AlfaInsurance actively operates acrossthe whole of Russia and Ukraine.www.alfastrah.ruAlfaInsurance in <strong>2002</strong>In <strong>2002</strong>, the Group enjoyed cooperation with a number of large-calibre clients such as following:■ IBS Group Holding Ltd.■ IBM■ Golden Telecom■ SIDANCO■ Emergency Ministryof the Russian Federation■ Culture State TVand Radio Channel■ VimpelCom■ ICN■ Transnefteproduct■ Udmurtneft■ Pulkovo-2 Airport■ Volga Motor Works■ Petrovskiy Passazh■ Alfa-Eco Group■ Kommersant Publishers■ Volgotanker■ TD TsUM■ Wild Orchid■ TsENKI■ NTV+■ DON-Stroi■ MIAN■ Partiya■ Tekhnosila■ Bayersdorf (representative office)■ Samsung Electronics(representative office)■ Daimler Chrysler AG(representative office)■ Russian Trading System■ Serebryanyi DozhdRadio Station■ Udarnitsa ConfectionaryFactory
More ReliabilityAlfaInsurance Group’s reputation isbased on the strict performanceof its obligations to its clients. Assuch, the Group places special emphasison its financial stability. At the end of<strong>2002</strong>, the aggregate share capital of theGroup reached 1.115 billion roubles (US$35.08 million) making AlfaInsurance oneof the market leaders in terms of size ofnet assets.A reliable portfolio-hedging re-insuranceprogram enables the Group to insure largefinancial risks of its clients. The principalcriteria used in selecting re-insurance partnersare dependability, financial stabilityand high professionalism. The leadingglobal companies, including Munich Re,Swiss Re, SCOR, Hannover Re and Lloyd’sof London as well as blue-chip Russiancompanies are reliable and long-standingpartners of AlfaInsurance.Last year the Group was accredited by theTransportation Ministry, the EnergyMinistry, the State ConstructionCommittee of the Russian Federation, theRussian Munitions Agency, the MoscowChamber of Certified Public Accountantsand other government and non-governmentorganizations.More QualityThe Group’s key priorities for thenext two years will be to establishcomprehensive risk managementprograms for industrial enterprises (socalledUmbrella Coverage programs) andto develop customized plans for insuringclients’ businesses.Within the last year new insurance programswere offered to Tyumen OilCompany, Alfa Bank, Volga OJSC, Aeroflot,the Bosco di Chilieggi shopping chain aswell as to a number of other long-standingcustomers of the Group.More SimplicityNew products offered to theGroup’s individual clients in<strong>2002</strong>, in most cases could beissued in a few minutes by choosing arequired set of services and price levels. Atthe end of last summer, new propertyinsurance products ‘U Dachi’ and ‘AC-Universal’ were designed along with aseries of new personal insurance products.A significant advantage of standard retailinsurance products is that they can beoffered to prospective customers in placeswhere they find it convenient to purchase.To meet consumer expectations, inautumn <strong>2002</strong>, the Group’s 3rd party liabilityautomobile insurance became availableat TNK petrol stations. In addition, a fullrange of auto insurance products can bepurchased when buying a car in a numberof Moscow-based automotive salons.Additionally, when acquiring a plastic cardfrom Alfa Bank, a customer can opt forinsurance protecting against loss of thecard or unauthorized money withdrawal.Personal accident and travel insuranceproducts are also available in retail outletsof Alfa Bank. ‘AlfaMobile’ is another multipurposeprogramme jointly realized byAlfa Bank and AlfaInsurance.Mix of Risk Based Insurance Policies (ExcludingLife Insurance) Written by AlfaInsurance –End of <strong>2002</strong>78 %Property InsuranceSource: Company data6% 16 %Liability InsurancePersonal InsuranceMore Focus on ClientsDuring <strong>2002</strong> AlfaInsurance has continuedits geographical expansioninto Russia’s regions opening 7affiliates and 34 branches in Moscowregion, Cheboksary, Ufa, Kurgan,Nizhnevartovsk and several other areas.The Group’s products and services are nowavailable in 52 of Russia’s regions. In <strong>2002</strong>,the traditionally strong regional business ofthe Group increased by more than 60% andnow accounts for 25% of the corporateportfolio. Additionally, the Group has startedmassive IT infrastructure upgrades in anumber of key regional branches, whichwill ensure a high standard of service deliveredto customers throughout Russia.Market research suggests that nearly onehalfof potential customers of insuranceservices do not receive adequate productinformation. The continued developmentof the Group’s new retail network, whichstarted in <strong>2002</strong>, and careful shaping of theGroup’s new communications strategy,will address this problem. The marketingunit is working out the details of anappropriately targeted campaign and ishelping to create new products on thebasis of full-fledged research of the marketand consumer needs.Regional Network Growth - Number of Branch Offices at and of 1992-<strong>2002</strong>Source: Company dataMore TechnologyTo maintain a high quality of servicewhile intensively expandingthe business has become one ofthe Group’s top priorities. Significantfunds have been invested in the automationof business processes, upgrading theinfrastructure, shaping a unified informationspace and providing its informationsecurity.Round-the-clock support delivered byour corporate call centres is an absoluteprerequisite for customer satisfaction.This service is now available to all theclients insured under voluntary healthand vehicle programmes.Installation of SalesLogix, a customer relationsmanagement system, and developmentof specialised data processing systemsin voluntary health insurance (AVIS)and life insurance (Life Office) have contributedsignificantly to further developmentof customer relations. Similar technologicalimprovements are being implementedon the corporate side, includingimprovements in the integrated accountingand financial management systems.More ProfessionalismThe booming insurance market hascreated additional challenges forpeople engaged in this business.Last year a number of top professionalsfrom leading insurance companies andbanks as well as from global FMCG companiesjoined our management team.The Group’s well-balanced HR policy isbased not only on the recruitment ofleading experts in the industry but, firstly,on personal development of existing staff.In <strong>2002</strong>, a team from PricewaterhouseCoopershelped us to finalize amotivation system that covers mostemployees across the Group. Also, thefirst full-scale organisational appraisalwas conducted, which has enabled us tomake a correct assessment of availablehuman resources and to support the criticalbusiness areas.Advertisement of AlfaInsurance’s simple solutions.More ConfidenceAlfaInsurance Group’s long-termdevelopment plans are reinforcedwith a strategic investment programcovering the period through 2006.This program was approved by the Group’sshareholders in <strong>2002</strong>. The market developmentstrategy of AlfaInsurance combinesfurther development of products and distributionchannels, active expansion intoregions, optimisation of business processes,continued strengthening of the sales organisationand further cooperation with AlfaBank and the companies of Alfa Group.22 \ ALFA GROUP ANNUAL REPORT <strong>2002</strong> FINANCIAL SERVICES \ 23
ALFA GROUPANNUAL REPORT<strong>2002</strong>OIL production24 25Tyumen Oil CompanyHISTORYTyumen Oil Company (“TNK”) was formed as anopen-type joint stock company, by a governmentdecree in 1995. At that time, the Russian governmentwas the largest of TNK’s shareholders.In July 1997, 40% of the Company was placedin a privatization tender, which was won byNovy Holdings (a company jointly owned byAlfa Group and Access Industries / RenovaGroup (“AAR”)). Early in 1998, AAR shareholders’stake increased to 50.1% following thepurchase of 9% of TNK shares from privateholders and 1.1% in a specialised tender.In December 1999, when the Russian government,through privatisation tender, placed afurther 49.8% of TNK shares, AAR againwon the tender, bringing total joint ownershipin TNK to 99.9%. In February 2001,after completion of the terms of an investmentprogramme per the terms of the privatisationtender, AAR established full controlover TNK.By the end of 2001, TNK completed a singleshare swap whereby minority shareholdersvoluntarily swapped their ownership in TNK’sproduction subsidiaries for ownership in OAOTNK. Following the share swap, AAR ownedapproximately 97% of OAO TNK.In 2001, TNK International Ltd, (“TNKI”)was established as a holding company for purposesof consolidating ownership interest inOAO TNK and ONAKO Oil Company (an 85%stake was purchased at the end of 2000 for US$1.08 billion in a privatisation tender). In mid-<strong>2002</strong>, TNK International Ltd established anAdvisory Council, chaired by Sir Peter Walters,former Chairman of British Petroleum plc,whose mission is to oversee TNK International’sbusiness and corporate affairs, adviseTNK International’s shareholders on corporategovernance, strategic planning, investment andfinance activity, environment and securityissues.Established in 1995, Tyumen Oil Company (“TNK”) is today,one of the largest vertically integrated oil and gas companiesin Russia, ranking fourth in terms of production and third inproved oil reserves. TNK’s core businesses are oil and gasproduction, refining, and the marketing of crude and highquality oil products.www.tnk.ru, www.tnk.comwww.tnk-bp.com** From 1 September 2003 access to new information on TNK-BP appears on this web site.Company Structure & OperationsDownstreamTNK Presence in Russia and UkraineTNK International Ltd comprises the following:UpstreamTNK Volume of Crude Oil Production (‘ooo of barrels per day):TNKI is one of Russia’s largest producers of highquality oil products, ranking third in Russia by volumeof processed primary products, refining21.9 million tonnes of oil annually.■ Eight production units: Samotlorneftegaz,Nizhnevartovsk NP, Tyumenneftegaz, TNK-Nyagan, Yugraneft, TNK-Uvat, Orenburgneft,and Orenburggeologiya;■ Four refineries: Ryazan, Nizhnevartovsk,Lisichansknefteorgsintez (Ukraine), andOrsknefteorgsintez;■ Ten marketing and sales units:Kaluganefteproduct, Karelnefteproduct,Tulanefteproduct, Ryazannefteproduct,Kurskoblnefteproduct, Urals Oil Company,Megapolis, TNK-Stolitsa, Zapsibnefteproduct,and Orenburgnefteproduct;■ 1 Joint Venture: TNK-Texaco Lubricant Company.TNKI’s main production assets are located in westernSiberia’s Tyumen region where Russia’s majorhydrocarbon deposits are concentrated. The fieldsare highly productive and the crude has excellentphysiochemical properties, which makes for easiermanufacturing into environment-friendly oil productswithout requiring costly additional investmentin desulphurisation equipment.In <strong>2002</strong>, TNKI units produced 37.9 million tonnesof oil and 3.7 billion cubic metres of natural gas.Also, during <strong>2002</strong>, 248 new production wells werebrought on-stream while oil production costs werereduced from US $2.90 per barrel in 2001 to US$2.40 per barrel in <strong>2002</strong>.TNKI’s proved oil reserves are estimated at 1.15 billiontonnes and proved natural gas reserves at 114billion cubic metres.Source: Company dataA key aspect of TNKI’s operating strategy is the continuedexpansion in key oil products markets. In thedomestic market, TNKI aims to maximise sales volume,increase profitability and enhance its competitiveposition. This is being achieved by broadeningthe refined products range, raising the proportion ofupgraded refined products, improving the productsoffered to consumers, and by bringing quality intoconformity with the highest environmental standards.Also, the infrastructure and sales networks arebeing expanded by entering new market segmentsand by consolidating positions in new regions.Gasoline and diesel, produced at TNKI’s refineries,are sold both through a branded network of retail fillingstations and through the Company’s jobber network.In recent years, TNKI has managed tostrengthen markedly its positions in new regions, andtoday operates 1,400 filling stations across 16 ofRussia’s regions and in the Ukraine.
StrategyTNKI’s long-term corporate objective is to boost theCompany’s value by driving the maximum economic benefitfrom vertical integration, by improving production efficiency,reducing costs, and focusing production and marketingon competitive, value-added products. To deliver onthis challenge, a strategy has been developed which comprisesimplementation of the following objectives:Corporate Structure• To improve the Company’s structure by introducingan optimum management system and byenhancing corporate governance.Upstream• To enhance reserve quality and productivity byoptimising the asset portfolio, increasing outputgrowth, and restricting operating and capital coststo a level not exceeding the industry average;• To ensure conditions which promote realisationof the full value of natural gas assets.Downstream• To increase the proportion of exported oil and toenter promising Asian, Pacific and U.S. markets;• To maintain refining competitiveness by cuttingunit costs and upgrading capacity in order to boostproduction of light products and to continue tobring the quality of exported products into conformitywith European standards;• To improve the efficiency of oil product salesby increasing the proportion sold direct to theend consumer through extending and enhancingthe network of retail filling stations, enteringnew regional markets, and supporting thebrand image.Management• To develop and implement long-term environment,industrial safety, and labour protection programmesaimed at the continual integration of bestinternational standards;• To upgrade management, information and businesssafety technologies.Principal Developments in <strong>2002</strong> and Q1 2003■ In February 2003, Alfa Group, Access Industries / RenovaGroup and BP enter strategic partnership and announce theirintention to consolidate their Russian and Ukrainian oil assets;■ In January 2003, TNK wins the tender to act as RospanInternational’s management company;■ In December <strong>2002</strong>, TNK and Sibneft jointly participatedin the largest ever privatisation tender in Russia purchasing74.95% of Slavneft for US $1.86 billion. Sibneft and TNKsubsequently enter into a preliminary agreement to splitSlavneft’s assets. The transaction also envisages addressingthe issue of Sibneft’s stake in Orenburgneft (a subsidiary ofONAKO Oil Company);■ In November <strong>2002</strong>, the Company placed 5-yearEurobonds worth US $400 million (and an additional US$300 million in February 2003);■ In November <strong>2002</strong>, TNK wins the prestigious award forOutstanding Achievement in Corporate Governanceconferred by international energy journal Oil & GasInvestor;■In October <strong>2002</strong>, TNK makes its first oil delivery to theUnited States. Of the 140,000 tonnes delivered, 40,000 tonnesare used to replenish the U.S. Strategic Petroleum Reserve;■ In June <strong>2002</strong>, TNKI established the Advisory Councilemphasising the intention to meet the highest internationalstandards in corporate governance and financial management.The Advisory Council is chaired by Sir Peter Walters,formerly of BP.Advertisement stressing TNK’s commitment to product quality2627SIDANCO Oil CompanyEstablished in 1994, SIDANCO Oil Company together with itssubsidiaries is one of Russia’s largest vertically integrated oil andgas companies, ranking among the top-ten in oil production and5th in oil reserves. SIDANCO’s primary operations include oil andgas exploration, production and refining as well as oil and chemicalproducts distribution.* From 1 September 2003 access to new information on TNK-BP appears on this web site.www.sidanco.ruwww.tnk-bp.com*
28 29Company Structure and PerformanceManagementStrategySIDANCO has five main production companieswhich comprise: TNK-Nizhnevartovsk (formerlyChernogorneft, <strong>2002</strong> production – 6.8 milliontonnes) which also has a 50% share in two joint venturesadding almost 1.6 million tonnes in <strong>2002</strong>,UdmurtNeft (<strong>2002</strong> production – 5.05 milliontonnes), VaryoganNefteGaz (<strong>2002</strong> production –2.65 million tonnes), SaratovNefteGaz (<strong>2002</strong> production– 1.53 million tonnes), and NovosibirskNefteGaz(<strong>2002</strong> production – 0.24 milliontonnes). In addition the Company owns SaratovRefinery, which in <strong>2002</strong> increased its oil productsoutput by 13% up to 4.4 million tonnes as comparedto 2001 levels while improving its refining technology.The Saratov Refinery is working on an investmentproject to install a visbreaking unit to furtherboost the yield of light products.cost control and enhanced performance, overall liftingcosts were below <strong>2002</strong> plan at US $2.88 per barrel(plan US $3.10 per barrel).The reflection of the Company’s <strong>2002</strong> progress is a2003 performance plan, which targets an 11% oilproduction growth rate. The plan provides growththrough performance rather than acquisition.SIDANCO Volume of Crude Oil Production (in millions of tonnes)In late 1999, BP seconded a team of six seniormanagers with vast experience in the petroleumindustry to join the SIDANCO managementteam. Since that time, SIDANCO’s managementteam has grown stronger and is now supplementedby additional BP and Russianresource, particularly in key operational positions.The management team has been very successfulin driving the strategic objectives of theCompany, including the integration of advancedWestern practices in the context of best Russianexperience.The central aim of SIDANCO is to maximizeshareholder value. The Company has identified itscore strengths as hydrocarbon development andextraction and seeks to maximize its performance inevery aspect of this activity. Necessarily, a cornerstoneof this strategy is to focus on operationalexcellence. This obviously requires changing theway that SIDANCO does things and is currentlyembarking on a major change initiative in order toachieve its goals.Operationally, the Company is in the process ofchanging its structure and processes with a focus onperformance units of core production assets. Theseunits will be supported by other services, but whereverpossible, the Company seeks to concentrate onits core competencies.Other initiatives supporting operational excellenceinclude changing the management information systemsand processes to support greater transparencyin the business. In view of its strategy, the Companyfocuses on such important issues as health, safetyand environment. A major initiative has commencedto assess and improve SIDANCO’s safety performanceto world-class standards using the assistance ofDuPont, a recognized world leader in safety. Incooperation with IT Russia Services, a leader inenvironmental management, SIDANCO is implementinga monitoring and improvement system,which is designed to comply with ISO 14001.This change process obviously impacts people. InSIDANCO, the combination of key BP resourcesand Russian expertise is blended to make thechange process work from inside. This blend ofexpertise is working to improve processes andachieve operational excellence.SIDANCO’s retail network comprises 150 servicestations, located in the Saratov region, where itdominates the local market and in Rostov region,where it has good market position.In <strong>2002</strong> SIDANCO’s net revenues increased by 77%over 2001, to US $2.26 billion, which was a result ofincreased volumes due to return of TNK-Nizhnevartovsk into the Company’s structure.On a per barrel basis, total operating expensesdecreased from US $4.20 per barrel in 2001 to US$3.40 per barrel in <strong>2002</strong>. Due to Upstream’s focus onNote: TNK-Nizhnevartovsk and two joint ventures included from1 October 2001 and 1 January 2001, respectivelyAt 31 December <strong>2002</strong>, Alfa Group,together with its joint venture partnersAccess Industries / Renova Group(“AAR”) owned approximately 57%of SIDANCO alongside BritishPetroleum (“BP”), which held a 25%+ 1 share.With approximately 400,000 barrels per day production, SIDANCO ranksamongst the ten largest oil and gas producers in Russia, employing 29,000 people.SIDANCO’s upstream subsidiaries are currently developing over 120 fields locatedin Udmurtia, Saratov Oblast (Volga Region), the Khanty-Mansiysk AutonomousArea (Tyumen Oblast), and Novosibirsk Oblast in Western Siberia.
COMMODITIES TRADING3031Alfa-Eco GroupSince its founding in 1989 as a trading company within Alfa GroupConsortium, Alfa-Eco Group has established a large-scale, diversifiedbusiness engaged in the production and trade of a wide rangeof finished goods and raw materials in domestic and internationalmarkets. These include oil and oil products, coal, metallurgicalproducts, pulp and paper products, agricultural and food products,alcoholic beverages, and others. In addition, the Group has made asignificant strategic investment in telecommunications.www.alfaeco.ruAlfa-Eco GroupAs one of the leaders inRussian business, theAlfa-Eco Group (“Alfa-Eco” orthe “Group”) has recentlybegun implementing a refinedstrategy based on large-scaleinvestment in growing sectorsof the Russian economy andmanagement of industrial assets.Accordingly, one of theGroup’s top priorities in recentyears has been the acquisitionof promising companies. Uponacquiring a company, Alfa-Ecobrings in highly-experiencedmanagers who introduce advancedmanagement, marketingand operating practices,and carry out restructuringand modernization programmesaimed at increasing thecompany’s production, bolsteringits market positionand, ultimately, enhancing itsinvestment attractiveness andvalue.Investments in Some of the Alfa-Eco Group’sCurrent Projects (USD mln)Investment ActivityThe Group has unmatched experiencein the field of investmentprojects, having implemented a wideseries of well-publicised investmentprogrammes with extremely positiveresults. Just in the past several years,Alfa-Eco has successfully completedmanagement and investment projectsat such leading Russian enterprisesas the Achinsk AluminiumRefinery, the West Siberian MetallurgicalComplex, the Taganrog MetallurgicalPlant, the Korshunovsky OreMining and Enrichment Plant andothers. Several of the early projectswere later spun-off as separate businessunits, including within the structureof the Alfa Group Consortium,Tyumen Oil Company, the Perekriostoksupermarket chain, and UnitedFood Company.Alfa-Eco’s success is rooted in a clearcompetitive advantage. The Group hascreated a team of highly professionalinvestment managers, who are capableof efficiently running enterprises invarious industries, have in-depthknowledge of the specifics of Russia’sregional markets and the ability toreact quickly and appropriately tochanges in these markets, and areable to build mutually beneficial relationshipswith clients. This combinationof qualities makes it possible toprecisely identify the most promisingprojects and carry out transactions of ahighly complex nature.Over the past three years, investmentsin completed transactionsamounted to over US $400 million,while their average internal rate ofreturn was around 450%.Currently, the Group’s principalinvestment projects are being developedin telecommunications, pulpand paper, fuel and energy, agricultureand food processing, metallurgyand alcoholic beverages industries.Internal Rate of Return (IRR)* for Selected Recent Exits of InvestmentProjects Completed by Alfa-Eco Group*Note: Calculation performed using a method developed by the European Venture CapitalAssociation (EVCA) and based on audited accounts (unless otherwise noted)**Note: Calculation based on unaudited data.
TelecommunicationsPulp and Paper and Forestry ProductsThe Group manages a blocking votingstake in cellular communicationsprovider VimpelCom (brandnames: BeeLine, Bee+) and its subsidiaryVimpelCom-Region. Overall, theGroup has invested US $250 million inthis project, making it the largest dealin the industry.Alfa-Eco plays an active role in themanagement of both companies.Thanks in no small part to the effortsof Alfa-Eco managers, VimpelComhas succeeded in considerablyexpanding its presence in Russia’sregions. At the end of <strong>2002</strong>, theBeeLine network operated in 40regions of the Russian Federation (in43 regions as of March 2003), andwas intensively engaged in buildingnew networks. Starting in 2003, thecompany has begun penetrating twomore major Russian regions: theNorthwestern and Urals FederalDistricts. The priority strategic goal isto extend the network’s license zoneto cover the entire country.Since Alfa-Eco began participating inthe management of VimpelCom andVimpelCom-Region, the BeeLine network’ssubscriber base has grownfrom 1.11 million in May 2001 to2.11 million by the beginning of <strong>2002</strong>and to 5.15 million at the end of<strong>2002</strong>. In March 2003, the number ofsubscribers reached 6.15 million.VimpelCom’s market capitalizationincreased from US $806.8 million(May 2001) to US $1.4 billion at thebeginning of <strong>2002</strong> and to US $1.7 billionat the end of <strong>2002</strong>. In April 2003,the company’s capitalization stood atUS $1.9 billion.When Alfa-Eco initially invested inthe project, VimpelCom’s stock(Level 3 ADR) was trading on theNew York Stock Exchange at US$15 per share, whereas by 31December <strong>2002</strong> the stock pricehad more than doubled to US$32.01 and has since grown evenfurther, reaching over US $36 byearly April 2003.Growth in VimpelCom Performance Indicators Since Alfa-Eco Group Began Investing in May 2001May 2001 December <strong>2002</strong>Number of subscribers (mln) 1,114 5,153Market capitalization (USD mln) $806.800 $1,669.3Share price of Level 3 ADRon the New York Stock Exchange (USD)$15.000 $32.01In <strong>2002</strong>, Alfa-Eco continued tomanage the Balakhna Pulp andPaper Mill (OAO Volga). The Groupgained management control whenthe enterprise was in technicaldefault on debt payments. A team ofAlfa-Eco managers has since optimisedthe plant’s financial position.In <strong>2002</strong>, the plant enjoyed stableoperations and is now an industryleader. Volga manufactures over 30%of all newsprint in Russia. In <strong>2002</strong> itproduced 530,000 tonnes of goods.Around 70% of the plant’s paper isexported to 52 countries around theworld, with the bulk of exports goingto the European Union. Leading publicationsin Great Britain, France,Germany, Italy and other countriesare printed on paper from Balakhna.The volume of Alfa-Eco’s aggregateinvestment in this project amounts toUS $54 million.During the reporting year, following asale at auction, Alfa-Eco became the100% owner of the Kamsk Pulp andPaper Mill (OAO TsBK “Kama”, PermRegion). Only a few months after Alfa-Eco managers took control of theenterprise, the Kamsk Mill significantlyincreased the volume of production.The company is now developinga technical upgrade programmefor the plant.The aggregate output of the Balakhnaand Kamsk pulp and paper mills givesAlfa-Eco control over approximately40% of Russia’s newsprint production.32 33In <strong>2002</strong> the Group had export contracts for the delivery of approximately 7 million tonnes of oil and oil products to international markets, includingshipments of around 1.3 million tonnes of oil under the UN Security Council’s Oil-for-Food program for Iraq.During the reporting year, Alfa-Eco continued to manage ZAO Petrosakh, a vertically integrated oil company on Sakhalin (the Group manages a97% equity stake in the company). Petrosakh delivers its output to countries in the Asia-Pacific region and also to Sakhalin’s energy needs.Energy ResourcesIn the fall of <strong>2002</strong>, a marine seismic survey was conducted, jointly with the Norwegian firm PGS, of the Sakhalin-6 oil-and-gas field located onthe island’s continental shelf. Petrosakh holds a license for the geological exploration of the field, which boasts potential reserves of around 1billion tonnes. Alfa-Eco is now working on creating an international pool of investors to develop the field. The size of the investment is estimatedat US $1.5 billion.In <strong>2002</strong> Alfa-Eco continued its activities on the coal market. The company supplied coal from Siberian and Far Eastern coal basins primarily tohousing authorities and public utilities in a number of regions as well as under the programme to deliver supplies to Far Northern territories.
MetallurgyAlcoholic BeveragesThe Alfa-Eco Group has had anactive presence in the metallurgicalsector for many years. In recentyears, Alfa-Eco has successfullyimplemented an entire series of projectsat some of the country’s largestmetallurgical enterprises.During the reporting year, the Tagmetproject was completed (TaganrogMetallurgical Plant, in which Alfa-Ecoconsolidated a 42.2% equity stake).Tagmet, in which the Group hasrecently played a management role, isthe country’s top producer of highqualityrolled pipe. Tagmet has anannual production volume of 460,000tonnes and posted a net profit ofapproximately US $50 million on salesof around US $170 million. Alfa-Eco’sinvestment in the project amounted toUS $27.5 million. In the fall of <strong>2002</strong>,the Group’s equity stake in the plantwas sold to the MDM Group.The Group continued to develop theSibelectrostal program (a Krasnoyarskmetallurgical plant; Alfa-Eco, jointlywith the regional administration, is theprincipal owner of OAO SibelectrostalMetallurgical Plant). This unique productionfacility manufactures specializedand high-alloy steels. However,having been established originally asa scientific pilot enterprise, the plantwas unable to compete under marketconditions. Alfa-Eco managers havesucceeded in bringing the enterpriseout of its long-standing crisis by terminatingbankruptcy proceedings, reachingan amicable agreement with creditors,replenishing the plant’s orderbook, and more fully utilizing its productioncapacity.For nearly a decade, Alfa-Eco hasheld a leading position in the Russianalcoholic beverages market.Alfa-Eco manages the Trading Housefor Reviving the Traditions of P.A.Smirnov, Purveyors to the Court of HisImperial Highness, which holds therights to the internationally acclaimedSmirnov brand of vodka. At the St.Petersburg Wine and Vodka Fair-<strong>2002</strong>,Smirnov was awarded gold medals inthree nomination categories, and inearly 2003, won a gold medal, two silvermedals and two bronze medals atthe 10th international exhibitionProdexpo-2003 in Moscow.Alfa-Eco is intensifying its program topromote the Smirnov brand, having significantlyincreased the product rangeand sales volume of its own productionand also under a franchising program.Many distillers, particularly in theregions, have expressed great interestin the Smirnov brand. In 2003, overallsales are expected to increase up to 31million bottles, including up to 27 millionbottles under the franchising programand up to 4 million bottles of theGroup’s own output.The Armenian cognacs marketed byAlfa-Eco are also renowned for theirhigh quality. At the St. Petersburg Wineand Vodka Fair-<strong>2002</strong>, the Grand GoldMedal was awarded to “1700” Cognac,a special brand bottled in honour of the1,700-year anniversary of Christianityin Armenia, and the gold medal went to“Gyumri” Cognac, both in Alfa-Eco’sportfolio of brands. In <strong>2002</strong>, on thestrength of its own “Armina” brand, theGroup was rated as one of the top threeleading companies in the Russian marketfor Armenian cognac with a 10%market share.In <strong>2002</strong>, Alfa-Eco delivered 2.5 millionbottles of wine and cognac fromMoldova, Georgia and Armenia.The Securities MarketAlfa-Eco has been an active participantin the Russian securitiesmarket since 2001, when itplaced an issue of its own promissorynotes (the issuer was one ofthe principal companies in theGroup, OOO Alfa-Eco M). This issuerepresented one of the first successfulfinancial instrumentsissued by a Russian industrial-andtradeconcern.Food ProductsIn <strong>2002</strong>, Alfa-Eco increased thevolume of grain sales and transshipmentsto nearly 250,000tonnes, or 2.5 times more than in2001. Since last year, the Group hasparticipated in the management ofseveral grain silos in Siberia and,since early 2003, in a Rostov-on-Donbaked goods plant (one of the country’sbest producers of top-qualityflour, with an export transshipmentvolume of 1 million tonnes) as wellas other processing plants in theRostov region. The Group intends toacquire several similar plants in thesouth of Russia.During <strong>2002</strong>, Alfa-Eco maintainedthe volume of meat deliveries andsales at a level exceeding 10,000tonnes, thus preserving its positionin the market as one of the leadingsuppliers of meat from Mongolia.The Group also supplied meat forRussia’s federal reserves in <strong>2002</strong>.Alfa-Eco is well positioned in thefood market for the year 2003, partlyowing to framework agreementswith the Moscow City government tosupply grain and meat for cityneeds.In <strong>2002</strong>, OOO Alfa-Eco M continuedto successfully place promissorynotes in the open financial market.In October of the reporting year, itissued a rouble-denominatedbond. The volume of the first bondissue amounted to RUR 800 million.Alfa-Eco M has been rankedamong the most reliable promissorynote issuers by NAUFOR, alongwith major Russian corporationsand banks.Alfa-Eco’s securities fully meet theexpectations of the most authoritativeinvestors in the market andprovide an excellent vehicle fordiversifying sources of financing.Many banks, investment houses,insurance companies and pensionfunds have included these securitiesin their investment portfolios.34 / ALFA GROUP ANNUAL REPORT <strong>2002</strong> COMMODITIES TRADING / 35
Trade House PerekriostokAlfa Group took a strategic decisionin 1994 to establish Trade HousePerekriostok (“Perekriostok”).The principal objective of Perekriostokis to provide middle-income customerswith a wide range of highqualitygroceries at reasonableprices in a pleasant modern shoppingenvironment with efficient andhigh-quality service.From the very beginning Perekriostokhas pursued a strategy of building andleasing stores in the suburban areas ofMoscow. This is where the vastmajority of Muscovites live, but theinfrastructure and amenities in thesuburbs are typically much lessadvanced than in downtown areas.Since Muscovites, like any other largeHistoryWith its origins in trading, AlfaGroup was well positioned to meetthe demands for Western style shopping,as a new middle class emergedfrom post-Soviet society eager andable to buy high quality goods.Perekriostok opened the doors of itsfirst supermarket in September 1995.In 1996, soon after the start of operations,the Company receivedimportant support from worldwidecredit and financial institutions,including the European Bank forReconstruction and Development,and continues this co-operationtoday. In the summer of 1998Perekriostok opened its own distributioncentre providing significantand unprecedented cost and logisticaladvantages. In April 2003, theCompany attracted its first outsideinvestment – a 7.7% stake in theCompany was sold to portfolioinvestor Templeton Strategic EmergingMarkets Fund LDC.Today, the Company owns and operatesapproximately 50 modern supermarketsand one hypermarket in Moscow,St. Petersburg and its immediateregions, operating under the tradenames “Perekriostok” and “Perekriostok-Mini.”It is the largest supermarketchain in Moscow, with most storesoffering shoppers more than 18,000high-quality products (more than35,000 products at the hypermarket)at competitive and affordable prices.Concept & StrategyGrowth in Number of Perekriostok Stores (at year end)Source: Company datacity dwellers, prefer to shop close tohome, there is an enormous captivemarket for Perekriostok stores.Each Perekriostok is a modern, westerntype store with many resemblinga kind of “shopping city,” where customerscan purchase not only foodproducts but also other goods rangingfrom magazines to fresh-cutflowers. Additionally, many supermarketsoffer dry-cleaning, beautysalons, and photographic processing,and even major appliances atthe hypermarket. Each store hasscanner check-outs, which save customersprecious time.Perekriostok’s pricing policy is simple- to provide customers withvalue for money. This is possiblethrough the careful sourcing of localproducts and the very significantcompetitive advantages provided bythe Company’s distribution centre.Direct deliveries and large-volumeProductsPricingConsumersPerekriostok supermarkets providecustomers with one of the widestselections of food and other products,sourced both domestically and internationally.In addition to stocking allthe standard supermarket lines,Perekriostok stores have delicatessencounters with a wide range of readyto-cookand ready-to-eat items,including more than 360 differentkinds of meat and fish. Additionally,many of the supermarkets have an instoremini-bakery which provides aselection of more than 40 kinds ofbread. The Company also has itsown private-label branded line ofhigh-quality goods, which it offers toconsumers. Recently, the Companylaunched a “Healthy Meals” program,which it developed in connectionwith the Russian Academy ofMedical Sciences, which is aimed atpromoting healthy eating habitsamong its customers.purchases considerably cut productcosts. This translates directly toaffordable and very competitiveprice levels in all of the Company’ssupermarkets. Also, the Companymakes use of a well-developed discountprogram to attract customersand retain their loyalty.The overall aim of the Perekriostokconcept is the complete satisfactionof customers living in the communitiesadjacent to the supermarkets. Atthe same time the stores cater to theneeds of “transit” shoppers – that is,people who pass in their cars anddecide to stop and make a purchase.To accommodate this importantsegment of shoppers, convenientparking areas have been createdat each store.Regular market research helps toidentify the needs and desires of customersand is used to define productand pricing policies, elements of serviceand even store layout and design.PersonnelPersonnel are the cornerstoneof any retail business,and this is particularly truein Russia, where the hiringand retaining of appropriatestaff takes on an added significance.Since its inception,Perekriostok hassought to hire high-calibrepersonnel who not onlyhave practical knowledgeof the peculiarities of theRussian retail market butalso possess Western managementskills. As there is ashortage of specialists whomeasure up to thesedemanding criteria, theCompany has developed anefficient training system,which provides for thequick mastering of essentialskills for new recruits.Perekriostok has its owntraining centre, where newemployees attend both theoreticaland practicalcourses. In addition, membersof senior and middlemanagement regularly travelto relevant trainingcourses abroad. TheCompany also actively usesthe services of Westernconsultants to introducestate-of-the-artoperatingtechnologiesandmanageme n tpractices.Perekriostok Store Locations in Moscow and Moscow’s Regions (June 2003)Further DevelopmentMay of <strong>2002</strong> marked the opening of the Company’s first hypermarket. Located in a high-traffic area ina new building with over 130 boutiques, restaurants and a 6-screen cinema, it has a trade area of7,000 square meters. October <strong>2002</strong> marked the opening of the Company’s first supermarket outsideof Moscow, in St. Petersburg, with plans for further development in St. Petersburg. TheCompany is in process of aggressively expanding into Southern Russia and Russia’s Volga region where there isa rapidly growing demand for western-style supermarkets. The Company, during 2003, will also introduce a newconvenience-store format in suburban, and later in central Moscow and will also continue further expansion ofsupermarket and hypermarket format shops in the Moscow region.As one of the first movers into the Russian retail sector, Perekriostok continues to strengthen and expand its positionon the Russian market. Creating a market leader in the retail trade sector in Russia requires a long-term perspective,solid sources of financing and reliable partners. Perekriostok is proud of its successful co-operation withits many different partners. Today, Perekriostok is rightfully considered as one of the most competitive and efficienttrade structures not only in Moscow but throughout the whole of Russia.38 A L F A G R O U P A N N U A L R E P O R T 2 0 0 2 R E T A I L T R A D E 39
Telecommu nicationsALFA GROUP ANNUAL REPORT <strong>2002</strong>Golden Telecom, Inc.Golden Telecom, Inc. (“Golden Telecom” or the “Company”) is the largest independentfacilities-based provider of integrated telecommunications and Internetservices to businesses and other high-usage customers and telecommunications operatorsin major population centres throughout Russia and other countries of theCommonwealth of Independent States (CIS).CustomersShareholderswww.goldentelecom.ruGolden Telecom’s customersinclude large, medium and smallRussian companies, large transnationalcompanies, business centres,hotels, fixed line, mobile and pagingoperators, banks, financial institutions,embassies and representativeoffices of foreign companies.The Company makes use of its ownbackbone fibre optic network inMoscow, St. Petersburg, NizhnyNovgorod and Kiev which isaccessed using fibre optic, copperwire, and microwave and fixed wirelesslines.Golden Telecom was incorporatedas a Delaware corporation on 10June 1999 and is listed on NASDAQunder the symbol “GLDN.” Currentshareholders of Golden Telecomrepresent a balanced mixture ofstrategic and financial, bothRussian and international investors.Current Shareholders as at 30 May 2003Alfa Group 39%Capital International 8%Barings Vostok 9%EBRD 11%Management 3%Free float 15%Rostelecom 15%StructureGolden Telecom consists of two major operating companies,Sovintel and Golden Telecom (Ukraine), and conductsits business in Russia and the CIS through a networkof affiliated or controlled structures. Other than inMoscow, the most significant branches are those in St.Petersburg, Arkhangelsk, Khabarovsk, Irkutsk and Ufa.The leading regional joint ventures are situated in NizhnyNovgorod, Novosibirsk, Vladivostok, Ekaterinburg,Krasnodar, Volgograd and Samara. The Company alsooperates in Azerbaijan, Belarus, Georgia and Uzbekistanthrough agents and distributors, and has presence inKazakhstan through its wholly owned subsidiary.SovintelEDN Sovintel LLC was established in1990 as a competitive localexchange carrier in Moscow in theform of a 50/50 joint venturebetween Global TeleSystems, Inc.(GTS) and The Main Centre forManagement of Long-DistanceCommunications of USSR (GTsUMS).GTsUMS subsequently became partof Rostelecom - the Russian nationallong distance carrier. From its earlydays, Sovintel was positioned as asuperior voice service provider with afocus on the high-end of the corporatemarket. Sovintel expandedquickly and established a strong bluechip customer base and a stellar reputationfor customer service. GTS’holding in Sovintel was transferred toGolden Telecom, Inc. as part of theGolden Telecom IPO in 1999. InSeptember <strong>2002</strong>, Golden Telecombought the remaining 50% of Sovintelfrom Rostelecom.Golden Telecom (Ukraine)LLC Golden Telecom (Ukraine) commencedservice in 1997 as a competitivelocal exchange carrier in Kievand as a provider of mobile services.Today, Golden Telecom (Ukraine) isthe leading provider to corporate customersin Kiev and has a substantialpresence in all major regional centresof Ukraine.40 Alfa Group <strong>Annual</strong> <strong>Report</strong> <strong>2002</strong> Telecommunications 41
ServicesGolden Telecom surpasses all competitors in its CIS coverage for advanceddata services and provides a fully integrated telecom solution to businesscustomers throughout Russia and the CIS. Golden Telecom has built itsbusiness services strategy around a simple philosophy: to consistentlyenhance and expand the range of service offerings to the existing customerbase.Golden Telecom’s solutions typically include:To business customers:• Local numbers and lines, local,domestic long-distance and internationaldigital voice services;• Private lines;• Dedicated Internet access;• Design, installation and managementof private data networks;• Call centre servicesTo cellular operators:• Local numbers and connectionlines to the Public SwitchedTelecommunications Network(PSTN), local, domestic long-distanceand international trafficcarrier servicesTo international carriers:• Voice traffic termination in Russiaand the CIS;• Capacity resaleTo smaller fixed-line operators:• Local, domestic long-distanceand international traffic carrierservices;• Voice over Internet Protocol(VoIP) traffic termination;• Broadband IP connectivityTo consumers:• Dial-up Internet access;• Pre-paid calling cards<strong>2002</strong> Financial ResultsGolden Telecom demonstrated strong financial results in <strong>2002</strong>.Consolidated revenue was US $198.7 million, an increase of 42% over2001. Revenue from data and Internet access services increased by 25%to US $78.9 million in <strong>2002</strong>. Earnings before interest, tax depreciation andamortization (EBITDA), an important indicator of the Company’s financialhealth, grew by 124% against 2001 and reached US $61.4 million in <strong>2002</strong>.Consolidated Revenue (in USD mln)Source: <strong>Annual</strong> audited US GAAP standalone financial statementsConsolidated Revenue (% contribution by each segment)StrategyThe Company’s objective is tobe the leading independentvoice, data and Internet servicesprovider in Russia and theCIS. To achieve this objective,Golden Telecom intends to:•Pursue ConsolidationOpportunitiesThe Company intends to pursueconsolidation opportunitiesthrough acquisitions that willallow the Company to improveand expand its service offeringsand maintain operational control.The Company will targetcomplementary opportunitiesthat will enable the achievementof synergies and economies ofscale.•Increase Market Share byOffering Bundled Data andVoice Services Over anIntegrated NetworkCorporate customers increasinglydemand integrated telecommunicationssolutions from one-stopproviders that are able to deliver afull service offering in the geographicalareas in which thesecorporate customers operate. Asa result, the Company plans tocontinue to develop and combineits businesses to create a unifiedservice platform for local access,local exchange, domestic andinternational long distance, data,Internet access and services withturn-key solution.•Extend Our Leading Positionin High Growth Data andInternet MarketsThe Company plans to build on itsposition as a leading provider of dataand Internet communication servicesin Russia and other countries of theCIS by increasing the number of networkaccess points in its network tofacilitate the growing demand for dataand Internet communications.• Reduce Operating Costsand Satisfy Capacity Needsthrough Network Planningand OptimisationThe network strategy of theCompany includes building andowning its local exchange andcustomer access networks. TheCompany has entered into longtermleases for long-distance andinternational fibre optic cable systemsto provide its regional andglobal connectivity, supplementingthese leased land-basedchannels with satellite circuits forredundancy and remote connectivity.Golden Telecom intends toincrementally expand the fibreoptic capacity along its heavy trafficand high cost routes to reduceits unit transmission costs andensure sufficient capacity to meetthe growing demand for data andInternet services. Wherever possible,the Company targets customersand products to fullyutilise existing fixed cost networkinfrastructure.•Focus Operating Activitiesand Capital Investments inMajor Metropolitan AreasThe Company plans to deploy itscapital investments primarily inMoscow, Kiev, St. Petersburg,Nizhny Novgorod and othermajor population centres in theCIS, where demand for the servicesis most heavily concentrated.The Company also intends toexpand its operations in regionalcities with sufficiently stronglocal economies and wherepotential exists to grow businesses,which complement itscurrent operations.Market PositionGolden Telecom occupies a leadingposition in Russian and CIS telecommunications.The Company is thelargest alternative operator inRussia, with an approximate 25%share of the corporate market.Moscow is the primary base ofGolden Telecom operations with75% of the Company’s revenuesgenerated in Moscow and St. Petersburg.Golden Telecom also occupiesa leading position in the Dial-UpInternet Access consumer market,throughout Russia. No other alternativeservice provider commandssuch a strong presence in all of thesemarkets simultaneously.Golden Telecom is the number twoprovider in St. Petersburg’s corporatemarket and number one amongalternative network providers inNizhny Novgorod.In Ukraine, LLC Golden Telecom(Ukraine) is the largest independentfixed-line operator and operates inall major Ukrainian cities.Source: <strong>Annual</strong> audited US GAAP standalone financial statementsVimpelComCompany ProfileVimpelCom is a leading provider of wireless telecommunicationsservices in Russia, operating under the “Bee Line” brand, whichis one of the most recognized brand names in Russia. TheGroup’s license portfolio covers approximately 92% of Russia’spopulation (134 million people), including Moscow and St.Petersburg.www.vimpelcom.comVimpelCom has always been apioneer in wireless telecommunicationsin Russia and is a marketleader in offering the latest invoice communications technologyand data services, includingwireless “infotainment” services,location-based services, mobileportal and wireless Internetaccess through “BeeOnLine.”The Company provides GPRS(General Packet Radio Services)with per byte billing and GPRSroaming capabilities.At the end of <strong>2002</strong>, VimpelCom’stotal subscriber base wasapproximately 5.15 million, withapproximately 3.71 million subscribersin the Moscow licensearea and 1.44 million subscribersin the regions outside ofMoscow.VimpelCom was the first Russiancompany to list its shares on theNew York Sock Exchange(“NYSE”) in November 1996.VimpelCom’s ADSs are listed onthe NYSE under the symbol “VIP.”VimpelCom was also the firstRussian company to issue USSEC-registered convertible notesin July 2000. VimpelCom’s convertiblenotes are listed on theNYSE under the symbol “VIP 05.”42 Alfa Group <strong>Annual</strong> <strong>Report</strong> <strong>2002</strong> Telecommunications 43
<strong>2002</strong> Financial Highlights<strong>2002</strong> was, in every respect, the most rewarding year for VimpelCom. On the wave of its success in 2001, theCompany continued intensive growth and expansion, exceeding market expectations. For the year <strong>2002</strong>,VimpelCom reported net operating revenues of US $768.5 million, an 82% increase from 2001; operating incomeof US $224.8 million, a 158% increase from 2001; and net income of US $129.6 million, a 174% increase from2001. In <strong>2002</strong>, the Company generated approximately US $221.7 million operating cash flows, and the balancesheet was strong.Subscriber Growth (# of customers) in MoscowConsolidated Total Operating Revenue (in USD mln)Source: Company dataSource: <strong>Annual</strong> auditedUS GAAP standalonefinancial statementsThe Strategy for 2003 and BeyondVimpelCom’s objective is to becomeRussia’s leading telecommunicationscompany, providing mobile voice anddata services. VimpelCom’s strategyaims at securing long-term profitablegrowth for the Company with a dedicatedfocus on service quality andproduct innovation.As Moscow gradually approachessaturation, VimpelCom will strive tofurther improve the profitability of itsMoscow operations, to secure theloyalty of its existing subscribers aswell as to continue to grow its customerbase.At the same time, further growth incellular business will primarily comefrom the regions. Accordingly,VimpelCom, in its drive to become afull-fledged national operator, willcontinue its expansion, providingcoverage and services to a substantialpart of the 117 million people inits licensed territories outside ofMoscow.The two basic premises ofVimpelCom’s national expansionstrategy are (i) to build a unified networkacross Russia with the samebusiness processes and solutionsfor network operation and control, IT,marketing, distribution, customerservice and billing; and (ii) to employprimarily organic “greenfield” growthaugmented by selective acquisitions.VimpelCom sees this approach asthe most cost-efficient way of buildingits business nationwide, withmaximum utilization of economiesof scale.Advertisement of “SuperGSM” tariff plan targeting business users.44 Alfa Group <strong>Annual</strong> <strong>Report</strong> <strong>2002</strong> Telecommunications 45
Companies thatare good corporatecitizens aremore likely to bebetter financialperformers*SOCIETYourWhen corporationsare goodcitizens,business riskdecreases – forboth large andsmall firms*46ANNUAL REPORT<strong>2002</strong> ALFA GROUP47Serving OurCommunitiesAlfa Group and its companies strive to achieve leadership as trusted partners and good corporatecitizens. We seek to realise our business objectives, but we strive not to lose sight of theimportance of giving back to the society and communities in which we do business.Over the years, our efforts have focused on sponsoring educational programs, cultural initiatives,sporting events, providing humanitarian aid, donating to the Russian Orthodox Church and investingin the regions where our employees reside. During <strong>2002</strong>, our companies donated over US $7.4million worth of funds, goods and services to worthwhile causes. We are committed to both anactive involvement in large-scale events and projects, and to targeted smaller contributions toenhance individual opportunity. We help to open the doors to people in our communities to variouseducational pursuits, and support diverse cultural and art institutions in order to promote anoverall better quality of life. We conduct our business in ways that protect and preserve the environmentand meet or exceed health and safety standards.We take our moral obligations to society seriously and are proud of the level of sponsorship andcommunity service that we have achieved. Nevertheless, we do not intend to rest on our laurels.We will continue to seek out new ways of helping the people of Russia, supporting Russia’snational culture and heritage, improving the lives of our employees and their families. In doingthis, we create a better future for both the Alfa Group and our communities.* Dr.Marc Orlitzky. Corporate social responsibility and financial performance: A meta-analysis. Organization Studies, 24:3, pp. 403-442. Orlitzky, M., Schmidt, F. L., & Rynes, S. L. (2003).EducationSupportand TalentDevelopment■ Alfa Bank has launched the secondphase of its Alfa Chance programmethat provides scholarships to talentedhigh school graduates from the Russianregions to study in the top universitiesof Moscow and St.Petersburg.■ Since <strong>2002</strong>, Alfa Bank has supporteda 12-year old World and EuropeanChess champion Yan Nepomnyaschyfrom Bryansk: the Bank is assisting Yanin preparing for championships and haspresented him with a computer.■ Trade House Perekriostok acts as thegeneral sponsor of the “Mosaica” children’sdancing troupe.■ Alfa-Eco Group sponsors schoolsand special needs boarding schools inSakhalin and Perm region.■ TNK funds creative workshops insecondary schools as well as anti-drugeducational programmes, includingsubsidising school supplies purchaseswith anti-drug messages.■ SIDANCO’s regional funds financesetting up of computer classes withInternet access in Saratov, Udmurtiaand Tyumen areas; support ethnic educationof local indigenous nations inKhanty-Mansiisk area and donatemoney to Saratov University to purchasescientific equipment. SIDANCOhas also sponsored an educationalevent for Moscow schoolchildren at theDarwin Natural History Museum.
Support of Culture and National Heritage■ During its 12 years of operation, Alfa Bankhas been an active patron of large scale projectsaimed at preserving national historic, culturalmonuments and art treasures. Among the majorprojects of <strong>2002</strong> are the following:● As a Trustee of Bolshoi Theatre, Alfa Bank has contributedto major performances, including BorisGodunov and the Magic Flute; organised regionalconcerts of the Bolshoi Theatre and donated proceedsto the local municipalities, and provided fundsfor Western pop-star concerts and art exhibits acrossRussia and organised the tour of La Scala in Moscow.●Alfa Bank provided financial assistance to theMoscow performances of Toska by Rome Opera,St.Petersburg Philharmonic Orchestra conductedby Yuriy Temirkanov, Boris Eifman’s Ballet theatre,All-Russia theatre festival Golden Mask, concertsof Spivakov’s Moscow Virtuosy in London’s RoyalFestival Hall, December Evenings by SvyatoslavRichter in Russia, Paul McCartney’s performancein Moscow’s Red Square as part of his EuropeanTour “Back in the World 2003” and exhibition ofRussian suprematist artist, Kazimir Malevich in theSolomon R. Guggenheim Museum in New York.●Alfa Bank also offers generous support to publiccharities and associations that develop creativephoto artists and hold annual photography contests.●Alfa Bank’s regional branches sponsor an art festivaland a children’s talent music festival in NizhnyNovgorod, international Nordic Holiday inMurmansk.■ In <strong>2002</strong>, SIDANCO sponsored internationalmusic festival “Music Kremlin” in Moscow,inter-regional film festival in Khanty-Mansiisk,and construction of a circus building in Izhevsk.■ Under Golden Telecom’s support “VanityCase” exhibitions and master-class of thefamous designer Philip Stark were held inMoscow in <strong>2002</strong>.■ VimpelCom and Alfa-Eco Group have a longhistory of providing financial support to variouscultural events in Moscow and Russian regions.Humanitarian Activities■ Alfa Bank could not remain indifferent to the victims of theNord-Ost hostage crisis. The Bank contributed to the charitabledonations alongside other members of the Russian Unionof Industrialists and Entrepreneurs, and Perekriostok donatedfood supplies to the anti-terrorist squad.■ Perekriostok provides food and financial assistance to variouscharity foundations, flood victims, children’s hospitals,schools and orphanages.■ Perekriostok and TNK collect Christmas presents and holdnew year parties for children at schools and boardingschools.■ Monthly monetary assistance is provided by Alfa-Eco Group,Perekriostok, TNK and SIDANCO to municipal departments ofsocial services, orphanages, hospitals and clinics, veterans’organisations, military units, families of victims of militaryconflicts in Moscow and other towns across Russia.■ Perekriostok operates donation points for the MoscowPatriarchate and the Red Cross at its supermarkets; Alfa-EcoGroup donates to the Moscow Patriarchate and contributes tothe construction of a chapel in Pravdinsk; SIDANCO financesreconstruction and renovation of Russian Orthodox churchesin Izhevsk.Environment,Health and Safety48 49InitiativesSporting■ TNK's commitment to environmentalconservation principles is reflected in largescaleprojects for the development of theSamotlor oil field and upgrade of the Ryazanrefinery. TNK is the first Russian company tomake products in compliance with strictEuropean ecological standards, such as fullynon-ethyl petrol with high oxygen percentageand low-sulphur diesel fuel.■ TNK and Alfa-Eco Group are in theprocess of ISO quality certification for productquality, environmental management andmanagement systems.■ Since <strong>2002</strong>, TNK is developing ecologicalperformance criteria for its subsidiaries inaccordance with ISO 14000, and structuringan implementation programme planned to becompleted by June 2005.■ Alfa-Eco Group’s managed companies inpulp and paper, metal and oil industries, havesignificantly improved emission levels, wasteutilization and are in compliance with environmentalregulations.■ As a member of World Wildlife Fund, AlfaBank regularly contributes to nature conservationinitiatives.■ In March <strong>2002</strong>, Alfa Bank made a donationto Moscow’s North-East Administrativedistrict for nature conservation purposes.■ In compliance with the Montreal Treaty,Perekriostok refrigerators supplied to its storesin <strong>2002</strong>, all use environmentally-friendlyfreon-R404A which in case of leakage does notharm the earth’s ozone layer. In addition,Perekriostok are increasingly using energy conservinglighting throughout its supermarkets.■ All of Perekriostok’s food production facilitiesand its output are in full compliance with statetechnical specifications, standards and norms.■ Alfa-Eco Group sponsors the PremierLeague fooball club Rostov, theRussian Kickboxing Federation, andorganises international Chess festival“Alfa-Eco Voronezh Cup”.■ TNK finances a number of children’ssports clubs, TNK open championships,various tournaments and sporting events:● TNK Open skiing, mini-football and basketballchampionships● Swimming tournament● TNK employees’ family contests● Rhythmic gymnastics championship amongschoolchildren● All-Russian Energy Industry sports competition■ SIDANCO supports Saratov municipalitiesin holding sporting events under theslogan “Youth Against Drugs”, and traditionallygives donations to WesternSiberian authorities to organise internationalbiathlon championship.All Alfa Group companies provide to their employeessafe working conditions, have implemented proceduresand enforce rules that meet or exceed labor regulationsnorms and respective industry standards
Alfa GroupConsolidated Balance Sheet at 31 December <strong>2002</strong>(Expressed in thousands of US dollars for presentational purposes only – see Note 3)Alfa GroupConsolidated Statement of Income for the Year Ended 31 December <strong>2002</strong>(Expressed in thousands of US dollars for presentational purposes only – see Note 3)Note <strong>2002</strong> 2001Note <strong>2002</strong> 2001ASSETSNon-current assetsProperty, plant and equipment . . . . . . . . . . . . . . . . . . . . . . . . . . . . . . . . . . . . . . . . . . . . . . . . . . . . . . . 4 264,200 292,947}Goodwill, net . . . . . . . . . . . . . . . . . . . . . . . . . . . . . . . . . . . . . . . . . . . . . . . . . . . . . . . . . . . . . . . . . . . . 20 5,826 (669)Investments available for sale . . . . . . . . . . . . . . . . . . . . . . . . . . . . . . . . . . . . . . . . . . . . . . . . . . . . . . . . 5 145,616 182,774}Investment in joint ventures . . . . . . . . . . . . . . . . . . . . . . . . . . . . . . . . . . . . . . . . . . . . . . . . . . . . . . . . . 6 2,571,268 1,804,693}Investment in associated companies . . . . . . . . . . . . . . . . . . . . . . . . . . . . . . . . . . . . . . . . . . . . . . . . . . . 7 457,358 266,863}Loans and advances to customers . . . . . . . . . . . . . . . . . . . . . . . . . . . . . . . . . . . . . . . . . . . . . . . . . . . . 9 604,549 107,340}Due from banks . . . . . . . . . . . . . . . . . . . . . . . . . . . . . . . . . . . . . . . . . . . . . . . . . . . . . . . . . . . . . . . . . . 8 1,896 4,939}Trade and other accounts receivable . . . . . . . . . . . . . . . . . . . . . . . . . . . . . . . . . . . . . . . . . . . . . . . . . . . 10 28,865 4,783}Deferred income tax asset . . . . . . . . . . . . . . . . . . . . . . . . . . . . . . . . . . . . . . . . . . . . . . . . . . . . . . . . . . 18 - 2,286}4,079,578 2,665,956}Current assetsInventories . . . . . . . . . . . . . . . . . . . . . . . . . . . . . . . . . . . . . . . . . . . . . . . . . . . . . . . . . . . . . . . . . . . . . . 11 23,877 107,826}Trade and other accounts receivable . . . . . . . . . . . . . . . . . . . . . . . . . . . . . . . . . . . . . . . . . . . . . . . . . . . 10 295,242 486,019}Loans and advances to customers . . . . . . . . . . . . . . . . . . . . . . . . . . . . . . . . . . . . . . . . . . . . . . . . . . . . 9 1,551,468 1,219,069}Due from banks . . . . . . . . . . . . . . . . . . . . . . . . . . . . . . . . . . . . . . . . . . . . . . . . . . . . . . . . . . . . . . . . . . 8 209,252 130,815}Trading securities . . . . . . . . . . . . . . . . . . . . . . . . . . . . . . . . . . . . . . . . . . . . . . . . . . . . . . . . . . . . . . . . 12 399,797 171,031}Mandatory cash balances with the Central Bank of Russian Federation . . . . . . . . . . . . . . . . . . . . . . . . . 214,252 155,071}Cash and cash equivalents . . . . . . . . . . . . . . . . . . . . . . . . . . . . . . . . . . . . . . . . . . . . . . . . . . . . . . . . . . 13 405,694 619,647}3,099,582 2,889,478}Total assets . . . . . . . . . . . . . . . . . . . . . . . . . . . . . . . . . . . . . . . . . . . . . . . . . . . . . . . . . . . . . . . . . . . . . 28 7,179,160 5,555,434}EQUITY AND LIABILITIESShareholders’ equityShare capital . . . . . . . . . . . . . . . . . . . . . . . . . . . . . . . . . . . . . . . . . . . . . . . . . . . . . . . . . . . . . . . . . . . . 14 19,510} 19,510}Share premium . . . . . . . . . . . . . . . . . . . . . . . . . . . . . . . . . . . . . . . . . . . . . . . . . . . . . . . . . . . . . . . . . . . 14 11,027} 11,027}Fair value reserve for investments available for sale . . . . . . . . . . . . . . . . . . . . . . . . . . . . . . . . . . . . . . . 5 53,161} 39,592}Cumulative translation reserve . . . . . . . . . . . . . . . . . . . . . . . . . . . . . . . . . . . . . . . . . . . . . . . . . . . . . . . (31,219) (969)Retained earnings . . . . . . . . . . . . . . . . . . . . . . . . . . . . . . . . . . . . . . . . . . . . . . . . . . . . . . . . . . . . . . . . . 2,464,696 1,832,533}2,517,175} 1,901,693}Minority interest . . . . . . . . . . . . . . . . . . . . . . . . . . . . . . . . . . . . . . . . . . . . . . . . . . . . . . . . . . . . . . . . . . 25 743,916} 421,627}Sales . . . . . . . . . . . . . . . . . . . . . . . . . . . . . . . . . . . . . . . . . . . . . . . . . . . . . . . . . . . . . . . . . . . . . . . . . . 28 2,900,561} 3,684,886}Cost of goods sold . . . . . . . . . . . . . . . . . . . . . . . . . . . . . . . . . . . . . . . . . . . . . . . . . . . . . . . . . . . . . . . . 28 (2,786,971) (3,546,302)Gross profit . . . . . . . . . . . . . . . . . . . . . . . . . . . . . . . . . . . . . . . . . . . . . . . . . . . . . . . . . . . . . . . . . . . . . 113,590} 138,584}Commission income on trading operations . . . . . . . . . . . . . . . . . . . . . . . . . . . . . . . . . . . . . . . . . . . . . . 11,611} 11,448}Net interest, fees and other income on banking activities . . . . . . . . . . . . . . . . . . . . . . . . . . . . . . . . . . . 22 310,288} 324,091}Gains less losses arising from trading securities . . . . . . . . . . . . . . . . . . . . . . . . . . . . . . . . . . . . . . . . . . 20,008} 33,262}Gains less losses arising from investments available for sale . . . . . . . . . . . . . . . . . . . . . . . . . . . . . . . . . 5 75,238} 61,653}Provisions on operating items . . . . . . . . . . . . . . . . . . . . . . . . . . . . . . . . . . . . . . . . . . . . . . . . . . . . . . . . 19 (48,875) (3,228)Selling and distribution expenses . . . . . . . . . . . . . . . . . . . . . . . . . . . . . . . . . . . . . . . . . . . . . . . . . . . . . (70,374) (36,691)General and administrative expenses, net . . . . . . . . . . . . . . . . . . . . . . . . . . . . . . . . . . . . . . . . . . . . . . . 23 (514,011) (481,298)Operating (loss)/income . . . . . . . . . . . . . . . . . . . . . . . . . . . . . . . . . . . . . . . . . . . . . . . . . . . . . . . . . . . (102,525) 47,821}Share of results of joint ventures, net . . . . . . . . . . . . . . . . . . . . . . . . . . . . . . . . . . . . . . . . . . . . . . . . . . 6 861,021} 877,637}Share of results of associated companies, net . . . . . . . . . . . . . . . . . . . . . . . . . . . . . . . . . . . . . . . . . . . . 7 30,376} 6,829}Gains less losses arising from disposal of subsidiaries . . . . . . . . . . . . . . . . . . . . . . . . . . . . . . . . . . . . . 27 32,767} -}Interest expense, net . . . . . . . . . . . . . . . . . . . . . . . . . . . . . . . . . . . . . . . . . . . . . . . . . . . . . . . . . . . . . . 24 (22,177) (10,729)Foreign exchange translation gains less losses . . . . . . . . . . . . . . . . . . . . . . . . . . . . . . . . . . . . . . . . . . . (6,486) (13,303)Monetary gain . . . . . . . . . . . . . . . . . . . . . . . . . . . . . . . . . . . . . . . . . . . . . . . . . . . . . . . . . . . . . . . . . . . 50,141} 74,781}Profit before income tax and minority interest . . . . . . . . . . . . . . . . . . . . . . . . . . . . . . . . . . . . . . . . . . 28 843,117} 983,036}Income tax (charge)/credit . . . . . . . . . . . . . . . . . . . . . . . . . . . . . . . . . . . . . . . . . . . . . . . . . . . . . . . . . . 18 (10,772) 66,745}Profit after income tax and before minority interest . . . . . . . . . . . . . . . . . . . . . . . . . . . . . . . . . . . . . 832,345} 1,049,781}Minority interest . . . . . . . . . . . . . . . . . . . . . . . . . . . . . . . . . . . . . . . . . . . . . . . . . . . . . . . . . . . . . . . . . . 25 (206,580) (179,686)Non-current liabilitiesBorrowings . . . . . . . . . . . . . . . . . . . . . . . . . . . . . . . . . . . . . . . . . . . . . . . . . . . . . . . . . . . . . . . . . . . . . 15 314,170 72,606}Amounts owed to depositors . . . . . . . . . . . . . . . . . . . . . . . . . . . . . . . . . . . . . . . . . . . . . . . . . . . . . . . . 16 9,592 4,205}Due to banks . . . . . . . . . . . . . . . . . . . . . . . . . . . . . . . . . . . . . . . . . . . . . . . . . . . . . . . . . . . . . . . . . . . . 17 17,642 10,459}Trade and other accounts payable . . . . . . . . . . . . . . . . . . . . . . . . . . . . . . . . . . . . . . . . . . . . . . . . . . . . . 21 5,809 19,138}Provision for losses on credit related commitments and other provisions . . . . . . . . . . . . . . . . . . . . . . . 19 1,577 25,912}Deferred income tax liability . . . . . . . . . . . . . . . . . . . . . . . . . . . . . . . . . . . . . . . . . . . . . . . . . . . . . . . . . 18 20,548 28,997}369,338 161,317}Current liabilitiesBorrowings . . . . . . . . . . . . . . . . . . . . . . . . . . . . . . . . . . . . . . . . . . . . . . . . . . . . . . . . . . . . . . . . . . . . . . 15 603,840 709,700}Amounts owed to depositors . . . . . . . . . . . . . . . . . . . . . . . . . . . . . . . . . . . . . . . . . . . . . . . . . . . . . . . . 16 1,909,150 1,437,828}Due to banks . . . . . . . . . . . . . . . . . . . . . . . . . . . . . . . . . . . . . . . . . . . . . . . . . . . . . . . . . . . . . . . . . . . . 17 652,050 361,001}Trade and other accounts payable . . . . . . . . . . . . . . . . . . . . . . . . . . . . . . . . . . . . . . . . . . . . . . . . . . . . . 21 375,805 562,268}Provision for losses on credit related commitments and other provisions . . . . . . . . . . . . . . . . . . . . . . . 19 7,886 -}3,548,731 3,070,797}Total liabilities . . . . . . . . . . . . . . . . . . . . . . . . . . . . . . . . . . . . . . . . . . . . . . . . . . . . . . . . . . . . . . . . . . 28 3,918,069 3,232,114}Net profit . . . . . . . . . . . . . . . . . . . . . . . . . . . . . . . . . . . . . . . . . . . . . . . . . . . . . . . . . . . . . . . . . . . . . . . 28 625,765} 870,095}Total shareholders’ equity, minority interest and liabilities . . . . . . . . . . . . . . . . . . . . . . . . . . . . . . . . 7,179,160 5,555,434}Approved for issue by the Supervisory Board and signed on its behalf on 15 September 2003.Nigel J. RobinsonNotes 1 to 36 form an integral part of these consolidated financial statements.Notes 1 to 36 form an integral part of these consolidated financial statements.5455
Alfa GroupConsolidated Statement of Cash Flows for the Year Ended 31 December <strong>2002</strong>(Expressed in thousands of US dollars for presentational purposes only – see Note 3)Alfa GroupConsolidated Statement of Changes in Shareholders’ Equity for the Year Ended 31 December <strong>2002</strong>(Expressed in thousands of US dollars for presentational purposes only – see Note 3)Note <strong>2002</strong>} 2001}Cash flows from operating activitiesProfit before income tax and minority interest . . . . . . . . . . . . . . . . . . . . . . . . . . . . . . . . . . . . . . . . . . . . 843,117} 983,036}Depreciation of property, plant and equipment . . . . . . . . . . . . . . . . . . . . . . . . . . . . . . . . . . . . . . . . . . . 4 36,121} 39,763}Loss on disposal of property, plant and equipment . . . . . . . . . . . . . . . . . . . . . . . . . . . . . . . . . . . . . . . . 406} 894}Gains less losses arising on investments available for sale . . . . . . . . . . . . . . . . . . . . . . . . . . . . . . . . . . 5 (75,238) (61,653)Share of results of joint ventures and associated companies . . . . . . . . . . . . . . . . . . . . . . . . . . . . . . . . . 6, 7 (891,397) (884,466)Amortisation of goodwill, net . . . . . . . . . . . . . . . . . . . . . . . . . . . . . . . . . . . . . . . . . . . . . . . . . . . . . . . . 20 622} (697)Adjustment of negative goodwill . . . . . . . . . . . . . . . . . . . . . . . . . . . . . . . . . . . . . . . . . . . . . . . . . . . . . . 6 -} 16,458}Movements in working capital balances . . . . . . . . . . . . . . . . . . . . . . . . . . . . . . . . . . . . . . . . . . . . . . . . 26 (481,258) 28,910}Net increase in mandatory cash balances with CBRF . . . . . . . . . . . . . . . . . . . . . . . . . . . . . . . . . . . . . . . (59,181) (46,983)Provision on operating items . . . . . . . . . . . . . . . . . . . . . . . . . . . . . . . . . . . . . . . . . . . . . . . . . . . . . . . . 19 48,875} 3,228}Gain on sale of subsidiaries . . . . . . . . . . . . . . . . . . . . . . . . . . . . . . . . . . . . . . . . . . . . . . . . . . . . . . . . . (32,767) -}Non-cash compensation to management . . . . . . . . . . . . . . . . . . . . . . . . . . . . . . . . . . . . . . . . . . . . . . . 94,480} -}Net interest income . . . . . . . . . . . . . . . . . . . . . . . . . . . . . . . . . . . . . . . . . . . . . . . . . . . . . . . . . . . . . . . 22, 24 (136,457) (97,774)Net effect of inflation and exchange rate changes on non-operating capital . . . . . . . . . . . . . . . . . . . . . . (88,365) (184,456)Net effect of inflation and exchange rate changes on cash and cash equivalents . . . . . . . . . . . . . . . . . . 70,757} 42,472}Net cash outflow before interest and income tax . . . . . . . . . . . . . . . . . . . . . . . . . . . . . . . . . . . . . . . . (670,285) (161,268)Interest received . . . . . . . . . . . . . . . . . . . . . . . . . . . . . . . . . . . . . . . . . . . . . . . . . . . . . . . . . . . . . . . . . . 333,989} 241,128}Interest paid . . . . . . . . . . . . . . . . . . . . . . . . . . . . . . . . . . . . . . . . . . . . . . . . . . . . . . . . . . . . . . . . . . . . . (173,966) (146,828)Income tax paid . . . . . . . . . . . . . . . . . . . . . . . . . . . . . . . . . . . . . . . . . . . . . . . . . . . . . . . . . . . . . . . . . . (9,195) (15,692)Net cash used in operating activities . . . . . . . . . . . . . . . . . . . . . . . . . . . . . . . . . . . . . . . . . . . . . . . . . (519,457) (82,660)Cash flows from investing activitiesCapital expenditure . . . . . . . . . . . . . . . . . . . . . . . . . . . . . . . . . . . . . . . . . . . . . . . . . . . . . . . . . . . . . . . . 4 (72,439) (56,721)Proceeds from sale of property, plant and equipment . . . . . . . . . . . . . . . . . . . . . . . . . . . . . . . . . . . . . . 6,850} 7,821}Acquisition of investments available for sale . . . . . . . . . . . . . . . . . . . . . . . . . . . . . . . . . . . . . . . . . . . . . 5 (50,802) (21,011)Proceeds from sale of investments available for sale . . . . . . . . . . . . . . . . . . . . . . . . . . . . . . . . . . . . . . . 5 167,847} 58,107}Dividends received from joint ventures . . . . . . . . . . . . . . . . . . . . . . . . . . . . . . . . . . . . . . . . . . . . . . . . . 6 108,723} -}Advances received from joint ventures . . . . . . . . . . . . . . . . . . . . . . . . . . . . . . . . . . . . . . . . . . . . . . . . . 6 -} 238,636}Acquisition of joint ventures . . . . . . . . . . . . . . . . . . . . . . . . . . . . . . . . . . . . . . . . . . . . . . . . . . . . . . . . . 6 -} (27,401)Acquisition of associated companies . . . . . . . . . . . . . . . . . . . . . . . . . . . . . . . . . . . . . . . . . . . . . . . . . . . 7 (152,991) (244,328)Acquisition of subsidiaries . . . . . . . . . . . . . . . . . . . . . . . . . . . . . . . . . . . . . . . . . . . . . . . . . . . . . . . . . . (20,971) -}Cash acquired on consolidation of subsidiaries . . . . . . . . . . . . . . . . . . . . . . . . . . . . . . . . . . . . . . . . . . . 168} 417}Proceeds from sale of subsidiaries . . . . . . . . . . . . . . . . . . . . . . . . . . . . . . . . . . . . . . . . . . . . . . . . . . . . 83,760} -}Cash disposed with sale of subsidiaries . . . . . . . . . . . . . . . . . . . . . . . . . . . . . . . . . . . . . . . . . . . . . . . . (62,638) -}Net cash from/(used in) investing activities . . . . . . . . . . . . . . . . . . . . . . . . . . . . . . . . . . . . . . . . . . . . 7,507} (44,480)Fair value reserve} Cumulative} Total}Share Share for investments} translation} Retained} shareholders’}capital premium available for sale} reserve} earnings} equity}At 1 January 2001 . . . . . . . . . . . . . . . . . . . . . . . . . . . . . . . . . . . . . 19,510 11,027 27,133} 6,932} 978,529} 1,043,131}Movements in fair value of investments available for sale (Note 5) . . - - 29,491} -} -} 29,491}Transfer of net fair value gains arising on investments availablefor sale to net profit (Note 5) . . . . . . . . . . . . . . . . . . . . . . . . . . . . . . - - (9,110) -} -} (9,110)Minority interest applicable to changes in fair valueof investments available for sale (Note 25) . . . . . . . . . . . . . . . . . . . - - (7,922) -} -} (7,922)Translation movement, net of minority interest . . . . . . . . . . . . . . . . - - -} (6,807) -} (6,807)Other movements . . . . . . . . . . . . . . . . . . . . . . . . . . . . . . . . . . . . . . - - -} (1,094) 1,094} -}Net profit for the year . . . . . . . . . . . . . . . . . . . . . . . . . . . . . . . . . . . - - -} -} 870,095} 870,095}Share of other equity movements of joint venturesand associated companies, net of minority interest (Notes 6, 7, 25) . - - -} -} (6,953) (6,953)Dividends declared (Note 14) . . . . . . . . . . . . . . . . . . . . . . . . . . . . . - - -} -} (10,232) (10,232)At 31 December 2001 . . . . . . . . . . . . . . . . . . . . . . . . . . . . . . . . . . 19,510 11,027 39,592} (969) 1,832,533} 1,901,693}Movements in fair value of investments availablefor sale (Note 5) . . . . . . . . . . . . . . . . . . . . . . . . . . . . . . . . . . . . . . . - - 44,750} -} -} 44,750}Transfer of net fair value gains arising on investments availablefor sale to net profit (Note 5) . . . . . . . . . . . . . . . . . . . . . . . . . . . . . . - - (24,614) -} -} (24,614)Minority interest applicable to changes in fair valueof investments available for sale (Note 25) . . . . . . . . . . . . . . . . . . . - - (5,575) -} -} (5,575)Translation movement, net of minority interest . . . . . . . . . . . . . . . . - - 3,202} (35,135) -} (31,933)Other movements . . . . . . . . . . . . . . . . . . . . . . . . . . . . . . . . . . . . . . - - (4,194) 4,885} (691) -}Net profit for the year . . . . . . . . . . . . . . . . . . . . . . . . . . . . . . . . . . . - - -} -} 625,765} 625,765}Share of other equity movements of joint ventures and associatedcompanies, net of minority interest (Notes 6, 7, 25) . . . . . . . . . . . . - - -} -} 16,388} 16,388}Dividends declared (Note 14) . . . . . . . . . . . . . . . . . . . . . . . . . . . . . - - -} -} (9,299) (9,299)At 31 December <strong>2002</strong> . . . . . . . . . . . . . . . . . . . . . . . . . . . . . . . . . . 19,510 11,027 53,161} (31,219) 2,464,696} 2,517,175}Note: The distributable reserves of CTF Holdings Limited are USD 125,004 thousand (2001: USD 83,031 thousand), non-inflated US dollars.Cash flows from financing activitiesDividends paid . . . . . . . . . . . . . . . . . . . . . . . . . . . . . . . . . . . . . . . . . . . . . . . . . . . . . . . . . . . . . . . . . . . (9,299) (7,941)Net increase in short-term borrowings . . . . . . . . . . . . . . . . . . . . . . . . . . . . . . . . . . . . . . . . . . . . . . . . . 349,500} 151,800}Net increase in long-term borrowings . . . . . . . . . . . . . . . . . . . . . . . . . . . . . . . . . . . . . . . . . . . . . . . . . . 24,739} 13,419}Increase in share capital of subsidiaries . . . . . . . . . . . . . . . . . . . . . . . . . . . . . . . . . . . . . . . . . . . . . . . . 3,814} -}Net cash from financing activities . . . . . . . . . . . . . . . . . . . . . . . . . . . . . . . . . . . . . . . . . . . . . . . . . . . 368,754} 157,278}Net (decrease)/increase in cash and cash equivalents . . . . . . . . . . . . . . . . . . . . . . . . . . . . . . . . . . . (143,196) 30,138}Movement in cash and cash equivalentsAt the beginning of the year . . . . . . . . . . . . . . . . . . . . . . . . . . . . . . . . . . . . . . . . . . . . . . . . . . . . . . . . . 619,647} 631,981}Net (decrease)/increase in cash and cash equivalents . . . . . . . . . . . . . . . . . . . . . . . . . . . . . . . . . . . . . . (143,196) 30,138}Effects of inflation on cash and cash equivalents . . . . . . . . . . . . . . . . . . . . . . . . . . . . . . . . . . . . . . . . . . (82,083) (64,814)Effects of exchange rate changes on cash and cash equivalents . . . . . . . . . . . . . . . . . . . . . . . . . . . . . . 11,326} 22,342}At the end of the year . . . . . . . . . . . . . . . . . . . . . . . . . . . . . . . . . . . . . . . . . . . . . . . . . . . . . . . . . . . . . 13 405,694 619,647}Notes 1 to 36 form an integral part of these consolidated financial statements.Notes 1 to 36 form an integral part of these consolidated financial statements.5657
Alfa GroupNotes to the Consolidated Financial Statements for the Year Ended 31 December <strong>2002</strong>(Expressed in thousands of US dollars for presentational purposes only – see Note 3)Alfa GroupNotes to the Consolidated Financial Statements for the Year Ended 31 December <strong>2002</strong>(Expressed in thousands of US dollars for presentational purposes only – see Note 3)1. PRINCIPAL ACTIVITIES OF ALFA GROUPAlfa Group comprises CTF Holdings Limited and its subsidiaries (the “Alfa Group” or the “Group”). Refer to Note 35 for a comprehensive listing ofprincipal entities forming the Group.The registered office of CTF Holdings Limited is Suite 2, 4 Irish Place, Gibraltar.The Group operates in the following business segments: financial services, oil and gas, telecommunications, international commodities, Russia, CISand Southeast Asia commodities, retail trade and food processing (Note 28).Alfa Finance Holdings S.A., a Luxembourg registered company, is the parent entity of Alfa Finance Group. Alfa Finance Group conducts its business through thefollowing wholly owned subsidiaries: ABH Financial Limited, Alfa Petroleum Holdings Limited and Alfa Telecom Limited.ABH Financial Limited, a British Virgin Islands registered company, is the parent company of Alfa Bank Group including amongst other subsidiariesOpen Joint Stock Company Alfa Bank (“Alfa Bank”), a bank registered in the Russian Federation and operating under a full banking license issuedby the Central Bank of the Russian Federation (“CBRF”) since 1991. Alfa Bank operates in all sectors of the Russian financial markets includinginterbank and retail deposits, foreign exchange operations and debt and equity trading. In addition, a complete range of banking services is providedin Russian Roubles and foreign currencies to its clients. The activities of other subsidiaries of ABH Financial Limited include proprietary trading andbrokerage activities, investment and merchant banking and asset management with a primary emphasis on securities within the Russian Federationand Ukraine.Alfa Petroleum Holdings Limited, a British Virgin Islands registered company, holds Alfa Finance Group’s investments in the oil and gas businessrepresented by an investment in TNK Industrial Holdings Limited (“TNK Industrial”) (Note 6).Alfa Telecom Limited, a British Virgin Islands registered company, holds Alfa Finance Group’s investments in the telecommunication businessrepresented by investments in Golden Telecom Inc. (“Golden Telecom”) and Closed Joint Stock Company Kyivstar GSM (“Kyivstar”) (Note 7).Crown Resources AG (“Crown Resources”) was registered in Zug, Switzerland on 21 December 1999. Its activities mainly involve the trading of oil, oilproducts and metal sourced mainly from Russia and sold on international markets. Crown Resources is the main company in the Group’s internatioalcommodities segment following a restructuring in June 2000. The Group’s entire interest in Crown Resources was sold in December <strong>2002</strong> (Note 27).Eco Holdings Limited (“Alfa Eco” and together with its subsidiaries the “Alfa Eco Group”), is registered in Gibraltar. Alfa Eco Group’s main activitiesinclude trading in raw materials (crude oil, oil products, metals, coal and industrial wood) and food products (such as meat, rice, grain, wine, vodka andcognac) in the Russian Federation, the CIS and Southeast Asia as well as provision of agency services in the export of oil, oil products, newsprint andindustrial wood. Alfa Eco Group also holds the Group’s interest in Vimpel-Communications and VimpelCom-Region (Note 7).As opportunities arise the Alfa Eco Group also acquires interests in the equity, equity instruments or other securities of companies with a strategic interestfor the Alfa Eco Group. Depending upon the circumstances, the Alfa Eco Group may acquire a certain interest for the purposes of managing anddeveloping the business or holding the investment for resale.ZAO Trade House Perekriostok (“Perekriostok”) is registered in the Russian Federation. Perekriostok was established to develop and manage a chain ofsupermarkets primarily in Moscow and other population centers in Russia and operates 44 (2001: 37) supermarkets and a distribution centre.Perekriostok is the main company in the Group’s retail trade segment.AC United Food Company (“UFC”), is registered in Cyprus and was created in April 2001 as a holding company for the purpose of merging the Group’sinterest in Kubansakhar with Intec Group, a third party company with sugar factories and grain silos. UFC operates in the Krasnodar, Belgorod andOrel regions of Russia in the areas of sugar processing, trading and distribution and grain trading and storage. The Group’s entire interest in UFC wassold to a private strategic investor in September <strong>2002</strong> (Note 27).2. OPERATING ENVIRONMENT OF THE GROUPThe majority of the Group’s operations are tied to the Russian market and accordingly the operating environment present in the Russian Federation,including the fluctuation of the Russian Rouble to the US dollar, is important to the overall operations of the Group. Whilst there have been improvementsin recent years in the economic situation in the Russian Federation, the economy of the Russian Federation continues to display some characteristicsof an emerging market. These characteristics include, but are not limited to, a currency that is not freely convertible in most countries outsideof the Russian Federation, and relatively high inflation.Additionally, the banking sector in the Russian Federation is particularly impacted by adverse currency fluctuations and economic conditions.Furthermore, the need for further developments in the bankruptcy laws, the absence of formalised procedures for the registration and enforcement ofcollateral, and other legal and fiscal impediments contribute to the difficulties experienced by banks currently operating in the Russian Federation. Theongoing political stabilization has been a positive contributing factor for the further development of the political and legal environment.The prospects for future economic stability in the Russian Federation are largely dependent upon the effectiveness of economic measures undertakenby the Government, together with legal, regulatory and political developments, which are beyond the Group’s control.In addition, economic conditions continue to limit the volume of activity in the financial markets. Market quotations may not be reflective of the values forfinancial instruments which would be determined in an efficient, active market involving willing buyers and willing sellers. Management has therefore usedthe best available information to determine their best estimate of fair values, where considered necessary.3. PRINCIPAL ACCOUNTING POLICIESThe principal accounting policies adopted in the preparation of these consolidated financial statements are set out below.(1)Basis of preparationThe consolidated financial statements of the Group are prepared in accordance with, and comply with, International Financial <strong>Report</strong>ing Standards(“IFRS”), including International Accounting Standards and Interpretations issued by the International Accounting Standards Board. Subsidiaries, registeredon the territory of the Russian Federation, maintain their accounting records in accordance with the Regulations on Accounting and <strong>Report</strong>ingin the Russian Federation in the national currency of the Russian Federation, the Russian Rouble (“RR”). These consolidated financial statements havebeen prepared from those accounting records and adjusted as necessary in order to comply in all material respects with IFRS, based on the accountingpolicies set out below. Subsidiaries that are registered under the legislation of countries outside of the Russian Federation maintain financial statements,which are based upon IFRS principles.The consolidated financial statements have been prepared using the historical cost convention, restated for the effects of inflation. Certain financialinstruments are shown at fair value as disclosed in the accounting policies below.The consolidated financial statements have been measured in Russian Roubles and adjusted for inflation in accordance with IAS 29 “Financial<strong>Report</strong>ing in Hyperinflationary Economies” (“IAS 29”) so that all Russian Rouble amounts, including corresponding figures, are expressed in terms ofthe purchasing power of the Russian Rouble at 31 December <strong>2002</strong>. These financial statements have been presented in US dollars (“USD”) by translatingthe inflation adjusted Russian Rouble amounts as a matter of arithmetic computation using the official rate of the CBRF at 31 December <strong>2002</strong> ofRR 31.7844 to USD 1, for both the current year and corresponding figures. The translation from the measurement currency to the presentation currencywas performed in accordance with Standing Interpretations Committee SIC 30 “<strong>Report</strong>ing Currency – Translation from Measurement Currencyto Presentation Currency”. US dollars has been selected as the presentation currency of the Group as US dollars is the currency which Management ofthe Group uses to manage business risks and exposures, and measure the performance of its businesses. US dollars amounts should not be construed asa representation that Russian Rouble amounts have been or could have been converted to US dollars at this rate.Management EstimatesThe preparation of consolidated financial statements in conformity with IFRS requires Management to make prudent estimates and assumptions thataffect the reported amounts of assets and liabilities at the balance sheet date and the reported amounts of revenues and operating costs during the reportingperiod. The most significant estimates relate to the realisability of investments, realisability and depreciable lives of property, plant and equipment,impairment provisions and provisions for deferred and current taxation. Actual results could differ from these estimates.Changes in Accounting PoliciesDuring 2001 the Group changed the measurement currency of certain subsidiaries from US Dollar to Russian Roubles to comply with StandingInterpretations Committee SIC 19 “<strong>Report</strong>ing Currency – Measurement and Presentation of Financial Statements under IAS 21 and IAS 29” andadopted IAS 39 “Financial Instruments: Recognition and Measurement” (“IAS 39”). The financial effects of these changes in accounting policies werereported in the previous year’s consolidated financial statements.(2)Measurement currencyThe Russian Rouble has been determined to be the measurement currency of the Group as a majority of the Group’s transactions and operations arecarried out and measured in Russian Roubles.The Group’s subsidiaries are considered foreign entities (operations not integral to those of the parent), as defined by IAS 21 “The Effects of Changesin Foreign Exchange Rates” (“IAS 21”), as each of the individual businesses operate independently of the Group. The measurement currency of theGroup’s subsidiaries may be either Russian Roubles or US dollars depending upon the location and nature of the activities of the particular business.In the case of subsidiaries, where the measurement currency is Russian Roubles, the underlying balances and transactions have been adjusted for hyperinflationin accordance with IAS 29.In the case of subsidiaries located in other territories, where the measurement currency is US dollars, the local currency financial statements have beenmeasured in US dollars and translated into Russian Roubles at the applicable exchange rates for inclusion in these consolidated financial statements, asrequired by IAS 21.(3) Foreign currency translationTransactions denominated in currencies other than the respective entity’s measurement currency are recorded, on initial recognition in the relevantmeasurement currency of the entity (Russian Roubles or US dollars), by applying the exchange rate at the date of the transaction. Outstanding foreigncurrency monetary items at the balance sheet date are translated at the exchange rate at the balance sheet date. Exchange rate differences arising on the settlementof monetary items or on translating monetary items at the balance sheet date are recorded as income or expenses of the period to which they relate.At 31 December <strong>2002</strong>, the official rate of exchange, as determined by the CBRF, was RR 31.7844 to USD 1 (2001: RR 30.14 to USD 1). Exchangerestrictions and controls exist relating to converting the Russian Rouble into other currencies. The Russian Rouble is not a freely convertible currencyin most countries outside of the Russian Federation.5859
Alfa GroupNotes to the Consolidated Financial Statements for the Year Ended 31 December <strong>2002</strong>(Expressed in thousands of US dollars for presentational purposes only – see Note 3)Alfa GroupNotes to the Consolidated Financial Statements for the Year Ended 31 December <strong>2002</strong>(Expressed in thousands of US dollars for presentational purposes only – see Note 3)(4) Accounting for the effects of hyperinflation(7)Property, plant and equipmentThe restatement was calculated using the conversion factors derived from the Russian Federation Consumer Price Index (“CPI”), published by theRussian State Committee on Statistics (“Goscomstat”), and from indices obtained from other sources for years prior to 1992.The CPI used to restate the consolidated financial statements is based on 1988 prices using 100 as the base index. The CPI for the five years ended 31December <strong>2002</strong> and the respective conversion factors are:ConversionYear Index Factor1998 . . . . . . . . . . . . . . . . . . . . . . . . . . . . . . . . . . . . . . . . . . . . . . . . . . . . . . . . . . . . . . . . . . . . . . . . . . . . . . . . . . . . . . . . . . . . . . . . . . . . . . . . . . . . . . 1,216,400 2.241999 . . . . . . . . . . . . . . . . . . . . . . . . . . . . . . . . . . . . . . . . . . . . . . . . . . . . . . . . . . . . . . . . . . . . . . . . . . . . . . . . . . . . . . . . . . . . . . . . . . . . . . . . . . . . . . 1,661,481 1.642000 . . . . . . . . . . . . . . . . . . . . . . . . . . . . . . . . . . . . . . . . . . . . . . . . . . . . . . . . . . . . . . . . . . . . . . . . . . . . . . . . . . . . . . . . . . . . . . . . . . . . . . . . . . . . . . 1,995,937 1.372001 . . . . . . . . . . . . . . . . . . . . . . . . . . . . . . . . . . . . . . . . . . . . . . . . . . . . . . . . . . . . . . . . . . . . . . . . . . . . . . . . . . . . . . . . . . . . . . . . . . . . . . . . . . . . . . 2,371,572 1.15<strong>2002</strong> . . . . . . . . . . . . . . . . . . . . . . . . . . . . . . . . . . . . . . . . . . . . . . . . . . . . . . . . . . . . . . . . . . . . . . . . . . . . . . . . . . . . . . . . . . . . . . . . . . . . . . . . . . . . . . 2,730,154 1.00These indices have been applied to the historical cost values of transactions and balances of subsidiaries, where the measurement currency is RussianRouble, as follows:•All comparative figures, including monetary assets and liabilities and other disclosures in respect of prior years, are restated by applying the change inthe CPI during the current year.•All items of the consolidated statement of income are restated by applying the change in the CPI from the date of the transaction to the balance sheetdate.•Monetary assets and liabilities at the latest balance sheet date are not restated because they are already expressed in terms of the monetary unit currentat the balance sheet date.•Non-monetary assets and liabilities are restated by applying the change in the CPI from the date of the transaction, or if applicable from the date oftheir initial valuation, to the latest balance sheet date, and are reduced to net realisable value, estimated recoverable value, or market value as necessary.•The gain or loss on net monetary position, which shows the effects of holding net monetary assets and liabilities, is shown as a separate item in theconsolidated statement of income.As the characteristics of the economic environment of the Russian Federation indicate that hyperinflation has ceased, effective from 1 January 2003 theGroup will no longer apply the provisions of IAS 29.(5)SubsidiariesSubsidiaries, which are those entities in which the Group has an interest of more than one half of the voting rights, or otherwise has power to exercisecontrol over the operations, are consolidated. Subsidiaries are consolidated from the date on which control is transferred to the Group and are no longerconsolidated from the date that control ceases. All intercompany transactions, balances and unrealised gains on transactions between Group companiesare eliminated; unrealised losses are also eliminated unless the cost cannot be recovered. Where necessary, accounting policies for subsidiaries have beenchanged to ensure consistency with the policies adopted by the Group.Minority interest at the balance sheet date represents the minority shareholders’ portion of the pre-acquisition fair values of the identifiable assets andliabilities of the subsidiary at the acquisition date, and the minorities’ portion of movements in equity since the date of the acquisition. Minority interestis presented separately from liabilities and shareholders’ equity.(6)Investments in joint ventures and associated companiesInvestments in joint ventures and associated companies are accounted for by the equity method as described below.A joint venture is a contractual arrangement whereby two or more parties undertake an economic activity which is subject to joint control.Associated companies are entities over which the Group generally has between 20% and 50% of the voting rights, or otherwise the Group has significantinfluence, but which it does not control.Equity accounting involves recognising the Group’s share of the joint venture’s and associated company’s profit or loss for the year in the consolidatedstatement of income and other equity movements in the consolidated statement of equity. Unrealised gains on transactions between the Group and itsjoint ventures and associated companies are eliminated to the extent of the Group’s interest in the joint ventures and associated companies; unrealisedlosses are also eliminated unless the transaction provides evidence of an impairment of the asset transferred. Where necessary, accounting policies forjoint ventures and associated companies have been changed to ensure consistency with the policies adopted by the Group. The Group’s investment injoint ventures and associated companies includes goodwill (net of accumulated amortisation) on acquisition.Equity accounting is discontinued when the carrying amount of the investment in a joint venture or an associated company reaches nil, unless the Grouphas incurred obligations or guaranteed obligations in respect of the joint venture or the associated company.Property, plant and equipment are stated at cost, restated to the equivalent purchasing power of the Russian Rouble at 31 December <strong>2002</strong>, less accumulateddepreciation and provision for impairment, where required.Depreciation is applied on a straight-line basis using the rates specified below, which are based on estimated useful lives of the respective assets:Buildings . . . . . . . . . . . . . . . . . . . . . . . . . . . . . . . . . . . . . . . . . . . . . . . . . . . . . . . . . . . . . . . . . . . . . . . . . . . . . . . . . . . . . . . . . . . . . . . . . . . . . . . . .2-10%Plant, machinery and other equipment . . . . . . . . . . . . . . . . . . . . . . . . . . . . . . . . . . . . . . . . . . . . . . . . . . . . . . . . . . . . . . . . . . . . . . . . . . . . . . . . .9-20%Office and computer equipment . . . . . . . . . . . . . . . . . . . . . . . . . . . . . . . . . . . . . . . . . . . . . . . . . . . . . . . . . . . . . . . . . . . . . . . . . . . . . . . . . . . . . .14-33%Land and construction in progress are not depreciable items. Improvement costs, when incurred, are added to the carrying value of the correspondingasset. Repairs and maintenance expenditure on property, plant and equipment incurred during the year is charged to the consolidated statement ofincome.Gains and losses on disposal of property, plant and equipment are determined by reference to their carrying amount and are taken into account in determiningoperating income.Interest costs on borrowings to finance the construction of property, plant and equipment are capitalised, during the period of time that is required tocomplete and prepare the property for its intended use, as part of the cost of the asset, and depreciated over the estimated useful life of the asset. Nointerest was capitalised during <strong>2002</strong>.(8)GoodwillGoodwill represents the excess of the cost of an acquisition over the fair value of the Group’s share of the net assets of the acquired subsidiary, joint ventureor associated company at the date of acquisition. Goodwill on the acquisition of joint ventures and associated companies is included in investmentsin joint ventures and associated companies. Goodwill is amortised using the straight-line method over its estimated useful life up to 20 years.Negative goodwill represents the excess of the fair value of the Group’s share of the net assets acquired over the cost of acquisition. To the extent thatnegative goodwill relates to expectations of future losses and expenses that are identified in the Group’s plan for the acquisition and can be measuredreliably, but which do not represent identifiable liabilities, that portion of negative goodwill is recorded in the consolidated statement of income whenthe future losses and expenses are recorded. Any remaining negative goodwill, not exceeding the fair values of the non-monetary assets acquired, isrecorded in the consolidated statement of income over the remaining weighted average useful life of depreciable and amortisable assets acquired; negativegoodwill in excess of the fair values of those assets is recorded in the consolidated statement of income immediately.In the case of TNK Industrial the amortisation of negative goodwill is based on the estimated life of oil reserves.Where an indication of impairment exists, the carrying amount of goodwill is assessed and, when impaired, the asset is written down immediately to itsrecoverable amount.(9)Trading securitiesTrading securities are securities which were either acquired for generating a profit from short-term fluctuations in price or dealer’s margin, or are securitiesincluded in a portfolio in which a pattern of short-term trading exists.Trading securities are initially recorded at cost (which includes transaction costs) and are subsequently remeasured at fair value based on their marketvalue or after the application of various valuation methodologies, including Management’s assessment as to the future realisability of these securities. Indetermining market value, all trading securities are valued at the last trade price if quoted on an exchange or, if traded over-the-counter, at the last bidprice.All related realised and unrealised gains and losses are recorded within gains less losses arising from trading securities in the consolidated statement ofincome in the period in which the change occurs. Dividend and interest income earned on trading securities are recorded in the consolidated statementof income as net interest, fees and other income on banking activities.Purchases and sales of trading securities that require delivery within the time frame established by regulation or market conversion (“regular way” purchasesand sales) are recorded at trade date, which is the date that the Group commits to purchase or sell the asset. Otherwise such transactions are treatedas derivatives until settlement occurs.(10) Investments available for saleInvestments available for sale include investments, which Management intends to hold for an indefinite period of time, which may be sold in responseto needs for liquidity or changes in interest rates, exchange rates, or market prices. Management determines the appropriate classification of its investmentsat the time of purchase.Investments available for sale are initially recorded at cost (which includes transaction costs) and subsequently remeasured to fair value based on quotedbid prices. Certain investments available for sale for which there is no available external independent quotation have been fair valued by Management.Fair values of these assets were determined by Management on the basis of current negotiations for disposal of these investments to unrelated third parties,recent sales of equity interests in the investees between unrelated third parties, analysis of discounted cash flows and other financial data60 61
Alfa GroupNotes to the Consolidated Financial Statements for the Year Ended 31 December <strong>2002</strong>(Expressed in thousands of US dollars for presentational purposes only – see Note 3)Alfa GroupNotes to the Consolidated Financial Statements for the Year Ended 31 December <strong>2002</strong>(Expressed in thousands of US dollars for presentational purposes only – see Note 3)of the investees and the application of other valuation methodologies. Unrealised gains and losses arising from changes in the fair value of investmentsavailable for sale are recorded in the consolidated statement of changes in shareholders’ equity. When the investments available for sale are disposed ofor impaired, the related accumulated fair value adjustments are included in the consolidated statement of income as gains less losses arising from investmentsavailable for sale or provision on operating items, respectively. Dividend and interest earned on investments available for sale are recorded in theconsolidated statement of income as net interest, fees and other income on banking activities.Regular way purchases and sales of investments available for sale are recorded at trade date, which is the date that the Group commits to purchase orsell the asset. All other purchases and sales are recorded as derivative forward transactions until settlement.(11) Sale and repurchase agreements and lending of securitiesSale and repurchase agreements (“repos”) are treated as secured financing transactions. Securities sold under sale and repurchase agreements areincluded into trading securities or investments available for sale as appropriate. The corresponding liability is presented within due to banks or borrowings.Securities purchased under agreements to resell (“reverse repos”) are recorded as due from banks or loans and advances to customers as appropriate.The difference between the sale and repurchase price is treated as interest and accrued over the life of repo agreements using the effective yieldmethod.Securities lent to counterparties are retained in the consolidated financial statements. Securities borrowed are not recorded in the consolidated financial statements,unless these are sold to third parties, in which case the purchase and sale are recorded within gains less losses arising from trading securities in the consolidatedstatement of income. The obligation to return them is recorded at fair value as a trading liability.(12) InventoriesInventories are stated at the lower of cost or net realisable value. The cost of inventories is determined on a weighted average cost basis. Cost comprisesraw materials, other direct costs and related production overheads, and excludes interest expense.(13) Trade receivablesTrade and other accounts receivable are carried at amortised cost less provision made for impairment. Such provision for impairment of trade and otheraccounts receivable is established if there is objective evidence that the Group will not be able to collect all amounts due according to the original terms.The amount of the provision is the difference between the carrying amount and estimated recoverable amount, being the present value of expected cashflows, discounted based on the instrument’s original effective interest rate.(14) Originated loans and provisions for loan impairmentLoans are originated by the Group by providing money directly to the borrower or to a sub-participation agent at draw down other than those that areoriginated with the intent of being sold immediately or in the short-term which are recorded as trading assets, are categorised as originated loans.Originated loans are recorded when cash is advanced to borrowers. Initially, originated loans and advances are recorded at cost, which is the fair value ofthe consideration given, and subsequently are carried at amortised cost less provision for loan impairment. Amortised cost is based on the fair value ofcash consideration given to originate those loans determinable by reference to market prices at origination date.Loans and advances originated at interest rates different from market rates are remeasured at origination to their fair value, being future interest paymentsand principal repayment(s) discounted at market interest rates for similar loans. The difference between the fair value and the nominal value atorigination is credited or charged to the consolidated statement of income. Subsequently, the carrying value of such loans and advances is adjusted foramortisation of the gains/losses on origination and the related income is recorded as interest income within the consolidated statement of income usingthe effective yield method.A credit risk provision for loan impairment is established if there is objective evidence that the Group will not be able to collect the amounts due. Theamount of the provision is the difference between the carrying amount and estimated recoverable amount, calculated as the present value of expectedcash flows, including amounts recoverable from guarantees and collateral, discounted at the instrument’s original effective interest rate.The provision for loan impairment also covers losses where there is objective evidence that probable losses are present in components of the loan portfolioat the balance sheet date. These have been estimated based upon historical patterns of losses in each component, the credit ratings assigned to theborrowers and reflect the current economic environment in which the borrowers operate.When a loan is uncollectable, it is written off against the related provision for loan impairment. Such loans are written off after all the necessary legalprocedures have been completed and the amount of the loss has been determined. Recoveries of amounts previously written off are treated as income.If the amount of the provision for loan impairment subsequently decreases due to an event occurring after the write-down, the release of the provisionis credited to provision on operating items in the consolidated statement of income.(15) Cash and cash equivalentsCash and cash equivalents are items which can be converted into cash within a day. All short term interbank placements, beyond overnight deposits,are included in due from banks. Amounts, which relate to funds that are of a restricted nature, are excluded from cash and cash equivalents. Mandatorycash balances with the CBRF have been excluded from cash and cash equivalents, as these balances are not available to finance the Group’s day today operations.(16) Other credit related commitmentsIn the normal course of business, the Group enters into other credit related commitments including loan commitments, letters of credit and guarantees.Specific provisions are raised against other credit related commitments when losses are considered probable.(17) Derivative financial instrumentsDerivative financial instruments are used by the Group’s companies (primarily by Alfa Bank Group and Crown Resources AG) for both economic hedgingand non-hedging (trading) purposes. Although derivative financial instruments are often used for economic hedging purposes, the Group does notmake use of the elective hedge accounting rules under IAS 39.Derivative financial instruments are initially recorded in the consolidated balance sheet at cost (including transaction costs) and subsequently, areremeasured at fair value with the resulting gains or losses recorded immediately in the consolidated statement of income. Fair values are obtained fromquoted market prices and if necessary from discounted cash flow or other models. All derivatives are carried as assets when fair value is positive and asliabilities when fair value is negative. When the Group has contracts to both buy and sell derivative financial instruments with the same counterparty,gains and losses have been offset.Executory contracts, which represent open forward fixed price commodity purchase or sale contracts, are settled by delivery of commodities to meet theGroup’s expected purchase and sales requirements and are therefore outside the scope of IAS 39. Unrealised losses on executory contracts resulting fromadverse market price movements are provided for in the consolidated statement of income. Unrealised gains on executory contracts are not recognizedin the consolidated statement of income.Alfa Bank Group uses derivative financial instruments, which include forward and spot transactions in foreign exchange markets, forwards, futures andoptions on securities and precious metals. All related gains and losses, including changes in fair value, are recorded in the consolidated statement ofincome in net interest, fees and other income on banking activities.Crown Resources uses derivative financial instruments which include commodities swap and futures contracts and firm commitments to fixed price forwardpurchases of oil, oil products, metals and other commodities. All related gains and losses, including changes in fair value, are recorded in the consolidatedstatement of income in cost of goods sold.(18) Income and expense recognitionThe Group operates across a variety of business segments, which generate different types of income and expenses. Income and expenses are recorded on anaccrual basis as earned or incurred. The following are the principal types of income and expenses and how they are recorded:•Sales are recorded upon transfer of title for goods in accordance with the terms of contracts or as services are provided as this is the date that the risksand rewards of ownership are transferred to the customers. Sales are shown net of VAT, sales tax and discounts, and after eliminating sales within theGroup.•Cost of goods sold comprises the purchase price, transportation costs, financing costs, commissions relating to supply agreements and other relatedexpenses.•Interest income and expense are recorded in the consolidated statement of income on an accrual basis using the effective yield method based on theactual purchase price. When loans become doubtful of collection, they are written down to their recoverable amount and interest income is thereafterrecorded based on the interest rate that was used to discount the future cash flows for the purpose of measuring the recoverable amount.•Commission income is recorded as earned, generally upon the performance of commissionable activities or the agreement on its calculation by thecustomer, whichever is the latest.•Dividend income is recorded when the right to receive payment is established, usually on ex-dividend date.•Operating expenses, including selling and distribution expenses and general and administrative expenses are recorded on an accrual basis as incurred.(19) Accounting for operating leases - where the Group is the lesseeLeases of assets under which all the risks and benefits of ownership are effectively retained by the lessor are classified as operating leases. Lease expensesare charged to the consolidated statement of income on a straight-line basis over the period of the lease.(20) Income taxesIncome taxes payable are provided for on the basis of estimates of the tax liability for the year, taking into consideration applicable tax rates and taxexemptions.Deferred income tax assets and liabilities are calculated, using the liability method, in respect of temporary differences arising between the tax base ofassets and liabilities and their carrying values for financial reporting purposes. A deferred tax asset is recorded only to the extent that it is probable thattaxable profit will be available against which the deductible temporary differences can be utilised. Deferred tax assets and liabilities are measured at taxrates that are expected to apply to the period in which the asset is realised or the liability is settled, based on tax rates which are enacted or substantiallyenacted at the balance sheet date. Deferred tax assets and liabilities are netted only within the individual Group companies.62 63
Alfa GroupNotes to the Consolidated Financial Statements for the Year Ended 31 December <strong>2002</strong>(Expressed in thousands of US dollars for presentational purposes only – see Note 3)Alfa GroupNotes to the Consolidated Financial Statements for the Year Ended 31 December <strong>2002</strong>(Expressed in thousands of US dollars for presentational purposes only – see Note 3)Deferred income tax is provided on temporary differences arising on investments in subsidiaries, joint ventures and associated companies, except wherethe timing of the reversal of the temporary difference can be controlled and it is probable that the temporary difference will not reverse in the foreseeablefuture.Deferred taxation, relating to the fair value remeasurement of investments available for sale which is charged or credited directly to equity, is also chargedor credited directly to equity and is subsequently recorded in the consolidated statement of income when the gain or loss on the investments are realised.(21) ProvisionsProvisions are recorded when the Group has a present legal or constructive obligation as a result of past events, it is probable that an outflow of resourcesembodying economic benefits will be required to settle the obligation, and a reliable estimate of the amount of the obligation can be made.(22) Dividends(29) OffsettingFinancial assets and liabilities are offset and the net amount reported in the consolidated balance sheet only when there is a legally enforceable right tooffset the recognised amounts, and there is an intention to either settle on a net basis, or to realise the asset and settle the liability simultaneously.(30) Segment reportingThe consolidated financial statements disclose information relating to the Group’s business and geographic segments. The Group’s primary reportingformat comprises business segments, whilst the secondary reporting format comprises geographical segments. Division into segments depends on suchfactors as the nature of items, types of activities performed by this segment and relative independence of this segment. With regards to the secondarygeographical segments, sales are based on the country in which the customer is located, while total assets and capital expenditures are based on wherethe assets are located.Dividends declared by the Group are recorded as a liability and as a corresponding charge to equity in the year in which they are proposed and declared.(31)Discontinuing operations(23) Bills of exchangeBills of exchange issued by the Group to its customers, more commonly known as “veksels”, carry a fixed date of repayment. These may be issued againstcash deposits or as a payment instrument which the customer can discount in the over-the-counter secondary market. Bills of exchange issued by theGroup are recorded initially at cost being their issue proceeds net of transaction costs incurred. Subsequently, bills of exchange issued are carried atamortised cost and any difference between net proceeds and the redemption value is recorded in the consolidated statement of income over the periodof issuance using the effective yield method.If the Group purchases its own bills of exchange, they are removed from the consolidated balance sheet and the difference between the carrying amountof the liability and the consideration paid is recorded in the consolidated statement of income.The Group also purchases bills of exchange from its customers or in the market. These bills of exchange are included in trading securities, investmentsavailable for sale, originated loans and advances to customers, or in due from banks, depending on their substance, and are subsequently remeasuredand are accounted for in accordance with the accounting policies described above for those categories of assets.(24) BorrowingsBorrowings are recorded initially at “cost”, being their issue proceeds net of transaction costs incurred. Subsequently, borrowings are carried at amortisedcost and any difference between net proceeds and the redemption value is recorded in the consolidated statement of income over the period of theborrowings using the effective yield method.Borrowings originated at interest rates different from market rates are remeasured at origination to their fair value, being future interest payments andprincipal repayment(s) discounted at market interest rates for similar borrowings. The difference between the fair value and the nominal value at originationis credited or charged to the consolidated statement of income. Subsequently, the carrying value of such borrowings is adjusted for amortisationof the gains/losses on origination and the related expense is recorded as interest expense within the consolidated statement of income using the effectiveyield method.If the Group purchases its own debt, it is removed from the balance sheet and the difference between the carrying amount of the liability and the considerationpaid is recorded in the consolidated statement of income.(25) Pension costsThe Group’s subsidiaries that are registered on the territory of the Russian Federation contribute to the Russian Federation’s state pension scheme inrespect of its employees. These contributions are expensed as incurred. The Group’s commitment ends with the payment of these contributions.(26) Share optionsShare options are granted to certain directors and managers of certain of the Group’s companies. The related expense is recorded as staff costs withinthe consolidated statement of income at the date of grant. The effect of any outstanding option is remeasured at each balance sheet date.The consolidated financial statements disclose information relating to the Group’s assets, liabilities, revenues, expenses and cash flows attributable tothe discontinuing operations throughout the period of discontinuance in accordance with requirements of IAS 35 “Discontinuing Operations”.4. PROPERTY, PLANT AND EQUIPMENTCostPlant,} Office and}Land and } Machinery and} Computer} Construction }Buildings} Other Equipment} Equipment} in progress} Other} Total}At 31 December 2001 . . . . . . . . . . . . . . . . . . . . . . . . . . . . . . . . . . 221,081} 153,951} 88,852} 7,165} 31,661} 502,710}Additions . . . . . . . . . . . . . . . . . . . . . . . . . . . . . . . . . . . . . . . . . . . . 18,340} 11,068} 18,579} 14,491} 9,961} 72,439Movements due to acquisition/disposal of subsidiaries . . . . . . . . . . (94,753) (103,483) (4,163) (1,379) 7,179} (196,599)Disposals . . . . . . . . . . . . . . . . . . . . . . . . . . . . . . . . . . . . . . . . . . . . (3,305) (3,743) (10,153) (181) (876) (18,258)Translation movement . . . . . . . . . . . . . . . . . . . . . . . . . . . . . . . . . . . (1,280) (371) (714) 941} (1,421) (2,845)At 31 December <strong>2002</strong> . . . . . . . . . . . . . . . . . . . . . . . . . . . . . . . . . . 140,083} 57,422} 92,401} 21,037} 46,504( 357,447)Accumulated depreciationAt 31 December 2001 . . . . . . . . . . . . . . . . . . . . . . . . . . . . . . . . . . (71,690) (92,369) (37,074) -} (8,630) (209,763)Charge for <strong>2002</strong> . . . . . . . . . . . . . . . . . . . . . . . . . . . . . . . . . . . . . . . (9,955) (9,925) (12,016) -} (4,225) (36,121)Movement due to disposal of subsidiaries . . . . . . . . . . . . . . . . . . . . 59,588} 78,289} 2,052} -} 1,154} 141,083}Disposals . . . . . . . . . . . . . . . . . . . . . . . . . . . . . . . . . . . . . . . . . . . . 1,797} 3,156} 5,589} -} 460} 11,002}Translation movement . . . . . . . . . . . . . . . . . . . . . . . . . . . . . . . . . . . 22} 21} 233} -} 276} 552}At 31 December <strong>2002</strong> . . . . . . . . . . . . . . . . . . . . . . . . . . . . . . . . . . (20,238) (20,828) (41,216) -} (10,965) (93,247)At 31 December <strong>2002</strong>, net . . . . . . . . . . . . . . . . . . . . . . . . . . . . . . . 119,845} 36,594} 51,185} 21,037} 35,539} 264,200}(27)ImpairmentAt 31 December 2001, net . . . . . . . . . . . . . . . . . . . . . . . . . . . . . . . 149,391} 61,582} 51,778} 7,165} 23,031} 292,947}The Group makes an assessment whether there is any indication that an asset may be impaired at each balance sheet date. If any such indication exists,an estimate of the recoverable amount of the asset is made.Property, plant and equipment totalling USD 36,385 thousand (2001: USD 37,641 thousand) has been pledged to third parties as collateral (Note 15).If the recoverable amount of an asset is less than its carrying amount, the carrying amount of the asset is reduced to its recoverable amount. That reductionis an impairment loss.(28)Fiduciary assetsAssets and liabilities held by the Group in its own name, but for the account of third parties, are not reported in the consolidated balance sheet.Commissions received from such business are included in net interest, fees and other income on banking activities in the consolidated statement ofincome.64 65
Alfa GroupNotes to the Consolidated Financial Statements for the Year Ended 31 December <strong>2002</strong>(Expressed in thousands of US dollars for presentational purposes only – see Note 3)Alfa GroupNotes to the Consolidated Financial Statements for the Year Ended 31 December <strong>2002</strong>(Expressed in thousands of US dollars for presentational purposes only – see Note 3)5. INVESTMENTS AVAILABLE FOR SALEInvestments available for sale comprise principally non-marketable equity securities, which are not publicly traded or listed on the Russian stock exchange.These investments cover industries, which are not part of the long-term strategy of the Group. Management of the Group is focused on an eventual exitstrategy for each of these companies.External independent market quotations were not available for certain investments available for sale. As such, the fair values of these assets were determinedby Management on the basis of current negotiations for disposal of these investments to unrelated third parties, recent sales of equity interests in the investeesbetween unrelated third parties, analysis of discounted cash flows and other financial data of the investees and the application of other valuation methodologies.A roll forward of the investments available for sale is as follows:The principal investments available for sale are:<strong>2002</strong>} 2001}At 1 January . . . . . . . . . . . . . . . . . . . . . . . . . . . . . . . . . . . . . . . . . . . . . . . . . . . . . . . . . . . . . . . . . . . . . . . . . . . . . . . . . . . . . . . . . . . . . . . . . . . . . . . 182,774} 175,467}Movement in fair value . . . . . . . . . . . . . . . . . . . . . . . . . . . . . . . . . . . . . . . . . . . . . . . . . . . . . . . . . . . . . . . . . . . . . . . . . . . . . . . . . . . . . . . . . . . . . . . . 44,750} 29,491}Acquisitions . . . . . . . . . . . . . . . . . . . . . . . . . . . . . . . . . . . . . . . . . . . . . . . . . . . . . . . . . . . . . . . . . . . . . . . . . . . . . . . . . . . . . . . . . . . . . . . . . . . . . . . . 50,802} 25,525}Disposals . . . . . . . . . . . . . . . . . . . . . . . . . . . . . . . . . . . . . . . . . . . . . . . . . . . . . . . . . . . . . . . . . . . . . . . . . . . . . . . . . . . . . . . . . . . . . . . . . . . . . . . . . . (167,847) (66,092)Gains less losses arising from investments available for sale . . . . . . . . . . . . . . . . . . . . . . . . . . . . . . . . . . . . . . . . . . . . . . . . . . . . . . . . . . . . . . . . . . . 75,238} 61,653}Transfer of net fair value gains on investments available for sale to net profit . . . . . . . . . . . . . . . . . . . . . . . . . . . . . . . . . . . . . . . . . . . . . . . . . . . . . . . . (24,614) (9,110)Impairment of investments available for sale (Note 19) . . . . . . . . . . . . . . . . . . . . . . . . . . . . . . . . . . . . . . . . . . . . . . . . . . . . . . . . . . . . . . . . . . . . . . . . (6,349) (2,009)Translation and other movements . . . . . . . . . . . . . . . . . . . . . . . . . . . . . . . . . . . . . . . . . . . . . . . . . . . . . . . . . . . . . . . . . . . . . . . . . . . . . . . . . . . . . . . . (9,138) (32,151)At 31 December . . . . . . . . . . . . . . . . . . . . . . . . . . . . . . . . . . . . . . . . . . . . . . . . . . . . . . . . . . . . . . . . . . . . . . . . . . . . . . . . . . . . . . . . . . . . . . . . . . . . . 145,616} 182,774}Fair valueName Nature of business Country of registration <strong>2002</strong> 2001STS TV . . . . . . . . . . . . . . . . . . . . . . . . . . . . . . . . . . . . . . . . . . . . . . . . . . . . . . . . . . . . . . . . Television Russia 42,110 14,669Akrikhin . . . . . . . . . . . . . . . . . . . . . . . . . . . . . . . . . . . . . . . . . . . . . . . . . . . . . . . . . . . . . . . . Pharmaceutical Russia 30,540 35,899CBK Kama . . . . . . . . . . . . . . . . . . . . . . . . . . . . . . . . . . . . . . . . . . . . . . . . . . . . . . . . . . . . . . Manufacturing Russia 15,000 -Amurmetal . . . . . . . . . . . . . . . . . . . . . . . . . . . . . . . . . . . . . . . . . . . . . . . . . . . . . . . . . . . . . . Manufacturing Russia 14,000 8,332TD GUM . . . . . . . . . . . . . . . . . . . . . . . . . . . . . . . . . . . . . . . . . . . . . . . . . . . . . . . . . . . . . . . Retail Russia 19,885 -Taganrogskiy Metallurgichesky Zavod . . . . . . . . . . . . . . . . . . . . . . . . . . . . . . . . . . . . . . . . . Manufacturing Russia 287 21,406TV Service . . . . . . . . . . . . . . . . . . . . . . . . . . . . . . . . . . . . . . . . . . . . . . . . . . . . . . . . . . . . . . Television Russia - 27,291UIF Alfa Capital . . . . . . . . . . . . . . . . . . . . . . . . . . . . . . . . . . . . . . . . . . . . . . . . . . . . . . . . . . Investment Russia - 23,014Siracuse . . . . . . . . . . . . . . . . . . . . . . . . . . . . . . . . . . . . . . . . . . . . . . . . . . . . . . . . . . . . . . . Construction Russia - 18,862Other . . . . . . . . . . . . . . . . . . . . . . . . . . . . . . . . . . . . . . . . . . . . . . . . . . . . . . . . . . . . . . . . . . 23,794 33,301145,616 182,774Investments available for sale with a fair value of USD 5,227 thousand (2001: USD 6,227 thousand) have been pledged to third parties as collateral withrespect to borrowings (Note 15).6. INVESTMENT IN JOINT VENTURES<strong>2002</strong> 2001TNK Industrial . . . . . . . . . . . . . . . . . . . . . . . . . . . . . . . . . . . . . . . . . . . . . . . . . . . . . . . . . . . . . . . . . . . . . . . . . . . . . . . . . . . . . . . . . . . . . . . . . . . . . . . 2,522,847 1,759,324OAO Volga . . . . . . . . . . . . . . . . . . . . . . . . . . . . . . . . . . . . . . . . . . . . . . . . . . . . . . . . . . . . . . . . . . . . . . . . . . . . . . . . . . . . . . . . . . . . . . . . . . . . . . . . . 48,421 45,369TNK Industrial2,571,268 1,804,693The Group’s oil and gas assets are held by TNK Industrial, an entity jointly controlled by the Group and its joint venture partner, Access-Renova Group.The Group owns a 50% economic and voting interest in TNK Industrial. Refer to Note 36 for details on restructuring of the Group’s investment in TNKIndustrial into its investment into TNK-BP. After the transaction, the Group’s effective interest in TNK Industrial will be reduced to 25%.TNK Industrial, through its subsidiaries, conducts exploration activities and produces oil and gas in the Russian Federation and operates petroleumrefineries and markets petroleum products primarily in the Russian Federation and Ukraine. At 31 December <strong>2002</strong>, TNK Industrial held a 100.0%interest in TNK International Limited and a 67.9% interest in OAO SIDANCO.The Group accounts for its interest in TNK Industrial and its subsidiaries using the equity method. The table below summarises the movements in theGroup’s net investment in TNK Industrial.<strong>2002</strong> 2001}At 1 January . . . . . . . . . . . . . . . . . . . . . . . . . . . . . . . . . . . . . . . . . . . . . . . . . . . . . . . . . . . . . . . . . . . . . . . . . . . . . . . . . . . . . . . . . . . . . . . . . . . . . . . 1,759,324} 1,167,169}Net share of results of joint venture . . . . . . . . . . . . . . . . . . . . . . . . . . . . . . . . . . . . . . . . . . . . . . . . . . . . . . . . . . . . . . . . . . . . . . . . . . . . . . . . . . . . . . . 824,737} 829,158}Net share of other equity movements of joint venture . . . . . . . . . . . . . . . . . . . . . . . . . . . . . . . . . . . . . . . . . . . . . . . . . . . . . . . . . . . . . . . . . . . . . . . . . 13,847} (7,726)Dividends received from joint venture . . . . . . . . . . . . . . . . . . . . . . . . . . . . . . . . . . . . . . . . . . . . . . . . . . . . . . . . . . . . . . . . . . . . . . . . . . . . . . . . . . . . . (100,878) -}Advances received from joint venture . . . . . . . . . . . . . . . . . . . . . . . . . . . . . . . . . . . . . . . . . . . . . . . . . . . . . . . . . . . . . . . . . . . . . . . . . . . . . . . . . . . . . -} (238,636)Amortisation of negative goodwill . . . . . . . . . . . . . . . . . . . . . . . . . . . . . . . . . . . . . . . . . . . . . . . . . . . . . . . . . . . . . . . . . . . . . . . . . . . . . . . . . . . . . . . . 25,817} 25,817}Effect of change in the applicable tax rate . . . . . . . . . . . . . . . . . . . . . . . . . . . . . . . . . . . . . . . . . . . . . . . . . . . . . . . . . . . . . . . . . . . . . . . . . . . . . . . . . . -} (16,458)At 31 December . . . . . . . . . . . . . . . . . . . . . . . . . . . . . . . . . . . . . . . . . . . . . . . . . . . . . . . . . . . . . . . . . . . . . . . . . . . . . . . . . . . . . . . . . . . . . . . . . . . . . 2,522,847} 1,759,324}The table below summarises the movements in the negative goodwill with respect to the Group’s investment in TNK Industrial.<strong>2002</strong>} 2001}At 1 January . . . . . . . . . . . . . . . . . . . . . . . . . . . . . . . . . . . . . . . . . . . . . . . . . . . . . . . . . . . . . . . . . . . . . . . . . . . . . . . . . . . . . . . . . . . . . . . . . . . . . . . 361,449} 370,808}Amortisation of negative goodwill . . . . . . . . . . . . . . . . . . . . . . . . . . . . . . . . . . . . . . . . . . . . . . . . . . . . . . . . . . . . . . . . . . . . . . . . . . . . . . . . . . . . . . . . (25,817) (25,817)Effect of change in the applicable tax rate . . . . . . . . . . . . . . . . . . . . . . . . . . . . . . . . . . . . . . . . . . . . . . . . . . . . . . . . . . . . . . . . . . . . . . . . . . . . . . . . . . -} 16,458}At 31 December . . . . . . . . . . . . . . . . . . . . . . . . . . . . . . . . . . . . . . . . . . . . . . . . . . . . . . . . . . . . . . . . . . . . . . . . . . . . . . . . . . . . . . . . . . . . . . . . . . . . . 335,632} 361,449}The net share of results of joint venture includes the Group’s portion of TNK Industrial’s net profit after tax and minority interest. The Group’s shareof TNK Industrial’s income tax charge amounts to USD 119,323 thousand for <strong>2002</strong> (2001: income tax credit amounts to USD 77,395 thousand). At 31December <strong>2002</strong>, a provision for deferred tax using a rate of nil % (2001: nil%) has been estimated with respect to the carrying value of the investmentin TNK Industrial as the investment is held in a company domiciled in the British Virgin Islands, and thus, is in a tax exempt region.66 67
Alfa GroupNotes to the Consolidated Financial Statements for the Year Ended 31 December <strong>2002</strong>(Expressed in thousands of US dollars for presentational purposes only – see Note 3)Alfa GroupNotes to the Consolidated Financial Statements for the Year Ended 31 December <strong>2002</strong>(Expressed in thousands of US dollars for presentational purposes only – see Note 3)6. INVESTMENT IN JOINT VENTURES (CONTINUED)The consolidated financial information on Hayard Investments Limited, including Nizhniy Newsprint Holdings and OAO Volga, is summarised below:The consolidated financial information of TNK Industrial is summarized as follows:<strong>2002</strong>} 2001}Condensed consolidated balance sheetNon-current assets . . . . . . . . . . . . . . . . . . . . . . . . . . . . . . . . . . . . . . . . . . . . . . . . . . . . . . . . . . . . . . . . . . . . . . . . . . . . . . . . . . . . . . . . . . . . . . . . . . . 11,031,047} 11,120,898}Current assets . . . . . . . . . . . . . . . . . . . . . . . . . . . . . . . . . . . . . . . . . . . . . . . . . . . . . . . . . . . . . . . . . . . . . . . . . . . . . . . . . . . . . . . . . . . . . . . . . . . . . . 3,632,586} 2,728,359}Non-current liabilities . . . . . . . . . . . . . . . . . . . . . . . . . . . . . . . . . . . . . . . . . . . . . . . . . . . . . . . . . . . . . . . . . . . . . . . . . . . . . . . . . . . . . . . . . . . . . . . . . (3,952,386) (3,447,630)Current liabilities . . . . . . . . . . . . . . . . . . . . . . . . . . . . . . . . . . . . . . . . . . . . . . . . . . . . . . . . . . . . . . . . . . . . . . . . . . . . . . . . . . . . . . . . . . . . . . . . . . . . . (2,645,266) (4,078,275)Minority interest . . . . . . . . . . . . . . . . . . . . . . . . . . . . . . . . . . . . . . . . . . . . . . . . . . . . . . . . . . . . . . . . . . . . . . . . . . . . . . . . . . . . . . . . . . . . . . . . . . . . . (2,349,023) (2,081,806)Consolidated shareholders’ equity . . . . . . . . . . . . . . . . . . . . . . . . . . . . . . . . . . . . . . . . . . . . . . . . . . . . . . . . . . . . . . . . . . . . . . . . . . . . . . . . . . . . . . . . (5,716,958) (4,241,546)Condensed consolidated statement of incomeSales . . . . . . . . . . . . . . . . . . . . . . . . . . . . . . . . . . . . . . . . . . . . . . . . . . . . . . . . . . . . . . . . . . . . . . . . . . . . . . . . . . . . . . . . . . . . . . . . . . . . . . . . . . . . . 8,515,145} 6,722,618}Operating expenses and costs . . . . . . . . . . . . . . . . . . . . . . . . . . . . . . . . . . . . . . . . . . . . . . . . . . . . . . . . . . . . . . . . . . . . . . . . . . . . . . . . . . . . . . . . . . . (6,410,302) (4,966,577)Net profit before tax and minority interest . . . . . . . . . . . . . . . . . . . . . . . . . . . . . . . . . . . . . . . . . . . . . . . . . . . . . . . . . . . . . . . . . . . . . . . . . . . . . . . . . . 2,195,396} 1,773,193}Net profit after tax and minority interest . . . . . . . . . . . . . . . . . . . . . . . . . . . . . . . . . . . . . . . . . . . . . . . . . . . . . . . . . . . . . . . . . . . . . . . . . . . . . . . . . . . 1,649,480} 1,658,316}<strong>2002</strong>} 2001}Condensed consolidated balance sheetNon-current assets . . . . . . . . . . . . . . . . . . . . . . . . . . . . . . . . . . . . . . . . . . . . . . . . . . . . . . . . . . . . . . . . . . . . . . . . . . . . . . . . . . . . . . . . . . . . . . . . . . . 169,631} 184,741}Current assets . . . . . . . . . . . . . . . . . . . . . . . . . . . . . . . . . . . . . . . . . . . . . . . . . . . . . . . . . . . . . . . . . . . . . . . . . . . . . . . . . . . . . . . . . . . . . . . . . . . . . . 50,080} 44,645}Non-current liabilities . . . . . . . . . . . . . . . . . . . . . . . . . . . . . . . . . . . . . . . . . . . . . . . . . . . . . . . . . . . . . . . . . . . . . . . . . . . . . . . . . . . . . . . . . . . . . . . . . (27,709) (24,370)Current liabilities . . . . . . . . . . . . . . . . . . . . . . . . . . . . . . . . . . . . . . . . . . . . . . . . . . . . . . . . . . . . . . . . . . . . . . . . . . . . . . . . . . . . . . . . . . . . . . . . . . . . . (68,875) (86,319)Minority interest . . . . . . . . . . . . . . . . . . . . . . . . . . . . . . . . . . . . . . . . . . . . . . . . . . . . . . . . . . . . . . . . . . . . . . . . . . . . . . . . . . . . . . . . . . . . . . . . . . . . . (12,720) (10,875)Consolidated shareholders equity . . . . . . . . . . . . . . . . . . . . . . . . . . . . . . . . . . . . . . . . . . . . . . . . . . . . . . . . . . . . . . . . . . . . . . . . . . . . . . . . . . . . . . . . (110,407) (107,822)Year ended} 8 months ended}31 December} 31 December}<strong>2002</strong>} 2001}Condensed consolidated statement of incomeSales . . . . . . . . . . . . . . . . . . . . . . . . . . . . . . . . . . . . . . . . . . . . . . . . . . . . . . . . . . . . . . . . . . . . . . . . . . . . . . . . . . . . . . . . . . . . . . . . . . . . . . . . . . . . . 192,531} 173,515}Operating expenses . . . . . . . . . . . . . . . . . . . . . . . . . . . . . . . . . . . . . . . . . . . . . . . . . . . . . . . . . . . . . . . . . . . . . . . . . . . . . . . . . . . . . . . . . . . . . . . . . . (179,439) (134,848)Net profit before tax and minority interest . . . . . . . . . . . . . . . . . . . . . . . . . . . . . . . . . . . . . . . . . . . . . . . . . . . . . . . . . . . . . . . . . . . . . . . . . . . . . . . . . . 13,092} 38,667}Net profit after tax and minority interest . . . . . . . . . . . . . . . . . . . . . . . . . . . . . . . . . . . . . . . . . . . . . . . . . . . . . . . . . . . . . . . . . . . . . . . . . . . . . . . . . . . 1,729} 31,670}OAO VolgaIn May 2001, the Group acquired a 50% interest in Nizhniy Newsprint Holdings Limited through a joint venture, Hayard Investments Limited, set upwith a third party (with equal 50% ownership), for a consideration of USD 27,401 thousand. Nizhniy Newsprint Holdings Limited owns 92.97% of theissued share capital of OAO Volga, a newsprint manufacturer.<strong>2002</strong>} 2001}At 1 January . . . . . . . . . . . . . . . . . . . . . . . . . . . . . . . . . . . . . . . . . . . . . . . . . . . . . . . . . . . . . . . . . . . . . . . . . . . . . . . . . . . . . . . . . . . . . . . . . . . . . . . 45,369} -7. INVESTMENT IN ASSOCIATED COMPANIESThe Group’s investments in associated companies include investments in the telecommunications sector.VimpelCom} Golden} }Group} Telecom} Kyivstar} Total}At 1 January 2001 . . . . . . . . . . . . . . . . . . . . . . . . . . . . . . . . . . . . . . . . . . . . . . . . . . . . . . . . . . . . . . . . . . . . -} -} -} -}Share of net assets acquired (at fair value) . . . . . . . . . . . . . . . . . . . . . . . . . . . . . . . . . . . . . . . . . . . . . . . . . . . . . . . . . . . . . . . . . . . . . . . . . . . . . . . . . -} 38,074}Negative goodwill arising on acquisition . . . . . . . . . . . . . . . . . . . . . . . . . . . . . . . . . . . . . . . . . . . . . . . . . . . . . . . . . . . . . . . . . . . . . . . . . . . . . . . . . . . -} (10,673)Net share of results of joint venture . . . . . . . . . . . . . . . . . . . . . . . . . . . . . . . . . . . . . . . . . . . . . . . . . . . . . . . . . . . . . . . . . . . . . . . . . . . . . . . . . . . . . . . 8,710} 20,528}Net share of other equity movements of joint venture . . . . . . . . . . . . . . . . . . . . . . . . . . . . . . . . . . . . . . . . . . . . . . . . . . . . . . . . . . . . . . . . . . . . . . . . . 430} -Distributions to shareholders . . . . . . . . . . . . . . . . . . . . . . . . . . . . . . . . . . . . . . . . . . . . . . . . . . . . . . . . . . . . . . . . . . . . . . . . . . . . . . . . . . . . . . . . . . . (7,845) (4,694)Amortisation of negative goodwill . . . . . . . . . . . . . . . . . . . . . . . . . . . . . . . . . . . . . . . . . . . . . . . . . . . . . . . . . . . . . . . . . . . . . . . . . . . . . . . . . . . . . . . . 1,757} 2,134}At 31 December . . . . . . . . . . . . . . . . . . . . . . . . . . . . . . . . . . . . . . . . . . . . . . . . . . . . . . . . . . . . . . . . . . . . . . . . . . . . . . . . . . . . . . . . . . . . . . . . . . . . . 48,421} 45,369}The table below summarises the movements in the negative goodwill with respect to the Group’s investment in Hayard Investments Limited:<strong>2002</strong>} 2001}At 1 January . . . . . . . . . . . . . . . . . . . . . . . . . . . . . . . . . . . . . . . . . . . . . . . . . . . . . . . . . . . . . . . . . . . . . . . . . . . . . . . . . . . . . . . . . . . . . . . . . . . . . . . 8,539} -}Negative goodwill arising on acquisition . . . . . . . . . . . . . . . . . . . . . . . . . . . . . . . . . . . . . . . . . . . . . . . . . . . . . . . . . . . . . . . . . . . . . . . . . . . . . . . . . . . -} 10,673}Amortization of goodwill . . . . . . . . . . . . . . . . . . . . . . . . . . . . . . . . . . . . . . . . . . . . . . . . . . . . . . . . . . . . . . . . . . . . . . . . . . . . . . . . . . . . . . . . . . . . . . . (1,757) (2,134)Share of net assets acquired (at fair value) . . . . . . . . . . . . . . . . . . . . . . . . . . . . . . . . . . . . . . . . . . . . . . . . . . 59,575} 105,396} -} 164,971}Goodwill arising on acquisition . . . . . . . . . . . . . . . . . . . . . . . . . . . . . . . . . . . . . . . . . . . . . . . . . . . . . . . . . . . 76,808} 18,871} -} 95,679}Net share of results of associated companies . . . . . . . . . . . . . . . . . . . . . . . . . . . . . . . . . . . . . . . . . . . . . . . . 3,852} 5,505} -} 9,357}Net share of other equity movements of associated companies . . . . . . . . . . . . . . . . . . . . . . . . . . . . . . . . . . . -} (616) -} (616)Amortisation of goodwill . . . . . . . . . . . . . . . . . . . . . . . . . . . . . . . . . . . . . . . . . . . . . . . . . . . . . . . . . . . . . . . . (645) (1,883) -} (2,528)At 31 December 2001 . . . . . . . . . . . . . . . . . . . . . . . . . . . . . . . . . . . . . . . . . . . . . . . . . . . . . . . . . . . . . . . . . 139,590} 127,273} -} 266,863}Share of net assets acquired (at fair value) . . . . . . . . . . . . . . . . . . . . . . . . . . . . . . . . . . . . . . . . . . . . . . . . . . 40,317} -} 24,943} 65,260}Goodwill arising on acquisition . . . . . . . . . . . . . . . . . . . . . . . . . . . . . . . . . . . . . . . . . . . . . . . . . . . . . . . . . . . 19,497} -} 68,234} 87,731}Net share of results of associated companies . . . . . . . . . . . . . . . . . . . . . . . . . . . . . . . . . . . . . . . . . . . . . . . . 20,125} 16,839} 6,063} 43,027}Net share of other equity movements of associated companies . . . . . . . . . . . . . . . . . . . . . . . . . . . . . . . . . . . 3,523} 3,605} -} 7,128}Amortisation of goodwill . . . . . . . . . . . . . . . . . . . . . . . . . . . . . . . . . . . . . . . . . . . . . . . . . . . . . . . . . . . . . . . . (4,003) (3,774) (4,874) (12,651)At 31 December <strong>2002</strong> . . . . . . . . . . . . . . . . . . . . . . . . . . . . . . . . . . . . . . . . . . . . . . . . . . . . . . . . . . . . . . . . . 219,049} 143,943} 94,366} 457,358}At 31 December . . . . . . . . . . . . . . . . . . . . . . . . . . . . . . . . . . . . . . . . . . . . . . . . . . . . . . . . . . . . . . . . . . . . . . . . . . . . . . . . . . . . . . . . . . . . . . . . . . . . 6,782} 8,539}The net share of results of joint venture includes the Group’s portion of Hayard Investments Limited’s net profit after tax and minority interest. TheGroup’s share of Hayard Investments Limited’s income tax charge amounted to USD 5,032 thousand for <strong>2002</strong> (2001: income tax charge amounted toUSD 2,751 thousand).68 69
Alfa GroupNotes to the Consolidated Financial Statements for the Year Ended 31 December <strong>2002</strong>(Expressed in thousands of US dollars for presentational purposes only – see Note 3)Alfa GroupNotes to the Consolidated Financial Statements for the Year Ended 31 December <strong>2002</strong>(Expressed in thousands of US dollars for presentational purposes only – see Note 3)7. INVESTMENT IN ASSOCIATED COMPANIES (CONTINUED)8. DUE FROM BANKSThe table below summarises the movements in the goodwill with respect to the Group’s investment in associated companies:VimpelCom} Golden}Group} Telecom} Kyivstar} Total}At 1 January 2001 . . . . . . . . . . . . . . . . . . . . . . . . . . . . . . . . . . . . . . . . . . . . . . . . . . . . . . . . . . . . . . . . . . . . -} -} -} -}Goodwill arising on acquisition . . . . . . . . . . . . . . . . . . . . . . . . . . . . . . . . . . . . . . . . . . . . . . . . . . . . . . . . . . . 76,808} 18,871} -} 95,679}Amortization of goodwill . . . . . . . . . . . . . . . . . . . . . . . . . . . . . . . . . . . . . . . . . . . . . . . . . . . . . . . . . . . . . . . . (645) (1,883) -} (2,528)At 31 December 2001 . . . . . . . . . . . . . . . . . . . . . . . . . . . . . . . . . . . . . . . . . . . . . . . . . . . . . . . . . . . . . . . . . 76,163} 16,988} -} 93,151}Goodwill arising on acquisition . . . . . . . . . . . . . . . . . . . . . . . . . . . . . . . . . . . . . . . . . . . . . . . . . . . . . . . . . . . 19,497} -} 68,234} 87,731}Amortization of goodwill . . . . . . . . . . . . . . . . . . . . . . . . . . . . . . . . . . . . . . . . . . . . . . . . . . . . . . . . . . . . . . . . (4,003) (3,774) (4,874) (12,651)<strong>2002</strong>} 2001}CurrentDue in 1 month or less . . . . . . . . . . . . . . . . . . . . . . . . . . . . . . . . . . . . . . . . . . . . . . . . . . . . . . . . . . . . . . . . . . . . . . . . . . . . . . . . . . . . . . . . . . . . . . . . 198,132} 128,998}Due in 1-6 months . . . . . . . . . . . . . . . . . . . . . . . . . . . . . . . . . . . . . . . . . . . . . . . . . . . . . . . . . . . . . . . . . . . . . . . . . . . . . . . . . . . . . . . . . . . . . . . . . . . 11,120} 2,505}Due in 6-12 months . . . . . . . . . . . . . . . . . . . . . . . . . . . . . . . . . . . . . . . . . . . . . . . . . . . . . . . . . . . . . . . . . . . . . . . . . . . . . . . . . . . . . . . . . . . . . . . . . . -} -}Less: Provision for loan impairment (Note 19) . . . . . . . . . . . . . . . . . . . . . . . . . . . . . . . . . . . . . . . . . . . . . . . . . . . . . . . . . . . . . . . . . . . . . . . . . . . . . . . -} (688)209,252} 130,815}Non-currentDue in more than 12 months . . . . . . . . . . . . . . . . . . . . . . . . . . . . . . . . . . . . . . . . . . . . . . . . . . . . . . . . . . . . . . . . . . . . . . . . . . . . . . . . . . . . . . . . . . . . 1,949} 4,939}Less: Provision for loan impairment (Note 19) . . . . . . . . . . . . . . . . . . . . . . . . . . . . . . . . . . . . . . . . . . . . . . . . . . . . . . . . . . . . . . . . . . . . . . . . . . . . . . . (53) -}1,896} 4,939}At 31 December <strong>2002</strong> . . . . . . . . . . . . . . . . . . . . . . . . . . . . . . . . . . . . . . . . . . . . . . . . . . . . . . . . . . . . . . . . . 91,657} 13,214} 63,360} 168,231}VimpelCom GroupAt 31 December <strong>2002</strong>, the Group owned a 25%+1 voting share (2001: 25%+1 voting share) of OAO Vimpel-Communications and 17.5% (2001: 25%+1voting share) of ZAO VimpelCom-Region, a subsidiary of OAO Vimpel-Communications. OAO Vimpel-Communications is one of the largest mobiletelecommunication companies in Russia. ZAO VimpelCom-Region was created as an operator for the purposes of regional development of the “BeeLine GSM” network. OAO Vimpel-Communications is the first Russian company which listed its shares on the NYSE through American DepositaryShares (“ADS”) Level 3 (the highest level).In November 2001, a company controlled by the Group purchased a 25%+1 voting share in OAO Vimpel-Communications and ZAO VimpelCom-Region (collectively referred to as VimpelCom Group) for total consideration of USD 147,357 thousand. The Group purchased 5,263,102 commonshares (equivalent of 7,017,469 ADS at a purchase price of USD (original) 20.00 per share (USD (original) 15.00 per ADS) representing 13.75% of commonstock and also convertible voting preferred shares of OAO Vimpel-Communications and all the voting preferred shares plus one common share ofZAO VimpelCom-Region for a nominal value. A portion of the consideration payable for this investment of USD 25,000 thousand is to be paid to athird party in 2003 (Note 21).In November <strong>2002</strong>, the Group acquired 17.5% of the common stock of ZAO VimpelCom-Region for a consideration of USD 59,814 thousand and atthe same time disposed of 82.5% of the voting preferred shares of ZAO VimpelCom-Region for a nominal value.At 31 December <strong>2002</strong>, common shares representing 5.57% (2001: 2.94%) of total common shares of OAO Vimpel-Communications were pledged assecurity for liabilities (Notes 15 and 21).Golden TelecomAt 31 December <strong>2002</strong>, the estimated fair value of due from banks was USD 211,148 thousand (2001: USD 135,754 thousand) (Note 29).At 31 December <strong>2002</strong>, due from banks includes reverse sale and repurchase agreements with banks in the amount of USD 100,481 thousand (2001: USD31,860 thousand). The fair value of securities purchased under reverse sale and repurchase agreements with banks was USD 120,750 thousand (2001:USD 42,228 thousand).At 31 December <strong>2002</strong>, balances due from banks amounting to USD 1,825 thousand (2001: USD 4,634 thousand) were of a restricted nature.For interest rates and currency analyses of amounts due from banks at 31 December <strong>2002</strong>, refer to Note 30.9. LOANS AND ADVANCES TO CUSTOMERS<strong>2002</strong>} 2001}CurrentDue in 1 month or less . . . . . . . . . . . . . . . . . . . . . . . . . . . . . . . . . . . . . . . . . . . . . . . . . . . . . . . . . . . . . . . . . . . . . . . . . . . . . . . . . . . . . . . . . . . . . . . . 217,846} 163,389}Due in 1-6 months . . . . . . . . . . . . . . . . . . . . . . . . . . . . . . . . . . . . . . . . . . . . . . . . . . . . . . . . . . . . . . . . . . . . . . . . . . . . . . . . . . . . . . . . . . . . . . . . . . . 597,136} 611,595}Due in 6-12 months . . . . . . . . . . . . . . . . . . . . . . . . . . . . . . . . . . . . . . . . . . . . . . . . . . . . . . . . . . . . . . . . . . . . . . . . . . . . . . . . . . . . . . . . . . . . . . . . . . 829,510} 542,734}Less: Provision for loan impairment (Note 19) . . . . . . . . . . . . . . . . . . . . . . . . . . . . . . . . . . . . . . . . . . . . . . . . . . . . . . . . . . . . . . . . . . . . . . . . . . . . . . . (93,024) (98,649)1,551,468} 1,219,069}Non-currentDue in more than 12 months . . . . . . . . . . . . . . . . . . . . . . . . . . . . . . . . . . . . . . . . . . . . . . . . . . . . . . . . . . . . . . . . . . . . . . . . . . . . . . . . . . . . . . . . . . . . 643,605} 113,411}Less: Provision for loan impairment (Note 19) . . . . . . . . . . . . . . . . . . . . . . . . . . . . . . . . . . . . . . . . . . . . . . . . . . . . . . . . . . . . . . . . . . . . . . . . . . . . . . . (39,056) (6,071)At 31 December <strong>2002</strong>, the Group owned a 40.0% (2001: 47.7%) interest in Golden Telecom, an internet and telecommunications provider operatingin the Russian Federation and Ukraine. The investment in Golden Telecom was acquired for USD 124,267 thousand in 2001. The decrease in theownership interest in Golden Telecom during <strong>2002</strong> arose mainly as a result of acquisition by Golden Telecom of a significant subsidiary, EDN SovintelLLC, which was partially paid for by shares of Golden Telecom. Also refer to Note 36.Economic sector risk concentrations within the customer loan portfolio are as follows:604,549} 107,340}KyivstarAt 31 December <strong>2002</strong>, the Group owned a 20.1% (2001: nil%) interest in Kyivstar, a mobile telecommunications provider operating in Ukraine. Theinvestment in Kyivstar was acquired for USD 93,177 thousand during <strong>2002</strong>.<strong>2002</strong> 2001Amount % Amount %Energy, oil and gas . . . . . . . . . . . . . . . . . . . . . . . . . . . . . . . . . . . . . . . . . . . . . . . . . . . . . . . . . . . . . . . . . . . . 959,012 42 609,078 43Manufacturing and construction . . . . . . . . . . . . . . . . . . . . . . . . . . . . . . . . . . . . . . . . . . . . . . . . . . . . . . . . . . 769,871 34 402,658 28Trade and commerce . . . . . . . . . . . . . . . . . . . . . . . . . . . . . . . . . . . . . . . . . . . . . . . . . . . . . . . . . . . . . . . . . . . 307,007 13 337,393 24Individuals . . . . . . . . . . . . . . . . . . . . . . . . . . . . . . . . . . . . . . . . . . . . . . . . . . . . . . . . . . . . . . . . . . . . . . . . . . 37,895 2 4,236 -Agriculture . . . . . . . . . . . . . . . . . . . . . . . . . . . . . . . . . . . . . . . . . . . . . . . . . . . . . . . . . . . . . . . . . . . . . . . . . . 29,187 1 30,732 2Other . . . . . . . . . . . . . . . . . . . . . . . . . . . . . . . . . . . . . . . . . . . . . . . . . . . . . . . . . . . . . . . . . . . . . . . . . . . . . . 185,125 8 47,032 3Total loans and advances to customers (aggregate amount) . . . . . . . . . . . . . . . . . . . . . . . . . . . . . . . . . . . 2,288,097 100 1,431,129 10070 71
Alfa GroupNotes to the Consolidated Financial Statements for the Year Ended 31 December <strong>2002</strong>(Expressed in thousands of US dollars for presentational purposes only – see Note 3)Alfa GroupNotes to the Consolidated Financial Statements for the Year Ended 31 December <strong>2002</strong>(Expressed in thousands of US dollars for presentational purposes only – see Note 3)9. LOANS AND ADVANCES TO CUSTOMERS (CONTINUED)12. TRADING SECURITIESAt 31 December <strong>2002</strong>, the estimated fair value of loans and advances to customers was USD 2,154,203 thousand (2001: USD 1,326,409 thousand) (Note 29).The Group has 11 borrowers with aggregated loan amounts above USD 50,000 thousand. The aggregate amount of these loans is USD 1,198,919 thousandor 52% of the gross loan portfolio.For interest rates and currency analyses of loans and advances to customers at 31 December <strong>2002</strong>, refer to Note 30. Information on related partybalances is disclosed in Note 34.Loans totalling USD 50,000 thousand (2001: USD 125,539 thousand) have been pledged to third parties as collateral (Note 15).10. TRADE AND OTHER ACCOUNTS RECEIVABLE<strong>2002</strong>} 2001}Receivables relating to securities transactions . . . . . . . . . . . . . . . . . . . . . . . . . . . . . . . . . . . . . . . . . . . . . . . . . . . . . . . . . . . . . . . . . . . . . . . . . . . . . . . 100,003} 30,565}Other receivables and prepayments . . . . . . . . . . . . . . . . . . . . . . . . . . . . . . . . . . . . . . . . . . . . . . . . . . . . . . . . . . . . . . . . . . . . . . . . . . . . . . . . . . . . . . . 92,485} 105,631}Other receivables on banking operations . . . . . . . . . . . . . . . . . . . . . . . . . . . . . . . . . . . . . . . . . . . . . . . . . . . . . . . . . . . . . . . . . . . . . . . . . . . . . . . . . . . 62,094} 88,652}Trade receivables and advances to suppliers . . . . . . . . . . . . . . . . . . . . . . . . . . . . . . . . . . . . . . . . . . . . . . . . . . . . . . . . . . . . . . . . . . . . . . . . . . . . . . . . 40,052} 242,420}Taxes receivable . . . . . . . . . . . . . . . . . . . . . . . . . . . . . . . . . . . . . . . . . . . . . . . . . . . . . . . . . . . . . . . . . . . . . . . . . . . . . . . . . . . . . . . . . . . . . . . . . . . . . 27,671} 29,936}Accrued interest income . . . . . . . . . . . . . . . . . . . . . . . . . . . . . . . . . . . . . . . . . . . . . . . . . . . . . . . . . . . . . . . . . . . . . . . . . . . . . . . . . . . . . . . . . . . . . . . 15,106} 11,166}Less: Provision for impairment (Note 19) . . . . . . . . . . . . . . . . . . . . . . . . . . . . . . . . . . . . . . . . . . . . . . . . . . . . . . . . . . . . . . . . . . . . . . . . . . . . . . . . . . (13,304) (17,568)Total trade and other accounts receivable, net . . . . . . . . . . . . . . . . . . . . . . . . . . . . . . . . . . . . . . . . . . . . . . . . . . . . . . . . . . . . . . . . . . . . . . . . . . . . 324,107} 490,802}Less: Non–current portion, net . . . . . . . . . . . . . . . . . . . . . . . . . . . . . . . . . . . . . . . . . . . . . . . . . . . . . . . . . . . . . . . . . . . . . . . . . . . . . . . . . . . . . . . . . . (28,865) (4,783)Current trade and other accounts receivable, net . . . . . . . . . . . . . . . . . . . . . . . . . . . . . . . . . . . . . . . . . . . . . . . . . . . . . . . . . . . . . . . . . . . . . . . . . . 295,242} 486,019}At 31 December <strong>2002</strong>, the estimated fair value of trade and other accounts receivable was USD 324,107 thousand (2001: USD 490,802 thousand)(Note 29).For information on currency analysis of trade and other accounts receivable at 31 December <strong>2002</strong>, refer to Note 30. Information on related partybalances is disclosed in Note 34.11. INVENTORIES<strong>2002</strong>} 2001}Retail grocery . . . . . . . . . . . . . . . . . . . . . . . . . . . . . . . . . . . . . . . . . . . . . . . . . . . . . . . . . . . . . . . . . . . . . . . . . . . . . . . . . . . . . . . . . . . . . . . . . . . . . . . 15,321} 12,042}Grain . . . . . . . . . . . . . . . . . . . . . . . . . . . . . . . . . . . . . . . . . . . . . . . . . . . . . . . . . . . . . . . . . . . . . . . . . . . . . . . . . . . . . . . . . . . . . . . . . . . . . . . . . . . . . 2,302} 534}Metal . . . . . . . . . . . . . . . . . . . . . . . . . . . . . . . . . . . . . . . . . . . . . . . . . . . . . . . . . . . . . . . . . . . . . . . . . . . . . . . . . . . . . . . . . . . . . . . . . . . . . . . . . . . . . 2,202} 9,090}Industrial woods . . . . . . . . . . . . . . . . . . . . . . . . . . . . . . . . . . . . . . . . . . . . . . . . . . . . . . . . . . . . . . . . . . . . . . . . . . . . . . . . . . . . . . . . . . . . . . . . . . . . . 1,921} -}Crude oil and oil products . . . . . . . . . . . . . . . . . . . . . . . . . . . . . . . . . . . . . . . . . . . . . . . . . . . . . . . . . . . . . . . . . . . . . . . . . . . . . . . . . . . . . . . . . . . . . . 1,564} 57,366}Other goods . . . . . . . . . . . . . . . . . . . . . . . . . . . . . . . . . . . . . . . . . . . . . . . . . . . . . . . . . . . . . . . . . . . . . . . . . . . . . . . . . . . . . . . . . . . . . . . . . . . . . . . . 1,365} 5,633}Spirits . . . . . . . . . . . . . . . . . . . . . . . . . . . . . . . . . . . . . . . . . . . . . . . . . . . . . . . . . . . . . . . . . . . . . . . . . . . . . . . . . . . . . . . . . . . . . . . . . . . . . . . . . . . . . 548} 6,322}Prepaid expenses . . . . . . . . . . . . . . . . . . . . . . . . . . . . . . . . . . . . . . . . . . . . . . . . . . . . . . . . . . . . . . . . . . . . . . . . . . . . . . . . . . . . . . . . . . . . . . . . . . . . 145} 9,747}Tea . . . . . . . . . . . . . . . . . . . . . . . . . . . . . . . . . . . . . . . . . . . . . . . . . . . . . . . . . . . . . . . . . . . . . . . . . . . . . . . . . . . . . . . . . . . . . . . . . . . . . . . . . . . . . . . -} 2,973}Sugar . . . . . . . . . . . . . . . . . . . . . . . . . . . . . . . . . . . . . . . . . . . . . . . . . . . . . . . . . . . . . . . . . . . . . . . . . . . . . . . . . . . . . . . . . . . . . . . . . . . . . . . . . . . . . -} 1,091}Other . . . . . . . . . . . . . . . . . . . . . . . . . . . . . . . . . . . . . . . . . . . . . . . . . . . . . . . . . . . . . . . . . . . . . . . . . . . . . . . . . . . . . . . . . . . . . . . . . . . . . . . . . . . . . -} 4,612}Less: Provision for impairment (Note 19) . . . . . . . . . . . . . . . . . . . . . . . . . . . . . . . . . . . . . . . . . . . . . . . . . . . . . . . . . . . . . . . . . . . . . . . . . . . . . . . . . . (1,491) (1,584)<strong>2002</strong> 2001Russian Federation Eurobonds . . . . . . . . . . . . . . . . . . . . . . . . . . . . . . . . . . . . . . . . . . . . . . . . . . . . . . . . . . . . . . . . . . . . . . . . . . . . . . . . . . . . . . . . . . 153,463 31,242Corporate Eurobonds . . . . . . . . . . . . . . . . . . . . . . . . . . . . . . . . . . . . . . . . . . . . . . . . . . . . . . . . . . . . . . . . . . . . . . . . . . . . . . . . . . . . . . . . . . . . . . . . . 100,873 48,249Corporate bonds . . . . . . . . . . . . . . . . . . . . . . . . . . . . . . . . . . . . . . . . . . . . . . . . . . . . . . . . . . . . . . . . . . . . . . . . . . . . . . . . . . . . . . . . . . . . . . . . . . . . . 61,116 32,095Corporate shares . . . . . . . . . . . . . . . . . . . . . . . . . . . . . . . . . . . . . . . . . . . . . . . . . . . . . . . . . . . . . . . . . . . . . . . . . . . . . . . . . . . . . . . . . . . . . . . . . . . . 29,589 21,578Eurobonds of other states . . . . . . . . . . . . . . . . . . . . . . . . . . . . . . . . . . . . . . . . . . . . . . . . . . . . . . . . . . . . . . . . . . . . . . . . . . . . . . . . . . . . . . . . . . . . . . 19,799 2,885ADRs and GDRs . . . . . . . . . . . . . . . . . . . . . . . . . . . . . . . . . . . . . . . . . . . . . . . . . . . . . . . . . . . . . . . . . . . . . . . . . . . . . . . . . . . . . . . . . . . . . . . . . . . . . 10,582 958Federal Loan Bonds (OFZ) . . . . . . . . . . . . . . . . . . . . . . . . . . . . . . . . . . . . . . . . . . . . . . . . . . . . . . . . . . . . . . . . . . . . . . . . . . . . . . . . . . . . . . . . . . . . . . 9,765 4,255Bills of exchange of Russian banks and enterprises . . . . . . . . . . . . . . . . . . . . . . . . . . . . . . . . . . . . . . . . . . . . . . . . . . . . . . . . . . . . . . . . . . . . . . . . . . . 8,166 24,389Other securities . . . . . . . . . . . . . . . . . . . . . . . . . . . . . . . . . . . . . . . . . . . . . . . . . . . . . . . . . . . . . . . . . . . . . . . . . . . . . . . . . . . . . . . . . . . . . . . . . . . . . . 6,444 5,380399,797 171,031Russian Federation Eurobonds are interest bearing securities denominated in US dollars, issued by the Ministry of Finance of the Russian Federation, andare freely tradable internationally. These bonds have maturity dates ranging from 2018 to 2030. The annual coupon rates on these bonds range from 5.0%to 12.7%, and yields to maturity from 8.6% to 9.4% at 31 December <strong>2002</strong>, depending on the type of bond issue.Corporate Eurobonds are interest bearing securities denominated in US dollars and issued by large Russian companies and are freely tradable internationally.The annual coupon rates on these bonds range from 9.1% to 12.8% and yields to maturity from 8.9% to 13.3% at 31 December <strong>2002</strong>, and maturitydates range from 2004 through 2009.Corporate bonds are interest bearing securities denominated in Russian Roubles, issued by large Russian companies and are freely tradable in theRussian Federation. The bonds have maturity dates ranging from 2003 to 2006 and yields to maturity from 7.8% to 19.1% at 31 December <strong>2002</strong>. Theannual coupon rates of these bonds range from 5.0% to 19.6%.Corporate shares are shares of Russian and Ukrainian companies.Eurobonds of other states are interest bearing securities denominated in US dollars, issued by governmental bodies of other states, and are freely tradableinternationally. These bonds have maturity dates ranging from 2007 to 2020, coupon rates of approximately 8.0% to 14.5% and yields to maturityfrom 15.5% to 19.9% at 31 December <strong>2002</strong>.Bills of exchange are interest bearing securities denominated in Russian Roubles, issued by large Russian companies, and are freely tradable in theRussian Federation. They have maturity dates from January 2003 to December 2003 and yields to maturity from 14.8% to 16.9% at 31 December <strong>2002</strong>.American Depository Receipts (“ADRs”) and Global Depository Receipts (“GDRs”) are based on shares of Russian companies.Trading securities with a fair value of USD 136,772 thousand (2001: USD 16,201 thousand) have been sold to third parties under sale and repurchaseagreements with banks (Note 17).13. CASH AND CASH EQUIVALENTS<strong>2002</strong> 2001Cash in hand and in bank current, correspondent and deposit accounts . . . . . . . . . . . . . . . . . . . . . . . . . . . . . . . . . . . . . . . . . . . . . . . . . . . . . . . . . . . . 329,204 383,275Cash balances with the CBRF (other than mandatory cash balances) . . . . . . . . . . . . . . . . . . . . . . . . . . . . . . . . . . . . . . . . . . . . . . . . . . . . . . . . . . . . . . 72,460 227,738Other liquid assets . . . . . . . . . . . . . . . . . . . . . . . . . . . . . . . . . . . . . . . . . . . . . . . . . . . . . . . . . . . . . . . . . . . . . . . . . . . . . . . . . . . . . . . . . . . . . . . . . . . 4,030 8,634For interest rates and currency analyses of cash and cash equivalents at 31 December <strong>2002</strong>, refer to Note 30.405,694 619,64723,877} 107,826}72 73
Alfa GroupNotes to the Consolidated Financial Statements for the Year Ended 31 December <strong>2002</strong>(Expressed in thousands of US dollars for presentational purposes only – see Note 3)Alfa GroupNotes to the Consolidated Financial Statements for the Year Ended 31 December <strong>2002</strong>(Expressed in thousands of US dollars for presentational purposes only – see Note 3)14. SHARE CAPITAL AND SHARE PREMIUM15. BORROWINGS (CONTINUED)The authorised, issued and fully paid share capital of CTF Holdings Limited consists of 985,774 ordinary shares of GBP 1.00 each.In accordance with the statutes of CTF Holdings Limited, the share premium represents GBP 9 (USD 15.40) for each of the 983,774 new shares issued in 1996.At 31 December <strong>2002</strong> and 31 December 2001 the carrying value of issued share capital and share premium, after application of IAS 29, was USD 19,510thousand and USD 11,027 thousand, respectively.In <strong>2002</strong> the Group declared dividends of USD 9,299 thousand (2001: USD 10,232 thousand).Certain members of management of the Group were the holders of call options with an expiration date of 31 January <strong>2002</strong>. Under the terms of these calloption agreements, the holders were entitled to purchase 3.8% of the outstanding shares of Alfa Finance Holdings S.A. for USD 5,700 thousand. Theholders exercised these options in December 2001 (2.8%) and in January <strong>2002</strong> (1.0%). At the same time the members of Management were also holdersof put options with expiration dates of 31 January <strong>2002</strong> (1.0%) and 31 January 2003 (2.8%). Per the terms of the put option agreements, the holders, inJanuary <strong>2002</strong> (1.0%) and in January 2003 (2.8%) required Alfa Finance Holdings S.A. to repurchase 3.8% of Alfa Finance Holdings S.A. shares acquiredby exercising the aforementioned call options for a consideration equal to 90% of the pro-rata amount of the audited consolidated shareholders’ equityof Alfa Finance Holdings S.A. at 31 December 2001. For these options the estimated difference between the price of the call option and the proceeds tobe paid by the Group under the put option has been recorded at the date of grant within staff costs in the consolidated statement of income (Note 23).At 31 December <strong>2002</strong>, certain members of Management of the Group were the holders of call options with an expiration date of 1 October 2003. Underthe terms of the call option agreements, the holders may purchase 3.2% of the outstanding shares of Alfa Finance Holdings S.A. for USD 4,800 thousand.At the date of grant shares subject to these call options were reclassified into minority interest and the Group recorded the difference between thecall option proceeds and the carrying value of the respective equity interest in Alfa Finance Holdings S.A. within staff costs in the consolidated statementof income (Note 23). These options were exercised in January 2003 (2.2%) and in July 2003 (1.0%).In addition, at 31 December <strong>2002</strong>, a member of Management of the Group is the holder of a call option which was issued in December 2001 and whichexpires on 31 December 2006. Under the terms of the option agreement, the holder may purchase such a number of the outstanding shares of AlfaFinance Holdings S.A. which when valued on the basis of the audited consolidated shareholders’ equity of Alfa Finance Holdings S.A. at 31 December2001 would be equal to 1% of the audited consolidated shareholders’ equity of TNK Industrial at 31 December 2001. The purchase price per share is tobe based upon the audited consolidated shareholders’ equity of Alfa Finance Holdings S.A. at 31 December 2001. At the date of grant shares subject tothis call option were reclassified into minority interest and the Group recorded the difference between the call option proceeds and the carrying valueof the respective equity interest in Alfa Finance Holdings S.A. within staff costs in the consolidated statement of income (Note 23).15. BORROWINGSThe principal borrowings for particular business segments are:<strong>2002</strong> 2001Financial ServicesBills of exchange . . . . . . . . . . . . . . . . . . . . . . . . . . . . . . . . . . . . . . . . . . . . . . . . . . . . . . . . . . . . . . . . . . . . . . . . . . . . . . . . . . . . . . . . . . . . . . . . . . . . 596,021 468,760Euro Medium Term Notes . . . . . . . . . . . . . . . . . . . . . . . . . . . . . . . . . . . . . . . . . . . . . . . . . . . . . . . . . . . . . . . . . . . . . . . . . . . . . . . . . . . . . . . . . . . . . 171,143 -Loan from the Agency for Restructuring of Credit Organisations . . . . . . . . . . . . . . . . . . . . . . . . . . . . . . . . . . . . . . . . . . . . . . . . . . . . . . . . . . . . . . . . . 15,930 33,373Russian Rouble denominated bonds . . . . . . . . . . . . . . . . . . . . . . . . . . . . . . . . . . . . . . . . . . . . . . . . . . . . . . . . . . . . . . . . . . . . . . . . . . . . . . . . . . . . . . 22,468 -US Commercial Paper . . . . . . . . . . . . . . . . . . . . . . . . . . . . . . . . . . . . . . . . . . . . . . . . . . . . . . . . . . . . . . . . . . . . . . . . . . . . . . . . . . . . . . . . . . . . . . . . . - 22,536Other . . . . . . . . . . . . . . . . . . . . . . . . . . . . . . . . . . . . . . . . . . . . . . . . . . . . . . . . . . . . . . . . . . . . . . . . . . . . . . . . . . . . . . . . . . . . . . . . . . . . . . . . . . . . . 584 -Russia, CIS and Southeast Asia CommoditiesLoans from financial institutions . . . . . . . . . . . . . . . . . . . . . . . . . . . . . . . . . . . . . . . . . . . . . . . . . . . . . . . . . . . . . . . . . . . . . . . . . . . . . . . . . . . . . . . . . 49,355 16,952Long-term bonds payable . . . . . . . . . . . . . . . . . . . . . . . . . . . . . . . . . . . . . . . . . . . . . . . . . . . . . . . . . . . . . . . . . . . . . . . . . . . . . . . . . . . . . . . . . . . . . . 13,723 -Loans from non-financial institutions . . . . . . . . . . . . . . . . . . . . . . . . . . . . . . . . . . . . . . . . . . . . . . . . . . . . . . . . . . . . . . . . . . . . . . . . . . . . . . . . . . . . . 10,436 12,923Bills of exchange . . . . . . . . . . . . . . . . . . . . . . . . . . . . . . . . . . . . . . . . . . . . . . . . . . . . . . . . . . . . . . . . . . . . . . . . . . . . . . . . . . . . . . . . . . . . . . . . . . . . 8,496 10,903Finance lease liability . . . . . . . . . . . . . . . . . . . . . . . . . . . . . . . . . . . . . . . . . . . . . . . . . . . . . . . . . . . . . . . . . . . . . . . . . . . . . . . . . . . . . . . . . . . . . . . . . 1,034 1,195Other borrowings . . . . . . . . . . . . . . . . . . . . . . . . . . . . . . . . . . . . . . . . . . . . . . . . . . . . . . . . . . . . . . . . . . . . . . . . . . . . . . . . . . . . . . . . . . . . . . . . . . . . 656 -International CommoditiesShort-term borrowings . . . . . . . . . . . . . . . . . . . . . . . . . . . . . . . . . . . . . . . . . . . . . . . . . . . . . . . . . . . . . . . . . . . . . . . . . . . . . . . . . . . . . . . . . . . . . . . . -} 116,824}Bank overdraft . . . . . . . . . . . . . . . . . . . . . . . . . . . . . . . . . . . . . . . . . . . . . . . . . . . . . . . . . . . . . . . . . . . . . . . . . . . . . . . . . . . . . . . . . . . . . . . . . . . . . . -} 58,408}<strong>2002</strong>} 2001}Retail TradeLoan from IFI . . . . . . . . . . . . . . . . . . . . . . . . . . . . . . . . . . . . . . . . . . . . . . . . . . . . . . . . . . . . . . . . . . . . . . . . . . . . . . . . . . . . . . . . . . . . . . . . . . . . . . . 27,986} 35,769}Moscow government loan . . . . . . . . . . . . . . . . . . . . . . . . . . . . . . . . . . . . . . . . . . . . . . . . . . . . . . . . . . . . . . . . . . . . . . . . . . . . . . . . . . . . . . . . . . . . . . 123} 43}Other borrowings . . . . . . . . . . . . . . . . . . . . . . . . . . . . . . . . . . . . . . . . . . . . . . . . . . . . . . . . . . . . . . . . . . . . . . . . . . . . . . . . . . . . . . . . . . . . . . . . . . . . 55} -}Other segments borrowingsOther borrowings . . . . . . . . . . . . . . . . . . . . . . . . . . . . . . . . . . . . . . . . . . . . . . . . . . . . . . . . . . . . . . . . . . . . . . . . . . . . . . . . . . . . . . . . . . . . . . . . . . . . -} 4,620}Total borrowings . . . . . . . . . . . . . . . . . . . . . . . . . . . . . . . . . . . . . . . . . . . . . . . . . . . . . . . . . . . . . . . . . . . . . . . . . . . . . . . . . . . . . . . . . . . . . . . . . . . . 918,010} 782,306}Less: Non-current portion . . . . . . . . . . . . . . . . . . . . . . . . . . . . . . . . . . . . . . . . . . . . . . . . . . . . . . . . . . . . . . . . . . . . . . . . . . . . . . . . . . . . . . . . . . . . . . (314,170) (72,606)Total current borrowings . . . . . . . . . . . . . . . . . . . . . . . . . . . . . . . . . . . . . . . . . . . . . . . . . . . . . . . . . . . . . . . . . . . . . . . . . . . . . . . . . . . . . . . . . . . . . . 603,840} 709,700}At 31 December <strong>2002</strong>, the estimated fair value of borrowings was USD 920,664 thousand (2001: USD 783,699 thousand) (Note 29).Financial ServicesBills of exchange represent borrowings by Alfa Bank Group. The weighted average interest rate on bills of exchange at 31 December <strong>2002</strong> was 15.6% onRussian Rouble notes and 6.1% on bills of exchange issued in foreign currency. Information on related party bills of exchange is disclosed in Note 34.On 19 November <strong>2002</strong> Alfa Bank Group issued US dollars denominated Eurobonds with a nominal value of USD 175,000 thousand. The bonds carrya fixed coupon at a rate of 10.75% per annum payable semi-annually and mature on 19 November 2005. The bonds were issued at a discount of 0.5% tothe nominal value and issue costs amounted to USD 3,032 thousand. Thus, net issue proceeds amounted to USD 171,093 thousand and the effectiveinterest rate at origination was 12.0%.On 14 June <strong>2002</strong> Alfa Bank Group issued Russian Rouble denominated bonds maturing in June 2007 at a nominal value of RR 908,758 thousand. Thebonds have a floating interest rate and the coupon is payable semi-annually. At 31 December <strong>2002</strong>, coupon was to be paid at an interest rate of 18% perannum. Alfa Bank issued an irrevocable offer to redeem the bonds at nominal value along with accrued interest on 13 June 2003.In 1999 Alfa Bank obtained financing from the Agency for Restructuring of Credit Organisations in the Russian Federation (“ARCO”). The total nominalprincipal amount outstanding at 31 December <strong>2002</strong> was RR 508,800 thousand (2001: RR 950,800 thousand). The loan bears a nominal annualinterest rate of 50% of the refinancing rate set by the CBRF. Initially, the loan was due to mature during the second half of 2001. During 2001, the loanwas rescheduled on the same terms and currently is to be repaid by 30 September 2003. With respect to the loan, at 31 December <strong>2002</strong>, Alfa Bankpledged customer loans with a total nominal amount of USD 50,000 thousand (2001: USD 125,539 thousand), investments available for sale with fairvalue of USD 5,227 thousand (2001: USD 6,227 thousand) and premises and equipment with a carrying value of USD 3,571 thousand (2001: USD3,244 thousand) as collateral. Also, at 31 December <strong>2002</strong> and 31 December 2001 25% of Alfa Bank’s shares were pledged as collateral which gave ARCOvoting rights, but not an economic interest in Alfa Bank.The US Commercial Paper Notes matured and were repaid along with interest prior to 31 December <strong>2002</strong>.International CommoditiesAt 31 December 2001, Crown Resources had facilities of USD 1,279,403 thousand with major western banks, which could be used in either the formof letters of credit, guarantees or pre-financing loans for the purchase of crude oil, oil products and sugar. The facilities required Crown Resources toprovide appropriate security as and when they were used. Security was provided in the form of various liquid assets of Crown Resources. USD 420,911thousand of the facilities were used at 31 December 2001 by way of bank credit as noted above and letters of credit issued (Note 31). Interest rates onthese borrowings were from LIBOR plus 1.0% to plus 5.25% (2001: LIBOR plus 1.0% to plus 6.5%).Russia, CIS and Southeast Asia CommoditiesLoans from financial institutions are denominated in US dollars and are secured by provisions of the rights on export of crude oil in accordance with anagreement and rights on purchase of crude oil from ZAO Petrosakh and pledge of common shares representing 2.63% of total common shares of OAOVimpel-Communications (Note 7). The loans bear interest at 14% per annum and LIBOR plus 6% per annum.Loans from non-financial institutions are denominated in US dollars, unsecured and bear interest at rates from 15% to 16%.74 75
Alfa GroupNotes to the Consolidated Financial Statements for the Year Ended 31 December <strong>2002</strong>(Expressed in thousands of US dollars for presentational purposes only – see Note 3)Alfa GroupNotes to the Consolidated Financial Statements for the Year Ended 31 December <strong>2002</strong>(Expressed in thousands of US dollars for presentational purposes only – see Note 3)15. BORROWINGS (CONTINUED)The Alfa Eco Group, pursuant to a program to raise funds for operational purposes, issued bills of exchange. The notes are unsecured, Russian Roubledenominated, and bear interest at the rate of 19% to 36% per annum and mature in 3 to 12 months.The Alfa Eco Group, in accordance with the existing funds raising program for core business financing, issued long-term notes and bonds. Notes and bondsare unsecured and denominated in Russian Roubles and bear interest at the rate of 20.5% (bonds) and 27% (notes) per annum with maturity up to 2005.Retail TradeAn International Financing Institution (“IFI”) holds a fixed charge over certain property, plant and equipment of Perekriostok as a security over a loanfacility provided to Perekriostok. The net book value of property, plant and equipment, over which the security is held, is USD 32,814 thousand (2001:USD 34,397 thousand). Also all shares in Perekriostok are pledged as security for the loan facility. The loan carries an interest rate of LIBOR plus 6%.Under the terms of an amendment to the loan agreement dated 4 August 2000 the repayment schedule was extended to 16 January 2007.Maturity of non-current borrowings <strong>2002</strong> 20012003 . . . . . . . . . . . . . . . . . . . . . . . . . . . . . . . . . . . . . . . . . . . . . . . . . . . . . . . . . . . . . . . . . . . . . . . . . . . . . . . . . . . . . . . . . . . . . . . . . . . . . . . . . . . . . . - 46,4822004 . . . . . . . . . . . . . . . . . . . . . . . . . . . . . . . . . . . . . . . . . . . . . . . . . . . . . . . . . . . . . . . . . . . . . . . . . . . . . . . . . . . . . . . . . . . . . . . . . . . . . . . . . . . . . . 104,833 9,1852005 . . . . . . . . . . . . . . . . . . . . . . . . . . . . . . . . . . . . . . . . . . . . . . . . . . . . . . . . . . . . . . . . . . . . . . . . . . . . . . . . . . . . . . . . . . . . . . . . . . . . . . . . . . . . . . 178,113 9,0492006 . . . . . . . . . . . . . . . . . . . . . . . . . . . . . . . . . . . . . . . . . . . . . . . . . . . . . . . . . . . . . . . . . . . . . . . . . . . . . . . . . . . . . . . . . . . . . . . . . . . . . . . . . . . . . . 6,668 7,8902007 . . . . . . . . . . . . . . . . . . . . . . . . . . . . . . . . . . . . . . . . . . . . . . . . . . . . . . . . . . . . . . . . . . . . . . . . . . . . . . . . . . . . . . . . . . . . . . . . . . . . . . . . . . . . . . 22,647 -Thereafter . . . . . . . . . . . . . . . . . . . . . . . . . . . . . . . . . . . . . . . . . . . . . . . . . . . . . . . . . . . . . . . . . . . . . . . . . . . . . . . . . . . . . . . . . . . . . . . . . . . . . . . . . . 1,909 -Total non-current borrowings . . . . . . . . . . . . . . . . . . . . . . . . . . . . . . . . . . . . . . . . . . . . . . . . . . . . . . . . . . . . . . . . . . . . . . . . . . . . . . . . . . . . . . . . . . 314,170 72,60616. AMOUNTS OWED TO DEPOSITORS<strong>2002</strong>} 2001}Demand deposits . . . . . . . . . . . . . . . . . . . . . . . . . . . . . . . . . . . . . . . . . . . . . . . . . . . . . . . . . . . . . . . . . . . . . . . . . . . . . . . . . . . . . . . . . . . . . . . . . . . . 1,368,082} 1,165,654}Due in 1-6 months . . . . . . . . . . . . . . . . . . . . . . . . . . . . . . . . . . . . . . . . . . . . . . . . . . . . . . . . . . . . . . . . . . . . . . . . . . . . . . . . . . . . . . . . . . . . . . . . . . . 343,296} 214,256}Due in 6-12 months . . . . . . . . . . . . . . . . . . . . . . . . . . . . . . . . . . . . . . . . . . . . . . . . . . . . . . . . . . . . . . . . . . . . . . . . . . . . . . . . . . . . . . . . . . . . . . . . . . 197,772} 57,918}Due in more than 12 months . . . . . . . . . . . . . . . . . . . . . . . . . . . . . . . . . . . . . . . . . . . . . . . . . . . . . . . . . . . . . . . . . . . . . . . . . . . . . . . . . . . . . . . . . . . . 9,592} 4,205}Total amounts owed to depositors . . . . . . . . . . . . . . . . . . . . . . . . . . . . . . . . . . . . . . . . . . . . . . . . . . . . . . . . . . . . . . . . . . . . . . . . . . . . . . . . . . . . . . 1,918,742} 1,442,033}Less: Non-current portion . . . . . . . . . . . . . . . . . . . . . . . . . . . . . . . . . . . . . . . . . . . . . . . . . . . . . . . . . . . . . . . . . . . . . . . . . . . . . . . . . . . . . . . . . . . . . . (9,592) (4,205)Total amounts owed to depositors - current portion . . . . . . . . . . . . . . . . . . . . . . . . . . . . . . . . . . . . . . . . . . . . . . . . . . . . . . . . . . . . . . . . . . . . . . . . . 1,909,150} 1,437,828}Economic sector concentrations within amounts owed to depositors are as follows:<strong>2002</strong> 2001Amount % Amount %Individuals . . . . . . . . . . . . . . . . . . . . . . . . . . . . . . . . . . . . . . . . . . . . . . . . . . . . . . . . . . . . . . . . . . . . . . . . . . 788,032 41 528,964 37Energy, oil and gas . . . . . . . . . . . . . . . . . . . . . . . . . . . . . . . . . . . . . . . . . . . . . . . . . . . . . . . . . . . . . . . . . . . . 434,600 23 296,277 20Finance and investment companies . . . . . . . . . . . . . . . . . . . . . . . . . . . . . . . . . . . . . . . . . . . . . . . . . . . . . . . . 164,772 8 156,582 11Manufacturing and construction . . . . . . . . . . . . . . . . . . . . . . . . . . . . . . . . . . . . . . . . . . . . . . . . . . . . . . . . . . 155,810 8 200,399 14Trade and commerce . . . . . . . . . . . . . . . . . . . . . . . . . . . . . . . . . . . . . . . . . . . . . . . . . . . . . . . . . . . . . . . . . . . 139,600 7 51,019 3Government bodies and municipals . . . . . . . . . . . . . . . . . . . . . . . . . . . . . . . . . . . . . . . . . . . . . . . . . . . . . . . . 87,623 5 73,340 5Agriculture . . . . . . . . . . . . . . . . . . . . . . . . . . . . . . . . . . . . . . . . . . . . . . . . . . . . . . . . . . . . . . . . . . . . . . . . . . 18,695 1 25,427 2Other . . . . . . . . . . . . . . . . . . . . . . . . . . . . . . . . . . . . . . . . . . . . . . . . . . . . . . . . . . . . . . . . . . . . . . . . . . . . . . 129,610 7 110,025 81,918,742 100 1,442,033 100As at 31 December <strong>2002</strong>, the estimated fair value of amounts owed to depositors was USD 1,918,742 thousand (2001: USD 1,442,033 thousand) (Note 29).Included in amounts owed to depositors are deposits of USD 10,463 thousand (2001: USD 8,621 thousand) held as collateral for irrevocable commitmentsunder import letters of credit (Note 31).17. DUE TO BANKS18. INCOME TAX<strong>2002</strong>} 2001}Current tax charge . . . . . . . . . . . . . . . . . . . . . . . . . . . . . . . . . . . . . . . . . . . . . . . . . . . . . . . . . . . . . . . . . . . . . . . . . . . . . . . . . . . . . . . . . . . . . . . . . . . 7,487} 10,822}Deferred taxation movement due to:- Origination and reversal of temporary differences . . . . . . . . . . . . . . . . . . . . . . . . . . . . . . . . . . . . . . . . . . . . . . . . . . . . . . . . . . . . . . . . . . . . . . . . . 3,285} (12,824)- Effect of reduction in tax rate . . . . . . . . . . . . . . . . . . . . . . . . . . . . . . . . . . . . . . . . . . . . . . . . . . . . . . . . . . . . . . . . . . . . . . . . . . . . . . . . . . . . . . . . . -} (64,743)Income tax charge/(credit) . . . . . . . . . . . . . . . . . . . . . . . . . . . . . . . . . . . . . . . . . . . . . . . . . . . . . . . . . . . . . . . . . . . . . . . . . . . . . . . . . . . . . . . . . . . . 10,772} (66,745)Net profit before income tax for financial reporting purposes is reconciled to tax expense as follows:<strong>2002</strong>} 2001}Demand deposits . . . . . . . . . . . . . . . . . . . . . . . . . . . . . . . . . . . . . . . . . . . . . . . . . . . . . . . . . . . . . . . . . . . . . . . . . . . . . . . . . . . . . . . . . . . . . . . . . . . . 550,298} 319,980}Due in 1-6 months . . . . . . . . . . . . . . . . . . . . . . . . . . . . . . . . . . . . . . . . . . . . . . . . . . . . . . . . . . . . . . . . . . . . . . . . . . . . . . . . . . . . . . . . . . . . . . . . . . . 97,342} 6,752}Due in 6-12 months . . . . . . . . . . . . . . . . . . . . . . . . . . . . . . . . . . . . . . . . . . . . . . . . . . . . . . . . . . . . . . . . . . . . . . . . . . . . . . . . . . . . . . . . . . . . . . . . . . 4,410} 34,269}Due in more than 12 months . . . . . . . . . . . . . . . . . . . . . . . . . . . . . . . . . . . . . . . . . . . . . . . . . . . . . . . . . . . . . . . . . . . . . . . . . . . . . . . . . . . . . . . . . . . . 17,642} 10,459}Total due to banks . . . . . . . . . . . . . . . . . . . . . . . . . . . . . . . . . . . . . . . . . . . . . . . . . . . . . . . . . . . . . . . . . . . . . . . . . . . . . . . . . . . . . . . . . . . . . . . . . . . 669,692} 371,460}Less: Non-current portion . . . . . . . . . . . . . . . . . . . . . . . . . . . . . . . . . . . . . . . . . . . . . . . . . . . . . . . . . . . . . . . . . . . . . . . . . . . . . . . . . . . . . . . . . . . . . . (17,642) (10,459)Total due to banks – current portion . . . . . . . . . . . . . . . . . . . . . . . . . . . . . . . . . . . . . . . . . . . . . . . . . . . . . . . . . . . . . . . . . . . . . . . . . . . . . . . . . . . . 652,050} 361,001}At 31 December <strong>2002</strong>, due to banks included sale and repurchase agreements with banks in amount of USD 163,840 thousand (2001: USD 39,390 thousand).Trading securities with a fair value of USD 136,772 thousand (2001: USD 16,201 thousand) were sold to third parties under sale and repurchaseagreements with banks (Note 12).In addition, at 31 December <strong>2002</strong>, securities purchased by the Group under reverse sale and repurchase agreements with a fair value of USD 61,811 thousand(2001: USD 35,950 thousand) were sold by the Group under sale and repurchase agreements with banks (Note 8).At 31 December <strong>2002</strong>, the estimated fair value of due to banks was USD 669,692 thousand (2001: USD 371,460 thousand) (Note 29).For interest rates and currency analyses of amounts due to banks at 31 December <strong>2002</strong>, refer to Note 30.<strong>2002</strong>} 2001}Profit before income tax and minority interest . . . . . . . . . . . . . . . . . . . . . . . . . . . . . . . . . . . . . . . . . . . . . . . . . . . . . . . . . . . . . . . . . . . . . . . . . . . . . . . 843,117} 983,036}Theoretical tax at applicable statutory rate . . . . . . . . . . . . . . . . . . . . . . . . . . . . . . . . . . . . . . . . . . . . . . . . . . . . . . . . . . . . . . . . . . . . . . . . . . . . . . . . . . 52,341} 63,542}Tax effect of items which are not deductible or assessable for taxation purposes:- Income taxed at different tax rates . . . . . . . . . . . . . . . . . . . . . . . . . . . . . . . . . . . . . . . . . . . . . . . . . . . . . . . . . . . . . . . . . . . . . . . . . . . . . . . . . . . . (7,444) (15,334)- Tax exempt income . . . . . . . . . . . . . . . . . . . . . . . . . . . . . . . . . . . . . . . . . . . . . . . . . . . . . . . . . . . . . . . . . . . . . . . . . . . . . . . . . . . . . . . . . . . . . . . . (62,317) (41,518)- Non-deductible expenses . . . . . . . . . . . . . . . . . . . . . . . . . . . . . . . . . . . . . . . . . . . . . . . . . . . . . . . . . . . . . . . . . . . . . . . . . . . . . . . . . . . . . . . . . . . . 15,401} 41,169}- Movement in loss carried forward . . . . . . . . . . . . . . . . . . . . . . . . . . . . . . . . . . . . . . . . . . . . . . . . . . . . . . . . . . . . . . . . . . . . . . . . . . . . . . . . . . . . . 1,403} 3,630}- Non-temporary elements of monetary loss . . . . . . . . . . . . . . . . . . . . . . . . . . . . . . . . . . . . . . . . . . . . . . . . . . . . . . . . . . . . . . . . . . . . . . . . . . . . . . 4,636} (6,294)Inflation effect on deferred tax balance at the beginning of year . . . . . . . . . . . . . . . . . . . . . . . . . . . . . . . . . . . . . . . . . . . . . . . . . . . . . . . . . . . . . . . . . . (1,209) (17,472)Effect of reduction in tax rate . . . . . . . . . . . . . . . . . . . . . . . . . . . . . . . . . . . . . . . . . . . . . . . . . . . . . . . . . . . . . . . . . . . . . . . . . . . . . . . . . . . . . . . . . . . -} (64,743)Non-recognized net deferred tax asset movement . . . . . . . . . . . . . . . . . . . . . . . . . . . . . . . . . . . . . . . . . . . . . . . . . . . . . . . . . . . . . . . . . . . . . . . . . . . (96) (5,161)Other IAS adjustments that have a non-temporary nature . . . . . . . . . . . . . . . . . . . . . . . . . . . . . . . . . . . . . . . . . . . . . . . . . . . . . . . . . . . . . . . . . . . . . . 8,057} (24,564)Income tax charge/(credit) for the year . . . . . . . . . . . . . . . . . . . . . . . . . . . . . . . . . . . . . . . . . . . . . . . . . . . . . . . . . . . . . . . . . . . . . . . . . . . . . . . . . . 10,772} (66,745)For interest rates and currency analyses of amounts owed to depositors at 31 December <strong>2002</strong>, refer to Note 30. Information on related party balances isdisclosed in Note 34.76 77
Alfa GroupNotes to the Consolidated Financial Statements for the Year Ended 31 December <strong>2002</strong>(Expressed in thousands of US dollars for presentational purposes only – see Note 3)Alfa GroupNotes to the Consolidated Financial Statements for the Year Ended 31 December <strong>2002</strong>(Expressed in thousands of US dollars for presentational purposes only – see Note 3)18. INCOME TAX (CONTINUED)Deferred income taxDifferences between IFRS and statutory taxation and reporting regulations give rise to certain temporary differences between the carrying value of certainassets and liabilities for financial reporting purposes and for income tax purposes.An analysis of the temporary differences and calculations of deferred income tax was performed individually for each company included in the consolidatedfinancial statements. To determine the tax effect, tax rates effective on the date of the financial statements were used, taking into considerationthe type of activity and each company’s status (24% for financial services and trading activities; 0%-5% for oil and gas, telecommunications and otheractivities conducted through low tax and tax free jurisdictions). For companies engaged in several types of activities, the tax was calculated on the basisof the main type of activities. Thus, the theoretical tax at the applicable statutory rates calculated above is an aggregation of the aforementioned tax rate.The difference between the tax charge calculated at the standard profit tax rate for main activities and the weighted average rate is shown as “Incometaxed at different tax rates” in the reconciliation above.In the context of the Group’s current structure, tax losses and current tax assets of different companies may not be offset against current tax liabilitiesand taxable profits of other companies and, accordingly, taxes may accrue even where there is a net consolidated tax loss. Therefore, a deferred tax assetof one company of the Group may not be offset against a deferred tax liability of another company.Investments available for sale are held and disposed of primarily by consolidated subsidiaries of the Group operating in tax-free jurisdictions. Therefore,the net fair value gains arising on investments available for sale recorded directly in the consolidated statement of changes in shareholders’ equity hadno impact on the deferred tax position of the Group.Deferred tax assets and liabilities and the deferred tax charge/(credit) in the consolidated statement of income are attributable to the following items:19. PROVISIONS MOVEMENTSProvision forimpairment ofinvestmentsavailable forsale (Note 5)Provision forloanimpairment(Notes 8, 9)Provision forimpairment oftrade andother accountsreceivable(Note 10)Provision forimpairment ofinventory(Note 11)Provision forimpairment ofproperty, plantand equipmentProvision forindexforwardsProvision forlosses oncredit relatedcommitmentsand otherprovisionsTotalprovisionsBalance at 1 January 2001 . . . . . . . . . . . . . . . . 65,980} 85,546} 41,373} 1,278} -} 40,134} 33,632} 267,943}Net effect on financial result . . . . . . . . . . . . . . . . 2,009} 32,582} 5,948} 394} 1,284} (34,162) (4,827) 3,228}Effect of inflation and translation . . . . . . . . . . . . . (296) (12,100) (6,492) 139} -} (5,972) (2,893) (27,614)Use of provisions in the year . . . . . . . . . . . . . . . . (67,618) (620) (23,261) (227) -} -} -} (91,726)Balance at 31 December 2001 . . . . . . . . . . . . . . 75} 105,408} 17,568} 1,584} 1,284} -} 25,912} 151,831}Net effect on financial result . . . . . . . . . . . . . . . . 6,349} 40,114} 4,775 1,709} -} -} (4,072) 48,875}Effect of inflation and translation . . . . . . . . . . . . . -} (13,389) (762) 185} -} -} (2,377) (16,343)Movements due to disposal of subsidiaries . . . . . -} -} (6,509) (1,987) -} -} (10,000) (18,496)Use of provisions in the year . . . . . . . . . . . . . . . . (1,334) -} (1,768) -} (1,284) -} -} (4,386)Effect}31 December} Acquisition/} of changes} 31 December} Acquisition/} 31 December}2000} Disposal} Movement} in tax rate} 2001} Disposal} Movement} <strong>2002</strong>}Tax effect of deductible temporary differences:Property, plant and equipment . . . . . . . . . . . . . . . 7,954} -} 4,078} (5,299) 6,733} -} 1,132} 7,865}Taxable losses carried forward . . . . . . . . . . . . . . 13,840} -} (3,630) (3,959) 6,251} -} (1,403) 4,848}Trade and other accounts payable . . . . . . . . . . . . 233} -} 1,816} (644) 1,405} -} (1,074) 331}Inventory . . . . . . . . . . . . . . . . . . . . . . . . . . . . . . . 104} -} 1,573} (527) 1,150} -} (1,047) 103}Trade and other accounts receivable . . . . . . . . . . 7,850} -} (4,570) (1,032) 2,248} -} (2,167) 81}Other . . . . . . . . . . . . . . . . . . . . . . . . . . . . . . . . . . 10,451} -} 3,164} (5,892) 7,723} -} (6,859) 864}Gross deferred tax asset . . . . . . . . . . . . . . . . . . . 40,432} -} 2,431} (17,353) 25,510} -} (11,418) 14,092}Less: Non-recorded deferred tax asset . . . . . . . . . (5,302) -} 5,161} 45} (96) -} 96} -}Balance at 31 December <strong>2002</strong> . . . . . . . . . . . . . . 5,090} 132,133} 13,304} 1,491} -} -} 9,463} 161,481}20. GOODWILL, NET<strong>2002</strong>} 2001}Negative goodwillAt 1 January . . . . . . . . . . . . . . . . . . . . . . . . . . . . . . . . . . . . . . . . . . . . . . . . . . . . . . . . . . . . . . . . . . . . . . . . . . . . . . . . . . . . . . . . . . . . . . . . . . . . . . . . 6,261} 987}Acquisition/disposal of subsidiaries . . . . . . . . . . . . . . . . . . . . . . . . . . . . . . . . . . . . . . . . . . . . . . . . . . . . . . . . . . . . . . . . . . . . . . . . . . . . . . . . . . . . . . (5,297) 596}Change in percentage of ownership . . . . . . . . . . . . . . . . . . . . . . . . . . . . . . . . . . . . . . . . . . . . . . . . . . . . . . . . . . . . . . . . . . . . . . . . . . . . . . . . . . . . . . . -} 6,389}Amortisation . . . . . . . . . . . . . . . . . . . . . . . . . . . . . . . . . . . . . . . . . . . . . . . . . . . . . . . . . . . . . . . . . . . . . . . . . . . . . . . . . . . . . . . . . . . . . . . . . . . . . . . . (964) (1,711)Net deferred tax asset . . . . . . . . . . . . . . . . . . . . 35,130} -} 7,592} (17,308) 25,414} -} (11,322) 14,092}At 31 December . . . . . . . . . . . . . . . . . . . . . . . . . . . . . . . . . . . . . . . . . . . . . . . . . . . . . . . . . . . . . . . . . . . . . . . . . . . . . . . . . . . . . . . . . . . . . . . . . . . . . -} 6,261}Tax effect of taxable temporary differences:Property, plant and equipment . . . . . . . . . . . . . . . (37,107) -} (11,916) 18,607} (30,416) -} 5,523} (24,893)Trade and other accounts receivable . . . . . . . . . . (26,037) -} 4,825} 9,026} (12,186) -} 6,706} (5,480)Trade and other accounts payable . . . . . . . . . . . . (564) -} (2,155) 855} (1,864) -} 932} (932)Inventories . . . . . . . . . . . . . . . . . . . . . . . . . . . . . (689) -} (348) 326} (711) -} 711} -}Investments available for sale . . . . . . . . . . . . . . . (1,753) -} 1,546} 65} (142) -} 142} -}Investment in joint ventures . . . . . . . . . . . . . . . . . (48,761) -} - 48,761} - -} -} -}Other . . . . . . . . . . . . . . . . . . . . . . . . . . . . . . . . . . (8,689) -} (2,528) 4,411} (6,806) -} 3,471} (3,335)Gross deferred tax liability . . . . . . . . . . . . . . . . . . (123,600) -} (10,576) 82,051} (52,125) -} 17,485} (34,640)Acquisition/disposal of subsidiaries . . . . . . . . . . . -} (15,808) 15,808} -} -} 9,448} (9,448) -}Positive goodwillAt 1 January . . . . . . . . . . . . . . . . . . . . . . . . . . . . . . . . . . . . . . . . . . . . . . . . . . . . . . . . . . . . . . . . . . . . . . . . . . . . . . . . . . . . . . . . . . . . . . . . . . . . . . . . 5,592} 422}Acquisition/disposal of subsidiaries . . . . . . . . . . . . . . . . . . . . . . . . . . . . . . . . . . . . . . . . . . . . . . . . . . . . . . . . . . . . . . . . . . . . . . . . . . . . . . . . . . . . . . 1,820} 6,580}Change in percentage of ownership . . . . . . . . . . . . . . . . . . . . . . . . . . . . . . . . . . . . . . . . . . . . . . . . . . . . . . . . . . . . . . . . . . . . . . . . . . . . . . . . . . . . . . . -} (396)Amortisation . . . . . . . . . . . . . . . . . . . . . . . . . . . . . . . . . . . . . . . . . . . . . . . . . . . . . . . . . . . . . . . . . . . . . . . . . . . . . . . . . . . . . . . . . . . . . . . . . . . . . . . . (1,586) (1,014)At 31 December . . . . . . . . . . . . . . . . . . . . . . . . . . . . . . . . . . . . . . . . . . . . . . . . . . . . . . . . . . . . . . . . . . . . . . . . . . . . . . . . . . . . . . . . . . . . . . . . . . . . . 5,826} 5,592}Net deferred tax liability . . . . . . . . . . . . . . . . . . (88,470) (15,808) 12,824} 64,743} (26,711) 9,448} (3,285) (20,548)78 79
Alfa GroupNotes to the Consolidated Financial Statements for the Year Ended 31 December <strong>2002</strong>(Expressed in thousands of US dollars for presentational purposes only – see Note 3)Alfa GroupNotes to the Consolidated Financial Statements for the Year Ended 31 December <strong>2002</strong>(Expressed in thousands of US dollars for presentational purposes only – see Note 3)26. MOVEMENTS IN WORKING CAPITAL BALANCESMovements in working capital balances comprise:27. ACQUISITION/FORMATION AND DISPOSALOF SUBSIDIARIESEco Holdings LimitedIn January <strong>2002</strong>, the Group sold shares representing a 30% equity interest in Eco Holdings Limited to a related party of the Group forUSD 7,460 thousand. A charge of USD 30,416 thousand representing the difference between the sales proceeds and the carrying value ofthe interest disposed has been recorded within staff costs in the consolidated statement of income in respect of this transaction.Management has not presented the fair value of the equity interest disposed since external independent market quotations were not availablefor this investment and other methods of reasonably estimating the fair value of this type of investment are clearly inappropriate orunworkable and available data with respect to the fair value calculations may not be supportable. However, Management believes that thefair value of the equity interest disposed was greater than the respective carrying value.Discontinuing OperationsUnited Food CompanyWith effect from 1 January 2001 the Group acquired the sugar and grain business of Intec Holdings Limited (“Intec”) and combinedit with the Group’s existing sugar business under a new holding company “AC United Food Company” (“UFC”). Through a sharereorganization, 32% of the share capital of UFC was given as consideration for the assets and business of Intec. Under a separate sharepurchase agreement CTF Holdings purchased 7% of Intec Holdings Ltd. shares in UFC leaving Intec Holdings with 25% + 1 share.In September <strong>2002</strong>, in line with a Group’s shareholders’ decision made in August <strong>2002</strong>, the Group sold its entire interest in UFC, which,together with other non-material businesses, formed the Group’s Food Processing segment (Note 28), to a private strategic investor forUSD 56,300 thousand. In the 31 December <strong>2002</strong> consolidated financial statements a gain in the amount of USD 39,533 thousand wasrecorded in respect of this transaction, the difference between the Group’s carrying value of UFC and the sale proceeds of USD 56,300thousand. This gain is included into gains less losses arising from disposal of subsidiaries in the consolidated statement of income.Crown Resources AG<strong>2002</strong>} 2001}Movements in loans and advances to customers and banks . . . . . . . . . . . . . . . . . . . . . . . . . . . . . . . . . . . . . . . . . . . . . . . . . . . . . . . . . . . . . . . . . . . . (931,727) (418,535)Movements in trade and other accounts receivable . . . . . . . . . . . . . . . . . . . . . . . . . . . . . . . . . . . . . . . . . . . . . . . . . . . . . . . . . . . . . . . . . . . . . . . . . . . (10,231) 125,099}Movements in inventories . . . . . . . . . . . . . . . . . . . . . . . . . . . . . . . . . . . . . . . . . . . . . . . . . . . . . . . . . . . . . . . . . . . . . . . . . . . . . . . . . . . . . . . . . . . . . . 8,975} 11,885}Movements in trading securities . . . . . . . . . . . . . . . . . . . . . . . . . . . . . . . . . . . . . . . . . . . . . . . . . . . . . . . . . . . . . . . . . . . . . . . . . . . . . . . . . . . . . . . . . (261,123) (24,651)Movements in amounts owed to depositors and due to banks . . . . . . . . . . . . . . . . . . . . . . . . . . . . . . . . . . . . . . . . . . . . . . . . . . . . . . . . . . . . . . . . . . . 774,941} 609,087}Movements in trade and other accounts payable . . . . . . . . . . . . . . . . . . . . . . . . . . . . . . . . . . . . . . . . . . . . . . . . . . . . . . . . . . . . . . . . . . . . . . . . . . . . . (62,093) (273,975)(481,258) 28,910In December <strong>2002</strong>, in accordance with a Group’s shareholders’ decision, the Group sold its entire interest in Crown Resources, its internationalcommodities trading business (refer to International Commodities segment in Note 28), in a management-led buyout. In the 31December <strong>2002</strong> consolidated financial statements, a loss in the amount of USD 5,983 thousand was recorded in respect of this transaction,the difference between the Group’s carrying value of Crown Resources and the purchase consideration. This loss is included in gainsless losses arising from disposal of subsidiaries in the consolidated statement of income.The carrying amounts of total assets and liabilities of segments discontinuing and continuing operations are included in the table below:Continuing operations Discontinuing operations Eliminations} Group as a whole<strong>2002</strong> 2001 <strong>2002</strong> 2001 <strong>2002</strong>} 2001} <strong>2002</strong> 2001Assets . . . . . . . . . . . . . . . . . . . . . . . . . . . . . . . . . 7,345,904 5,446,455 - 538,536 (166,744) (429,557) 7,179,160 5,555,434Liabilities . . . . . . . . . . . . . . . . . . . . . . . . . . . . . . . 4,084,813 2,961,431 - 409,429 (166,744) (138,746) 3,918,069 3,232,114Financial results of segments discontinuing and continuing operations:Continuing operations} Discontinuing operations} Eliminations} Group as a whole}<strong>2002</strong>} 2001 <strong>2002</strong>} 2001} <strong>2002</strong>} 2001} <strong>2002</strong>} 2001}Sales . . . . . . . . . . . . . . . . . . . . . . . . . . . . . . . . . . 380,540} 433,236} 2,540,336} 3,285,319} (20,315) (33,669) 2,900,561} 3,684,886}Cost of goods sold . . . . . . . . . . . . . . . . . . . . . . . . (275,172) (323,818) (2,533,245) (3,255,951) 21,446} 33,467} (2,786,971) (3,546,302)Gross profit . . . . . . . . . . . . . . . . . . . . . . . . . . . . . 105,368} 109,418} 7,091} 29,368} 1,131} (202) 113,590} 138,584}Commission income on trading operations. . . . . . 12,440} 17,045} 1,766} -} (2,595) (5,597) 11,611} 11,448}Net interest, fees and other incomeon banking activities . . . . . . . . . . . . . . . . . . . . . . 325,006} 345,875} -} -} (14,718) (21,784) 310,288} 324,091}Gains less losses arising from trading securities . 20,008} 33,262} -} -} -} -} 20,008} 33,262}Gains less losses arisingfrom investments available for sale . . . . . . . . . . . 75,231} 37,674} 7} 1} -} 23,978} 75,238} 61,653}Provisions on operating items . . . . . . . . . . . . . . . (46,423) (2,409) (2,452) (819) -} -} (48,875) (3,228)Operating expenses, net . . . . . . . . . . . . . . . . . . . . (531,585) (439,447) (54,098) (64,616) 1,298} (13,926) (584,385) (517,989)Operating income/(loss). . . . . . . . . . . . . . . . . . . . (39,955) 101,418} (47,686) (36,066) (14,884) (17,531) (102,525) 47,821}Share of results of joint ventures, net. . . . . . . . . . 861,021} 877,637} -} -} -} -} 861,021} 877,637}Share of results of associated companies, net . . . 30,376} 6,829} -} -} -} -} 30,376} 6,829}Gains less losses arising from disposalof subsidiaries . . . . . . . . . . . . . . . . . . . . . . . . . . . (783) -} 33,550} -} -} -} 32,767} -}Interest expense, net . . . . . . . . . . . . . . . . . . . . . . (11,804) (13,279) (10,198) (5,660) (175) 8,210} (22,177) (10,729)Foreign exchange translationand monetary gains less losses . . . . . . . . . . . . . . 41,041} 59,448} 2,613} 1,892} 1} 138} 43,655} 61,478}Profit/(loss) before income taxand minority interest . . . . . . . . . . . . . . . . . . . . . . 879,896} 1,032,053} (21,721) (39,834) (15,058) (9,183) 843,117} 983,036}Income tax (charge)/credit . . . . . . . . . . . . . . . . . . (10,854) 60,516} 82} 6,229} -} -} (10,772) 66,745}Profit/(loss) after income tax and beforeminority interest . . . . . . . . . . . . . . . . . . . . . . . . . 869,042} 1,092,569} (21,639) (33,605) (15,058) (9,183) 832,345} 1,049,781}Minority interest . . . . . . . . . . . . . . . . . . . . . . . . . (207,417) (181,159) 837} 1,473} -} -} (206,580) (179,686)Net profit/(loss) . . . . . . . . . . . . . . . . . . . . . . . . . 661,625} 911,410} (20,802) (32,132) (15,058) (9,183) 625,765} 870,095}Cash flows of segments discontinuing and continuing operations:Continuing operations} Discontinuing operations} Eliminations} Group as a whole}<strong>2002</strong> 2001} <strong>2002</strong>} 2001} <strong>2002</strong>} 2001} <strong>2002</strong>} 2001}Net cash (used in)/from operating activities . . . . . (503,907) (15,901) (31,085) (85,925) 15,535} 19,166} (519,457) (82,660)Net cash (used in)/from investing activities . . . . . (90,779) (59,435) 98,286} 14,955} -} -} 7,507} (44,480)Net cash (used in)/from financing activities . . . . . 424,022} 291,861} (39,733) (115,417) (15,535) (19,166) 368,754} 157,278}Food Processing and International Commodities segments are considered to be discontinuing operations and are presented as such inNote 28. Other segments disclosed in the Note 28 are presented as continuing operations.82 83
Alfa GroupNotes to the Consolidated Financial Statements for the Year Ended 31 December <strong>2002</strong>(Expressed in thousands of US dollars for presentational purposes only – see Note 3)Alfa GroupNotes to the Consolidated Financial Statements for the Year Ended 31 December <strong>2002</strong>(Expressed in thousands of US dollars for presentational purposes only – see Note 3)28. ANALYSIS BY SEGMENT28. ANALYSIS BY SEGMENT (CONTINUED)Analysis by business segment (primary)Year ended 31 December 2001Year ended 31 December <strong>2002</strong>FinancialServicesInternationalCommodities(Discontinuingoperation -Referto Note 27)Russia,CIS andSoutheastAsiaCommoditiesFoodProcessing(Discontinuingoperation –ReferRetail Trade to Note 27)Oil & GasOtherEliminationsConsolidatedFinancialServicesInternationalCommodities(Discontinuingoperation -Referto Note 27)Russia,CIS andSoutheastAsiaCommoditiesFoodProcessing(Discontinuingoperation –ReferRetail Trade to Note 27)Oil & GasTelecommunicationsTelecommunicationsOtherEliminationsConsolidatedSEGMENT SALES- external sales . . . . . . . . . . . . . . . . . . . . . . -} 2,455,703} 77,770} 282,455} 84,633} -} -} -} -} 2,900,561}- inter-segment sales . . . . . . . . . . . . . . . . . -} -} 19,075} -}} -} -} -} 1,240} (20,315) -}Total sales . . . . . . . . . . . . . . . . . . . . . . . . . . . -} 2,455,703} 96,845} 282,455} 84,633} -} -} 1,240} (20,315) 2,900,561}SEGMENT COSTSCost of goods sold . . . . . . . . . . . . . . . . . . . . -} (2,453,652) (70,935) (204,237) (79,593) -} -} -} 21,446} (2,786,971)SEGMENT SALES- external sales . . . . . . . . . . . . . . . . . . . . . . -} 3,227,066} 162,706} 237,093} 58,021} -} -} -} -} 3,684,886}- inter-segment sales . . . . . . . . . . . . . . . . . -} 232} 32,749} -} -} -} -} 688} (33,669) -}Total sales . . . . . . . . . . . . . . . . . . . . . . . . . . . -} 3,227,298} 195,455} 237,093} 58,021} -} -} 688} (33,669) 3,684,886}SEGMENT COSTSCost of goods sold . . . . . . . . . . . . . . . . . . . . -} (3,201,206) (150,216) (173,602) (54,745) -} -} -} 33,467} (3,546,302)SEGMENT GROSS PROFIT . . . . . . . . . . . . . . . -} 2,051} 25,910} 78,218} 5,040} -} -} 1,240} 1,131} 113,590}Commission income on trading operations- external . . . . . . . . . . . . . . . . . . . . . . . . . . -} 1,736} 9,845} -} 30} -} -} -} -} 11,611}- inter-segment . . . . . . . . . . . . . . . . . . . . . -} -} 2,595} -} -} -} -} -} (2,595) -}Net interest, fees and other incomeon banking activities- external . . . . . . . . . . . . . . . . . . . . . . . . . . 310,288} -} -} -} -} -} -} -} -} 310,288}- inter-segment . . . . . . . . . . . . . . . . . . . . . 14,718} -} -} -} -} -} -} -} (14,718) -}Gain less losses arising fromtrading securities . . . . . . . . . . . . . . . . . . . . . . 20,008} -} -} -} -} -} -} -} -} 20,008}Gain less losses arisingfrom investments available for sale . . . . . . . . 43,684} -} 30,327} -} 7} -} -} 1,220} -} 75,238}Provisions on operating items . . . . . . . . . . . . (34,564) (1,535) (6,138) -} (917) -} -} (5,721) -} (48,875)Operating expenses . . . . . . . . . . . . . . . . . . . . (271,591) (43,235) (89,736) (64,943) (10,863) (103,193) -} (2,122) 1,298} (584,385)OPERATING INCOME/(LOSS) . . . . . . . . . . . . . 82,543} (40,983) (27,197) 13,275} (6,703) (103,193) -} (5,383) (14,884) (102,525)Share of result of joint ventures, net . . . . . . . -} -} 10,467} -} -} 850,554} -} -} -} 861,021}Share of result of associated companies, net . -} -} -} -} -} -} 30,376} -} -} 30,376}Gain less losses arising from disposalof subsidiaries . . . . . . . . . . . . . . . . . . . . . . . . -} (5,983) -} -} 39,533} -} -} (783) -} 32,767}Interest expense, net . . . . . . . . . . . . . . . . . . . -} (7,181) (30,213) (3,189) (3,017) -} -} 21,598} (175) (22,177)Foreign exchange translationand monetary gains less losses . . . . . . . . . . . 23,073} 107} 16,089} 3,234} 2,506} -} -} (1,355) 1} 43,655}Profit/(loss) before income taxand minority interest . . . . . . . . . . . . . . . . . . . 105,616} (54,040) (30,854) 13,320} 32,319} 747,361} 30,376} 14,077} (15,058) 843,117}Income tax (charge)/credit . . . . . . . . . . . . . . . (5,221) (1,564) 45} (5,675) 1,646 -} -} (3) -} (10,772)Profit/(loss) after income taxand before minority interest . . . . . . . . . . . . . . 100,395} (55,604) (30,809) 7,645} 33,965} 747,361} 30,376} 14,074} (15,058) 832,345Minority interest . . . . . . . . . . . . . . . . . . . . . . (23,726) -} 1,458} (1,323) 837} (176,646) (7,180) -} -} (206,580)Net profit/(loss) . . . . . . . . . . . . . . . . . . . . . . 76,669} (55,604) (29,351) 6,322} 34,802} 570,715} 23,196} 14,074} (15,058) 625,765}OTHER INFORMATIONSegment assets . . . . . . . . . . . . . . . . . . . . . . . 3,962,335} -} 143,406} 129,587} -} -} -} 81,950} (166,744) 4,150,534}Investment in joint venturesand associated companies . . . . . . . . . . . . . . . -} -} 48,421} -} -} 2,522,847} 457,358} -} -} 3,028,626}Consolidated total assets . . . . . . . . . . . . . . . . 3,962,335} -} 191,827} 129,587} -} 2,522,847} 457,358} 81,950} (166,744) 7,179,160}Consolidated total liabilities . . . . . . . . . . . . . . 3,736,996} -} 255,761} 78,814} -} -} -} 13,242} (166,744) 3,918,069}Capital expenditure . . . . . . . . . . . . . . . . . . . . 32,642} 2,221} 4,247} 31,424} 1,865} -} -} 40} -} 72,439}Depreciation . . . . . . . . . . . . . . . . . . . . . . . . . (14,407) (2,252) (3,528) (6,384) (9,470) -} -} (80) -} (36,121)Non-}cash expenses other thandepreciation (Provisions – net effect) . . . . . . . (34,564) (1,535) (6,138) -} (917) -} -} (5,721) -} (48,875)SEGMENT GROSS PROFIT . . . . . . . . . . . . . . . -} 26,092} 45,239} 63,491} 3,276} -} -} 688} (202) 138,584}Commission income on trading operations- external . . . . . . . . . . . . . . . . . . . . . . . . . . -} -} 11,448} -} -} -} -} -} -} 11,448}- inter-segment . . . . . . . . . . . . . . . . . . . . . -} -} 5,597} -} -} -} -} -} (5,597) -}Net interest, fees and other incomeon banking activities- external . . . . . . . . . . . . . . . . . . . . . . . . . . 324,091} -} -} -} -} -} -} -} -} 324,091}- inter-}segment . . . . . . . . . . . . . . . . . . . . . 21,784} -} -} -} -} -} -} -} (21,784) -}Gain less losses arisingfrom trading securities . . . . . . . . . . . . . . . . . 33,262} -} -} -} -} -} -} -} -} 33,262}Gain less losses arisingfrom investments available for sale . . . . . . . . (5,722) -} 42,932} -} 1 -} -} 464} 23,978} 61,653}Provisions on operating items . . . . . . . . . . . . 1,470} (172) (3,900) 21} (647) -} -} -} -} (3,228)Operating expenses, net . . . . . . . . . . . . . . . . (273,072) (50,707) (68,926) (39,886) (13,909) (73,405) -} 15,842} (13,926) (517,989)OPERATING INCOME/(LOSS) . . . . . . . . . . . . . 101,813} (24,787) 32,390} 23,626} (11,279) (73,405) -} 16,994} (17,531) 47,821}Share of result of joint ventures, net . . . . . . . -} -} 22,662} -} -} 854,975} -} -} -} 877,637}Share of result of associated companies, net . . -} -} -} -} -} -} 6,829} -} -} 6,829}Interest expense, net . . . . . . . . . . . . . . . . . . . (8,325) (4,418) (8,645) (3,857) (1,242) -} -} 7,548} 8,210} (10,729)Foreign exchange translationand monetary gains less losses . . . . . . . . . . . 58,228} (464) (2,807) 4,924} 2,356} -} -} (897) 138} 61,478}Profit/(loss) before income taxand minority interest . . . . . . . . . . . . . . . . . . . 151,716} (29,669) 43,600} 24,693} (10,165) 781,570} 6,829} 23,645} (9,183) 983,036}Income tax (charge)/credit . . . . . . . . . . . . . . . 5,470} (1,269) 3,924} 2,361} 7,498} 48,761} -} -} -} 66,745}Profit/(loss) after income taxand minority interest . . . . . . . . . . . . . . . . . . . 157,186} (30,938) 47,524} 27,054} (2,667) 830,331} 6,829} 23,645} (9,183) 1,049,781}Minority interest . . . . . . . . . . . . . . . . . . . . . . (27,475) -} -} (3,841) 1,473} (149,169) (674) -} -} (179,686)Net profit/(loss) . . . . . . . . . . . . . . . . . . . . . . . 129,711} (30,938) 47,524} 23,213} (1,194) 681,162} 6,155} 23,645} (9,183) 870,095}OTHER INFORMATIONSegment assets . . . . . . . . . . . . . . . . . . . . . . . 2,830,502} 402,737} 150,524} 127,503} 135,799} -} -} 258,543} (421,730) 3,483,878}Investment in joint venturesand associated companies . . . . . . . . . . . . . . . -} -} 53,196 -} -} 1,759,324} 266,863} -} (7,827) 2,071,556}Consolidated total assets . . . . . . . . . . . . . . . . 2,830,502} 402,737} 203,720} 127,503} 135,799} 1,759,324} 266,863} 258,543} (429,557) 5,555,434}Consolidated total liabilities . . . . . . . . . . . . . . 2,676,917} 350,013} 217,023} 63,139} 59,416} -} -} 4,352} (138,746) 3,232,114}Capital expenditure . . . . . . . . . . . . . . . . . . . . 37,737} 3,706} 2,751} 10,569} 1,889} -} -} 69} -} 56,721}Depreciation . . . . . . . . . . . . . . . . . . . . . . . . . (10,980) (1,378) (11,416) (4,741) (11,177) -} -} (71) -} (39,763)Non-cash expenses other thandepreciation (Provisions – net effect) . . . . . . . 1,470} (172) (3,900) 21} (647) -} -} -} -} (3,228)84 85
Alfa GroupNotes to the Consolidated Financial Statements for the Year Ended 31 December <strong>2002</strong>(Expressed in thousands of US dollars for presentational purposes only – see Note 3)Alfa GroupNotes to the Consolidated Financial Statements for the Year Ended 31 December <strong>2002</strong>(Expressed in thousands of US dollars for presentational purposes only – see Note 3)30. RISK MANAGEMENT (CONTINUED)The Group’s maximum exposure to credit risk is primarily reflected in the carrying amounts of financial assets on the consolidated balance sheet. Theimpact of possible netting of assets and liabilities to reduce potential credit exposure is not significant.The liquidity position of the Group at 31 December <strong>2002</strong> is set out below:Demand and}No statedless than} From 1} From 6 to More than maturity/one month} to 6 months} 12 months 1 year overdue TotalProperty, plant and equipment . . . . . . . . . . . . . . . . . . . . . . . . . . . . -} -} - - 264,200 264,200Goodwill, net . . . . . . . . . . . . . . . . . . . . . . . . . . . . . . . . . . . . . . . . . . -} -} - - 5,826 5,826Investments available for sale . . . . . . . . . . . . . . . . . . . . . . . . . . . . . -} -} - - 145,616 145,616Investment in joint ventures . . . . . . . . . . . . . . . . . . . . . . . . . . . . . . -} -} - - 2,571,268 2,571,268Investment in associated companies . . . . . . . . . . . . . . . . . . . . . . . . -} -} - - 457,358 457,358Inventories . . . . . . . . . . . . . . . . . . . . . . . . . . . . . . . . . . . . . . . . . . . 15,422} 8,443} 12 - - 23,877Trade and other accounts receivable . . . . . . . . . . . . . . . . . . . . . . . . 128,991} 115,472} 50,779 28,865 - 324,107Loans and advances to customers . . . . . . . . . . . . . . . . . . . . . . . . . . 206,913} 605,663} 738,892 577,520 27,029 2,156,017Due from banks . . . . . . . . . . . . . . . . . . . . . . . . . . . . . . . . . . . . . . . 198,132} 11,120} - 70 1,826 211,148Trading securities . . . . . . . . . . . . . . . . . . . . . . . . . . . . . . . . . . . . . . 399,797} -} - - - 399,797Mandatory cash balances with the CBRF . . . . . . . . . . . . . . . . . . . . . 214,252} -} - - - 214,252Cash and cash equivalents . . . . . . . . . . . . . . . . . . . . . . . . . . . . . . . 405,694} -} - - - 405,694Total assets . . . . . . . . . . . . . . . . . . . . . . . . . . . . . . . . . . . . . . . . . . 1,569,201} 740,698} 789,683 606,455 3,473,123 7,179,160Borrowings . . . . . . . . . . . . . . . . . . . . . . . . . . . . . . . . . . . . . . . . . . . 219,823} 300,391} 83,626 314,170 - 918,010Amount owed to depositors . . . . . . . . . . . . . . . . . . . . . . . . . . . . . . . 1,328,082} 383,296} 197,772 9,592 - 1,918,742Due to banks . . . . . . . . . . . . . . . . . . . . . . . . . . . . . . . . . . . . . . . . . . 550,298} 97,342} 4,410 17,642 - 669,692Trade and other accounts payable, provision for losseson credit related commitments and other provisions . . . . . . . . . . . . 108,010} 210,755} 64,926 7,386 - 391,077Deferred income tax liability . . . . . . . . . . . . . . . . . . . . . . . . . . . . . . -} -} - - 20,548 20,548Total liabilities . . . . . . . . . . . . . . . . . . . . . . . . . . . . . . . . . . . . . . . . 2,206,213} 991,784} 350,734 348,790 20,548 3,918,069Net liquidity gap . . . . . . . . . . . . . . . . . . . . . . . . . . . . . . . . . . . . . . (637,012) (251,086) 438,949 257,665 3,452,575 3,261,091Credit risk for off-balance sheet financial instruments is defined as the possibility of sustaining a loss because any other party to a financial instrumentfails to perform in accordance with the term of the contract. The Group uses the same credit policies in making conditional obligations as it does foron-balance sheet financial instruments through established credit approvals, risk control limits and monitoring procedures.Currency risk. The Group operates internationally, and is exposed to currency risk, the risk that the value of financial and other assets and income andexpense items will fluctuate due to changes in foreign exchange rates. Whenever possible, the Group, through its companies, tries to limit its currencyexposure by matching balance sheet, and revenue and expense items in the relevant currency. At period end, the Group had balances in US dollars,Russian Roubles, EURO and other currencies as follows:OtherRUR USD EURO} currencies TotalProperty, plant and equipment . . . . . . . . . . . . . . . . . . . . . . . . . . . . . . . . . . . . . . . . . . . . . 254,469 9 670} 9,052 264,200Goodwill, net . . . . . . . . . . . . . . . . . . . . . . . . . . . . . . . . . . . . . . . . . . . . . . . . . . . . . . . . . . 5,826 - -} - 5,826Investments available for sale . . . . . . . . . . . . . . . . . . . . . . . . . . . . . . . . . . . . . . . . . . . . . - 145,616 -} - 145,616Investment in joint ventures . . . . . . . . . . . . . . . . . . . . . . . . . . . . . . . . . . . . . . . . . . . . . . 2,571,268 - -} - 2,571,268Investment in associated companies . . . . . . . . . . . . . . . . . . . . . . . . . . . . . . . . . . . . . . . . 362,992 - -} 94,366 457,358Inventories . . . . . . . . . . . . . . . . . . . . . . . . . . . . . . . . . . . . . . . . . . . . . . . . . . . . . . . . . . . 23,877 - -} - 23,877Trade and other accounts receivable . . . . . . . . . . . . . . . . . . . . . . . . . . . . . . . . . . . . . . . . 100,852 202,034 10,384} 10,837 324,107Loans and advances to customers . . . . . . . . . . . . . . . . . . . . . . . . . . . . . . . . . . . . . . . . . . 744,080 1,386,257 4,630} 21,050 2,156,017Due from banks . . . . . . . . . . . . . . . . . . . . . . . . . . . . . . . . . . . . . . . . . . . . . . . . . . . . . . . . 60,840 116,330 30,502} 3,476 211,148Trading securities . . . . . . . . . . . . . . . . . . . . . . . . . . . . . . . . . . . . . . . . . . . . . . . . . . . . . . 78,980 314,069 2,798} 3,950 399,797Mandatory cash balances with the CBRF . . . . . . . . . . . . . . . . . . . . . . . . . . . . . . . . . . . . . 213,524 - 226} 502 214,252Cash and cash equivalents . . . . . . . . . . . . . . . . . . . . . . . . . . . . . . . . . . . . . . . . . . . . . . . . 179,570 179,589 19,370} 27,165 405,694Total assets . . . . . . . . . . . . . . . . . . . . . . . . . . . . . . . . . . . . . . . . . . . . . . . . . . . . . . . . . . 4,596,278 2,343,904 68,580} 170,398 7,179,160Borrowings . . . . . . . . . . . . . . . . . . . . . . . . . . . . . . . . . . . . . . . . . . . . . . . . . . . . . . . . . . . 403,074 498,472 9,533} 6,931 918,010Amount owed to depositors . . . . . . . . . . . . . . . . . . . . . . . . . . . . . . . . . . . . . . . . . . . . . . . 805,286 1,034,420 52,764} 26,272 1,918,742Due to banks . . . . . . . . . . . . . . . . . . . . . . . . . . . . . . . . . . . . . . . . . . . . . . . . . . . . . . . . . . 203,526 389,282 19,548} 57,336 669,692Trade and other accounts payable, provision forcredit related commitments and other provisions . . . . . . . . . . . . . . . . . . . . . . . . . . . . . . 130,945 243,484 8,756} 7,892 391,077Deferred income tax liability . . . . . . . . . . . . . . . . . . . . . . . . . . . . . . . . . . . . . . . . . . . . . . . 20,548 - -} - 20,548At 31 December <strong>2002</strong>, the Group has negative working capital in the amount of USD 449,149 thousand (2001: USD 181,319 thousand). This is mainlydue to borrowings and amounts owed to depositors. Management believes that in spite of a substantial portion of liabilities being of short term nature,diversification of these liabilities by number and type of depositors, and the past experience of the Group would indicate that these liabilities provide along-term and stable source of funding for the Group.The Group is exposed to the effects of fluctuations in the prevailing levels of market interest rates on its financial position and cash flows. Interest marginsmay increase as a result of such changes, but also may reduce or create losses in the event that unexpected movements arise. The Group’s interest rate sensitivityanalysis based on the re-pricing of the Group’s assets and liabilities does not differ significantly from the maturity analysis disclosed in the table above.Total liabilities . . . . . . . . . . . . . . . . . . . . . . . . . . . . . . . . . . . . . . . . . . . . . . . . . . . . . . . . 1,563,379 2,165,658 90,601} 98,431 3,918,069Net currency position at 31 December <strong>2002</strong> . . . . . . . . . . . . . . . . . . . . . . . . . . . . . . . . . 3,032,899 178,246 (22,021) 71,967 3,261,091Market risk. The Group takes on exposure to market risks. Market risks arise from open positions in interest rate, currency and equity products, all ofwhich are exposed to general and specific market movements. The Board of Directors of each company in the Group sets limits on the value of risk thatmay be accepted, which is monitored on a daily basis. However, the use of this approach does not prevent losses outside of these limits in the event ofmore significant market movements.Credit risk. The Group is exposed to credit risk, which is the risk that a counterparty will be unable to pay amounts in full when due. The two principal typesof credit risk result from lending to banks and other customers and from sale of products and services on credit.Alfa Bank Group is the principal company in the Group, which is engaged in lending. In order to manage credit risk, Alfa Bank Group structures thelevels of credit risk it undertakes by placing limits on the amount of risk accepted in relation to one borrower, or groups of borrowers, and to geographicaland industry segments. Such risks are monitored on a continual basis and subject to an annual or more frequent review. Limits on the level ofcredit risk by product, borrower and industry sector are approved regularly by the Executive Board. Exposure to credit risk is managed through regularanalysis of the ability of borrowers and potential borrowers to meet interest and capital repayment obligations and by changing these lending limits whereappropriate. Exposure to credit risk is also managed, in part, by obtaining collateral and corporate and personal guarantees.Through credit sales, all of the Group’s companies are exposed to credit risk, which is managed accordingly. Each of the Group's companies has policiesin place to ensure that sales of products and services are made to customers with an appropriate credit history. Derivatives and cash transactions arelimited to high credit quality financial institutions and counterparties.88 89
Alfa GroupNotes to the Consolidated Financial Statements for the Year Ended 31 December <strong>2002</strong>(Expressed in thousands of US dollars for presentational purposes only – see Note 3)Alfa GroupNotes to the Consolidated Financial Statements for the Year Ended 31 December <strong>2002</strong>(Expressed in thousands of US dollars for presentational purposes only – see Note 3)31. COMMITMENTS AND DERIVATIVEFINANCIAL INSTRUMENTSCapital commitmentsAt 31 December <strong>2002</strong>, the Group had capital commitments, mainly in respect of new computer systems totalling USD 20,237 thousand (2001: USD9,766 thousand).Contractual commitmentsUnder the terms of the transaction with VimpelCom Group, the Group had a commitment to invest an amount of USD 58,500 thousand of equitydirectly into ZAO VimpelCom-Region which was to be paid in November 2003. These payments were completed in August 2003.At 31 December <strong>2002</strong>, the Group had contractual commitments to sell 137,500 metric tons (equivalent USD 22,436 thousand) of oil to Vitol S.A.Credit related commitments<strong>2002</strong>} 2001}Guarantees issued . . . . . . . . . . . . . . . . . . . . . . . . . . . . . . . . . . . . . . . . . . . . . . . . . . . . . . . . . . . . . . . . . . . . . . . . . . . . . . . . . . . . . . . . . . . . . . . . . . . . 538,946} 807,244}Letters of credit . . . . . . . . . . . . . . . . . . . . . . . . . . . . . . . . . . . . . . . . . . . . . . . . . . . . . . . . . . . . . . . . . . . . . . . . . . . . . . . . . . . . . . . . . . . . . . . . . . . . . 222,057} 287,731}Letters of indemnity . . . . . . . . . . . . . . . . . . . . . . . . . . . . . . . . . . . . . . . . . . . . . . . . . . . . . . . . . . . . . . . . . . . . . . . . . . . . . . . . . . . . . . . . . . . . . . . . . . -} 232,871}Less: Provision for losses on credit related commitments (Note 19) . . . . . . . . . . . . . . . . . . . . . . . . . . . . . . . . . . . . . . . . . . . . . . . . . . . . . . . . . . . . . . (9,463) (4,298)751,540} 1,323,548}The total outstanding contractual amount of guarantees, letters of credit, and letters of indemnity does not necessarily represent future cash requirements,as they may expire or terminate without being funded.Guarantees IssuedIn May 2001 Alfa Bank Group entered into a performance guarantee in which it partially guaranteed TNK Industrial’s payment of USD 510,000 thousandin respect of TNK Industrial’s acquisition of 40% of OAO SIDANCO. This performance guarantee is jointly and severally with other related parties and themaximum liability of the Group is limited to 25% of Alfa Bank’s statutory capital. At 31 December 2001, 25% of Alfa Bank’s statutory capital amounted toapproximately USD 184,780 thousand. This amount was included within total guarantees issued at 31 December 2001. Payments, that were guaranteed bythe Group, were completed by TNK Industrial by the end of February <strong>2002</strong>. No payments were made by the Group with respect to this guarantee.In August 2001, with respect to an additional acquisition of 44% of OAO SIDANCO by TNK Industrial, Alfa Bank Group partially guaranteed TNK Industrial’spayment of USD 726,000 thousand. This performance guarantee is jointly and severally with other related parties and the maximum liability of the Group is limitedto 25% of Alfa Bank’s statutory capital. At 31 December <strong>2002</strong>, 25% of Alfa Bank’s statutory capital was approximately USD 173,936 thousand (2001: USD184,780 thousand). Respective amounts were included within total guarantees issued at 31 December <strong>2002</strong> and 31 December 2001. Payments, that were guaranteedby the Group were completed by TNK Industrial by the end of April 2003. No payments were made by the Group with respect to this guarantee.Letters of CreditAt 31 December <strong>2002</strong>, included in letters of credit are export letters of credit in the amount of USD 191,712 thousand (2001: USD 162,964 thousand)in which the Group bears no risk. Import letters of credit in the amount of USD 30,345 thousand (2001: USD 23,287 thousand) are usually fully collateralisedand accordingly the Group assumes minimal risk.At 31 December 2001, commitments under letters of credit in the amount of USD 101,480 thousand mainly relate to the purchase of crude oil, oil productsand metals from major international commodity companies and additional standby letters of credit and letters of guarantee opened in favour ofcounterparties providing derivatives (refer to Note 15).Letters of IndemnityAt 31 December 2001, letters of indemnity in the amount of USD 232,871 thousand were issued with respect to sales of crude oil, oil products and metals,and also to the pre-financing of crude oil, oil products and metal purchases. No losses were incurred in respect of these indemnities and accordinglyno provision was established against these contingencies at 31 December 2001.Operating Lease CommitmentsAt 31 December <strong>2002</strong>, the Group had annual commitments under non-cancellable operating leases for land and buildings as set out below:<strong>2002</strong> 2001Amounts payable:Within 1 year . . . . . . . . . . . . . . . . . . . . . . . . . . . . . . . . . . . . . . . . . . . . . . . . . . . . . . . . . . . . . . . . . . . . . . . . . . . . . . . . . . . . . . . . . . . . . . . . . . . . . . . 19,631 15,559Within 1 to 2 years . . . . . . . . . . . . . . . . . . . . . . . . . . . . . . . . . . . . . . . . . . . . . . . . . . . . . . . . . . . . . . . . . . . . . . . . . . . . . . . . . . . . . . . . . . . . . . . . . . . 8,144 5,726Within 2 to 5 years . . . . . . . . . . . . . . . . . . . . . . . . . . . . . . . . . . . . . . . . . . . . . . . . . . . . . . . . . . . . . . . . . . . . . . . . . . . . . . . . . . . . . . . . . . . . . . . . . . . 23,901 16,456More than 5 years . . . . . . . . . . . . . . . . . . . . . . . . . . . . . . . . . . . . . . . . . . . . . . . . . . . . . . . . . . . . . . . . . . . . . . . . . . . . . . . . . . . . . . . . . . . . . . . . . . . . 57,878 10,537Derivative Financial Instruments109,554 48,278Foreign exchange and other off-balance sheet financial instruments are generally traded in an over-the-counter market with professional market counterpartieson standardised contractual terms and conditions.The principal amounts of certain types of financial instruments provide a basis for comparison with instruments recorded on the balance sheet but do not necessarilyindicate the amounts of future cash flows involved or the current fair value of the instruments and, therefore, do not indicate the Group’s exposure tocredit or price risks. The derivative instruments become favourable (assets) or unfavourable (liabilities) as a result of fluctuations in market interest rates orforeign exchange rates relative to their terms. The aggregate contractual or principal amount of derivative financial instruments on hand, the extent to whichinstruments are favourable or unfavourable and, thus the aggregate fair values of derivative financial assets and liabilities can fluctuate significantly over time.The principal or agreed amounts and fair values of derivative instruments held are set out in the following table. This table reflects the gross positionbefore the netting of any counterparty position by type of instrument and covers contracts with a maturity date subsequent to 31 December <strong>2002</strong>. Thesecontracts were entered into by Alfa Bank Group mainly in December <strong>2002</strong>, and are short term in nature.Domestic}ForeignPrincipal or Negative fair} Positive fair} Principal or Negative fair} Positive fairagreed amount value} value} agreed amount value} valueDeliverable forwardsForeign currency- sale of foreign currency . . . . . . . . . . . . . . . . . . . . . . . . . . . . . . . 263,512 -} 392 506,746 -} 551- purchase of foreign currency . . . . . . . . . . . . . . . . . . . . . . . . . . . 273,753 (60) - 505,623 (398) -Precious metals- sale of precious metals . . . . . . . . . . . . . . . . . . . . . . . . . . . . . . . - -} - 1,846 -} 34- purchase of precious metals . . . . . . . . . . . . . . . . . . . . . . . . . . . - -} - 3,306 (63) -Securities- sale of securities . . . . . . . . . . . . . . . . . . . . . . . . . . . . . . . . . . . . 172,729 (2,174) 2,940 - -} -- purchase of securities . . . . . . . . . . . . . . . . . . . . . . . . . . . . . . . . 6,331 (38) 76 - -} -SpotForeign currency- sale of foreign currency . . . . . . . . . . . . . . . . . . . . . . . . . . . . . . . 189,547 -} 84 232,869 (22) -- purchase of foreign currency . . . . . . . . . . . . . . . . . . . . . . . . . . . 189,631 -} - 232,847 -} -(2,272) 3,492 (483) 585For the above deals the Group has recorded a net gain of USD 518 thousand which is included within net interest, fees and other income on bankingactivities, and a net gain of USD 804 thousand which is included within gains less losses arising from trading securities.9091
Alfa GroupNotes to the Consolidated Financial Statements for the Year Ended 31 December <strong>2002</strong>(Expressed in thousands of US dollars for presentational purposes only – see Note 3)Alfa GroupNotes to the Consolidated Financial Statements for the Year Ended 31 December <strong>2002</strong>(Expressed in thousands of US dollars for presentational purposes only – see Note 3)32. CONTINGENT LIABILITIESLegal proceedingsFrom time to time and in the normal course of business, claims against the Group are received from customers and other parties. Management is of theopinion that no material unaccrued losses will be incurred and accordingly no provision has been made in these consolidated financial statements.In February <strong>2002</strong> Norex Petroleum Limited, a Cypriot company, filed a lawsuit against various entities of Alfa Group and certain other defendants inthe United States District Court for the Southern District of New York over the ownership of a company which is currently owned by TNK Industrial.The Group believes that it has substantial defences to jurisdiction and venue in the United States, and has filed a comprehensive motion to dismiss thecomplaint. Management believes that the allegations in the complaint are without merit and intends to vigorously defend this action.TaxationRussian tax legislation is subject to varying interpretations and constant changes, which may be retroactive. Further, the interpretation of tax legislationby tax authorities as applied to the transactions and activity of the Group may not coincide with that of Management. As a result, transactions may bechallenged by tax authorities and the Group may be assessed additional taxes, penalties and interest, which can be significant.Current Russian tax legislation is principally based on the formal manner in which transactions are documented and the underlying accounting treatment asprescribed by the Regulations on Accounting and <strong>Report</strong>ing in the Russian Federation. Accordingly, there are opportunities for companies to structure transactionsso as to take advantage of opportunities in the Russian tax legislation to reduce the overall effective tax rate. The consolidated statement of income aspresented in these consolidated financial statements includes reclassifications to reflect the underlying economic substance of those transactions. The effectof these reclassifications does not have an effect on the Group’s profit before taxation or the tax charge recorded in these consolidated financial statements.In addition, transfer pricing legislation, which was introduced from 1 January 1999 in Russia, provides the possibility for tax authorities to make transfer pricingadjustments and impose additional tax liabilities in respect to all controlled transactions, provided that the transaction price differs from the market priceby more than 20%. Controlled transactions include transactions with related parties, and transactions with unrelated parties if the price differs on similartransactions with two different counterparties by more than 20%. There is currently no formal guidance as to how these rules should be applied in practice.Management regularly reviews the Group’s taxation compliance with applicable legislation, laws and decrees and current interpretations published bythe authorities in the various jurisdictions in which the Group has operations. From time to time potential exposures are identified and at any point intime a number of open matters may exist. Management believes that adequate provision has been made for all material liabilities. Tax years remain opento review by the Russian tax authorities for three years and up to six years in other jurisdictions.InsuranceThe Group is subject to political, legislative, fiscal and regulatory developments and risks, which are not covered by insurance. No provisions for selfinsuranceare included in these consolidated financial statements and the occurrence of significant losses and impairments associated with facilitiescould have a material effect on the Group’s operations.Assets pledgedAt 31 December <strong>2002</strong>, the Group had assets in the total amount of USD 228,384 thousand (2001: USD 185,608 thousand) pledged (Notes 4, 5, 9, 12).In addition, at 31 December <strong>2002</strong>, securities purchased by the Group under reverse sale repurchase agreements with banks with a fair value of USD61,811 thousand (2001: USD 35,950 thousand) were sold by the Group under sale and repurchase agreements with banks (Notes 8, 17).Mandatory cash balances with the CBRF and local central banks in the amount of USD 214,252 thousand (2001: USD 155,071 thousand) representmandatory reserve deposits which are not available to finance the Group’s day to day operations.At 31 December <strong>2002</strong>, common shares representing 5.57% (2001: 2.94%) of total common shares of OAO Vimpel-Communications were pledged assecurity for liabilities (Notes 7, 15 and 21).Also, refer to Note 15 for information on the pledge of shares of Alfa Bank and Perekriostok.33. FIDUCIARY ASSETSThese assets are not included in the Group’s balance sheet as they are not assets of the Group. Nominal values disclosed below may be different fromthe fair values of certain securities. The fiduciary assets fall into the following categories:<strong>2002</strong> 2001Nominal value Nominal valueBills of exchange of companies held in custody . . . . . . . . . . . . . . . . . . . . . . . . . . . . . . . . . . . . . . . . . . . . . . . . . . . . . . . . . . . . . . . . . . . . . . . . . . . . . . 275,294 -Shares in companies held in custody . . . . . . . . . . . . . . . . . . . . . . . . . . . . . . . . . . . . . . . . . . . . . . . . . . . . . . . . . . . . . . . . . . . . . . . . . . . . . . . . . . . . . 212,879 98,768Eurobonds in Euroclear . . . . . . . . . . . . . . . . . . . . . . . . . . . . . . . . . . . . . . . . . . . . . . . . . . . . . . . . . . . . . . . . . . . . . . . . . . . . . . . . . . . . . . . . . . . . . . . . 135,450 14,700Corporate bonds held in custody . . . . . . . . . . . . . . . . . . . . . . . . . . . . . . . . . . . . . . . . . . . . . . . . . . . . . . . . . . . . . . . . . . . . . . . . . . . . . . . . . . . . . . . . . 64,574 -Client OVGVZ held on account with Vneshtorgbank . . . . . . . . . . . . . . . . . . . . . . . . . . . . . . . . . . . . . . . . . . . . . . . . . . . . . . . . . . . . . . . . . . . . . . . . . . . 40,343 50,988Client OFZ securities held on an account with NDC . . . . . . . . . . . . . . . . . . . . . . . . . . . . . . . . . . . . . . . . . . . . . . . . . . . . . . . . . . . . . . . . . . . . . . . . . . . 18,521 28,09134. RELATED PARTY TRANSACTIONSFor the purposes of these consolidated financial statements, parties are considered to be related if one party has the ability to control the other party orexercise significant influence over the other party in making financial or operational decisions as defined by IAS 24 “Related Party Disclosures”. In consideringeach possible related party relationship, attention is directed to the substance of the relationship, not merely the legal form.The consolidated financial statements of the Group include the following significant transactions and balances with companies forming part of theGroup and other related parties. All related party transactions were priced on an arm’s length basis using market prices.<strong>2002</strong> 2001Loans and advances to customers (Note 9)TNK Industrial . . . . . . . . . . . . . . . . . . . . . . . . . . . . . . . . . . . . . . . . . . . . . . . . . . . . . . . . . . . . . . . . . . . . . . . . . . . . . . . . . . . . . . . . . . . . . . . . . . . . . . . 56,082 110,256NGK Slavneft . . . . . . . . . . . . . . . . . . . . . . . . . . . . . . . . . . . . . . . . . . . . . . . . . . . . . . . . . . . . . . . . . . . . . . . . . . . . . . . . . . . . . . . . . . . . . . . . . . . . . . . 49,500 -Hayard Investments Limited . . . . . . . . . . . . . . . . . . . . . . . . . . . . . . . . . . . . . . . . . . . . . . . . . . . . . . . . . . . . . . . . . . . . . . . . . . . . . . . . . . . . . . . . . . . . 40,966 54,981Other . . . . . . . . . . . . . . . . . . . . . . . . . . . . . . . . . . . . . . . . . . . . . . . . . . . . . . . . . . . . . . . . . . . . . . . . . . . . . . . . . . . . . . . . . . . . . . . . . . . . . . . . . . . . . 37,946 40,628184,494 205,865Trade and other accounts receivable (Note 10)TNK Industrial . . . . . . . . . . . . . . . . . . . . . . . . . . . . . . . . . . . . . . . . . . . . . . . . . . . . . . . . . . . . . . . . . . . . . . . . . . . . . . . . . . . . . . . . . . . . . . . . . . . . . . . 53,546 35,843Hayard Investments Limited . . . . . . . . . . . . . . . . . . . . . . . . . . . . . . . . . . . . . . . . . . . . . . . . . . . . . . . . . . . . . . . . . . . . . . . . . . . . . . . . . . . . . . . . . . . . 6,856 -CBK Kama . . . . . . . . . . . . . . . . . . . . . . . . . . . . . . . . . . . . . . . . . . . . . . . . . . . . . . . . . . . . . . . . . . . . . . . . . . . . . . . . . . . . . . . . . . . . . . . . . . . . . . . . . 1,296 -Management . . . . . . . . . . . . . . . . . . . . . . . . . . . . . . . . . . . . . . . . . . . . . . . . . . . . . . . . . . . . . . . . . . . . . . . . . . . . . . . . . . . . . . . . . . . . . . . . . . . . . . . . 41,878 -Other . . . . . . . . . . . . . . . . . . . . . . . . . . . . . . . . . . . . . . . . . . . . . . . . . . . . . . . . . . . . . . . . . . . . . . . . . . . . . . . . . . . . . . . . . . . . . . . . . . . . . . . . . . . . . 2,423 3,814105,999 39,657Trading Securities (Note 12)TNK Industrial . . . . . . . . . . . . . . . . . . . . . . . . . . . . . . . . . . . . . . . . . . . . . . . . . . . . . . . . . . . . . . . . . . . . . . . . . . . . . . . . . . . . . . . . . . . . . . . . . . . . . . . 26,928 -VympelCom Group . . . . . . . . . . . . . . . . . . . . . . . . . . . . . . . . . . . . . . . . . . . . . . . . . . . . . . . . . . . . . . . . . . . . . . . . . . . . . . . . . . . . . . . . . . . . . . . . . . . 12,372 -Kyivstar . . . . . . . . . . . . . . . . . . . . . . . . . . . . . . . . . . . . . . . . . . . . . . . . . . . . . . . . . . . . . . . . . . . . . . . . . . . . . . . . . . . . . . . . . . . . . . . . . . . . . . . . . . . 8,910 -Other . . . . . . . . . . . . . . . . . . . . . . . . . . . . . . . . . . . . . . . . . . . . . . . . . . . . . . . . . . . . . . . . . . . . . . . . . . . . . . . . . . . . . . . . . . . . . . . . . . . . . . . . . . . . . 4,173 -52,383 -Bills of exchange (Note 15)TNK Industrial . . . . . . . . . . . . . . . . . . . . . . . . . . . . . . . . . . . . . . . . . . . . . . . . . . . . . . . . . . . . . . . . . . . . . . . . . . . . . . . . . . . . . . . . . . . . . . . . . . . . . . . 52,718 2,56452,718 2,564Amounts owed to depositors (Note 16)TNK Industrial . . . . . . . . . . . . . . . . . . . . . . . . . . . . . . . . . . . . . . . . . . . . . . . . . . . . . . . . . . . . . . . . . . . . . . . . . . . . . . . . . . . . . . . . . . . . . . . . . . . . . . . 75,854 35,031VympelCom Group . . . . . . . . . . . . . . . . . . . . . . . . . . . . . . . . . . . . . . . . . . . . . . . . . . . . . . . . . . . . . . . . . . . . . . . . . . . . . . . . . . . . . . . . . . . . . . . . . . . 21,502 21,402Other . . . . . . . . . . . . . . . . . . . . . . . . . . . . . . . . . . . . . . . . . . . . . . . . . . . . . . . . . . . . . . . . . . . . . . . . . . . . . . . . . . . . . . . . . . . . . . . . . . . . . . . . . . . . . 20,600 10,220117,956 66,653Trade and other accounts payable (Note 21)Accrued compensation expense to Management . . . . . . . . . . . . . . . . . . . . . . . . . . . . . . . . . . . . . . . . . . . . . . . . . . . . . . . . . . . . . . . . . . . . . . . . . . . . . 76,497 144,260TNK Industrial . . . . . . . . . . . . . . . . . . . . . . . . . . . . . . . . . . . . . . . . . . . . . . . . . . . . . . . . . . . . . . . . . . . . . . . . . . . . . . . . . . . . . . . . . . . . . . . . . . . . . . . 5,734 36,122CBK Kama . . . . . . . . . . . . . . . . . . . . . . . . . . . . . . . . . . . . . . . . . . . . . . . . . . . . . . . . . . . . . . . . . . . . . . . . . . . . . . . . . . . . . . . . . . . . . . . . . . . . . . . . . 506 -Other . . . . . . . . . . . . . . . . . . . . . . . . . . . . . . . . . . . . . . . . . . . . . . . . . . . . . . . . . . . . . . . . . . . . . . . . . . . . . . . . . . . . . . . . . . . . . . . . . . . . . . . . . . . . . 5,468 4,33088,205 184,712Cost of salesTNK Industrial . . . . . . . . . . . . . . . . . . . . . . . . . . . . . . . . . . . . . . . . . . . . . . . . . . . . . . . . . . . . . . . . . . . . . . . . . . . . . . . . . . . . . . . . . . . . . . . . . . . . . . 655,145 1,988,979CBK Kama . . . . . . . . . . . . . . . . . . . . . . . . . . . . . . . . . . . . . . . . . . . . . . . . . . . . . . . . . . . . . . . . . . . . . . . . . . . . . . . . . . . . . . . . . . . . . . . . . . . . . . . . . 3,298 -658,443 1,988,979Fee and other income on banking activities (Note 22)TNK Industrial . . . . . . . . . . . . . . . . . . . . . . . . . . . . . . . . . . . . . . . . . . . . . . . . . . . . . . . . . . . . . . . . . . . . . . . . . . . . . . . . . . . . . . . . . . . . . . . . . . . . . . . 36,618 113,557Akrikhin . . . . . . . . . . . . . . . . . . . . . . . . . . . . . . . . . . . . . . . . . . . . . . . . . . . . . . . . . . . . . . . . . . . . . . . . . . . . . . . . . . . . . . . . . . . . . . . . . . . . . . . . . . . - 4,332Other . . . . . . . . . . . . . . . . . . . . . . . . . . . . . . . . . . . . . . . . . . . . . . . . . . . . . . . . . . . . . . . . . . . . . . . . . . . . . . . . . . . . . . . . . . . . . . . . . . . . . . . . . . . . . 4,725 7,94041,343 125,829Interest Income (Note 22)TNK Industrial . . . . . . . . . . . . . . . . . . . . . . . . . . . . . . . . . . . . . . . . . . . . . . . . . . . . . . . . . . . . . . . . . . . . . . . . . . . . . . . . . . . . . . . . . . . . . . . . . . . . . . . 27,840 11,257Other . . . . . . . . . . . . . . . . . . . . . . . . . . . . . . . . . . . . . . . . . . . . . . . . . . . . . . . . . . . . . . . . . . . . . . . . . . . . . . . . . . . . . . . . . . . . . . . . . . . . . . . . . . . . . 2,831 8,18430,671 19,44192 93
Alfa GroupNotes to the Consolidated Financial Statements for the Year Ended 31 December <strong>2002</strong>(Expressed in thousands of US dollars for presentational purposes only – see Note 3)Alfa GroupNotes to the Consolidated Financial Statements for the Year Ended 31 December <strong>2002</strong>(Expressed in thousands of US dollars for presentational purposes only – see Note 3)34. RELATED PARTY TRANSACTIONS (CONTINUED) 36. SUBSEQUENT EVENTSInterest expense (Note 22)35. PRINCIPAL SUBSIDIARIES, JOINT VENTURESAND ASSOCIATED COMPANIESCountry of incorporationPercentage of ownership and controlFinancial ServicesAlfa Finance Holdings S.A. . . . . . . . . . . . . . . . . . . . . . . . . . . . . . . . . . . . . Luxemburg 77.07% owned and controlled by CTF Holdings LimitedABH Financial Limited . . . . . . . . . . . . . . . . . . . . . . . . . . . . . . . . . . . . . . . . BVI 100% owned and controlled by Alfa Finance Holdings S.A.OAO Alfa Bank . . . . . . . . . . . . . . . . . . . . . . . . . . . . . . . . . . . . . . . . . . . . . Russia 100% owned and controlled by Alfa Finance Holdings S.A.Alfa Capital Holdings (Cyprus) Limited . . . . . . . . . . . . . . . . . . . . . . . . . . . Cyprus 100% owned and controlled by Alfa Finance Holdings S.A.<strong>2002</strong> 2001Other . . . . . . . . . . . . . . . . . . . . . . . . . . . . . . . . . . . . . . . . . . . . . . . . . . . . . . . . . . . . . . . . . . . . . . . . . . . . . . . . . . . . . . . . . . . . . . . . . . . . . . . . . . . . . 9,679 7,1209,679 7,120Guarantees (Note 31)TNK Industrial . . . . . . . . . . . . . . . . . . . . . . . . . . . . . . . . . . . . . . . . . . . . . . . . . . . . . . . . . . . . . . . . . . . . . . . . . . . . . . . . . . . . . . . . . . . . . . . . . . . . . . 218,223 412,881Hayard Investments Limited . . . . . . . . . . . . . . . . . . . . . . . . . . . . . . . . . . . . . . . . . . . . . . . . . . . . . . . . . . . . . . . . . . . . . . . . . . . . . . . . . . . . . . . . . . . . - 45,718Akrikhin . . . . . . . . . . . . . . . . . . . . . . . . . . . . . . . . . . . . . . . . . . . . . . . . . . . . . . . . . . . . . . . . . . . . . . . . . . . . . . . . . . . . . . . . . . . . . . . . . . . . . . . . . . . - 271218,223 458,870The remuneration of key management, including pension contributions, and discretionary compensation amounts to USD 39,586 thousand (2001: USD 86,604thousand) and is included in general and administrative expenses. In addition, during <strong>2002</strong> staff costs in the amount of USD 94,480 thousand (2001: USD 16,338thousand) have been recorded in the consolidated statement of income in respect of management option compensation plans (Notes 14, 23 and 27).Russia, CIS and Southeast Asia CommoditiesEco Holdings Limited . . . . . . . . . . . . . . . . . . . . . . . . . . . . . . . . . . . . . . . . Gibraltar 70% owned and controlled by CTF Holdings LimitedOOO Alfa Eco . . . . . . . . . . . . . . . . . . . . . . . . . . . . . . . . . . . . . . . . . . . . . . Russia 100% owned and controlled by Eco Holdings LimitedOOO Alfa Eco M . . . . . . . . . . . . . . . . . . . . . . . . . . . . . . . . . . . . . . . . . . . . Russia 100% owned and controlled by Eco Holdings LimitedWestvector Limited . . . . . . . . . . . . . . . . . . . . . . . . . . . . . . . . . . . . . . . . . . BVI 100% owned and controlled by Eco Holdings LimitedZAO Petrosakh . . . . . . . . . . . . . . . . . . . . . . . . . . . . . . . . . . . . . . . . . . . . . Russia 95% owned and controlled by Eco Holdings LimitedOAO Volga . . . . . . . . . . . . . . . . . . . . . . . . . . . . . . . . . . . . . . . . . . . . . . . . Russia 92.97% owned and controlled by Hayard Investments LimitedHayard Investments Limited . . . . . . . . . . . . . . . . . . . . . . . . . . . . . . . . . . . Cyprus 50% joint venture of Eco Holdings LimitedPerekriostokIn April 2003, Templeton Strategic Emerging Markets Fund LDC purchased a 7.7% stake in Perekriostok Holdings Limited, the holding company ofPerekriostok for USD 15,000 thousand.TNK IndustrialIn December <strong>2002</strong>, the Russian Government held a privatisation auction for a 74.9% equity interest in OAO Slavneft (“Slavneft”). TNK Industrial, actingjointly with OAO Sibneft (“Sibneft”) on a 50/50 basis, was the winning bidder for this interest for total consideration of USD 1,860,000 thousand. Thisacquisition was completed by TNK Industrial in January 2003 for USD 930,000 thousand.In February 2003 the Group and its joint-venture partner, Access/Renova Group, announced their intention to establish a joint venture with BP, consistingof certain Russian oil and gas assets of BP and assets of TNK Industrial. In the course of the transaction, the Group and Access/Renova Groupwill sell 50% of their interest in TNK Industrial (excluding Slavneft) to BP for cash consideration of USD 2,600,000 thousand and three subsequentannual tranches equivalent to USD 1,250,000 thousand in BP shares from 2004 through 2006. BP will contribute its 50% stake in TNK Industrial andcertain other Russian oil and gas assets into TNK-BP. As a result of the transaction, the Group and Access/Renova Group will hold 50% of TNK-BPand BP will hold the other 50% of TNK-BP. This transaction was completed on 29 August 2003. Alfa Finance Holdings S.A., being a sole shareholderof Alfa Petroleum Holdings Limited, issued certain performance guarantees in relation to this transaction. Alfa Petroleum Holdings Limited issued certainindemnification guarantees in relation to this transaction. A gain on this transaction, which is not currently reasonably estimatable, will be recordedin the Group’s consolidated financial statements for 2003.In April 2003, TNK Industrial reached an agreement with Sibneft to acquire the Sibneft minority interests in Onako and Orenburgneft, both subsidiariesof TNK Industrial, for USD 825,000 thousand in cash.In September 2003, the Group, Access/Renova Group, and BP announced that Slavneft would also be contributed to TNK-BP. The Group andAccess/Renova Group will contribute their interest in Slavneft to TNK-BP for cash consideration from BP of USD 1,350,000 thousand. Managementexpects to complete this transaction by December 2003.MegafonIn August 2003 the Group entered into a transaction to purchase a company that owns 25.1% shares in “Megafon”, the third largest Russian mobileoperator for USD 295,000 thousand.Golden TelecomIn August 2003, Golden Telecom signed a share exchange agreement with affiliates of the Norwegian national operator, Telenor, under which GoldenTelecom will receive 100% of the shares of OAO Comincom, including its wholly-owned subsidiary, OAO Combellga, the third largest alternativeoperator in Russia, in exchange for 19.5% of Golden Telecom, calculated on a post-acquisition basis.Retail TradePerekriostok Holdings Limited . . . . . . . . . . . . . . . . . . . . . . . . . . . . . . . . . . Gibraltar 85.94% owned and controlled by CTF Holdings LimitedZAO TD Perekriostok . . . . . . . . . . . . . . . . . . . . . . . . . . . . . . . . . . . . . . . . Russia 100% owned and controlled by Perekriostok Holdings LimitedOOO Perekriostok 2000 . . . . . . . . . . . . . . . . . . . . . . . . . . . . . . . . . . . . . . . Russia 100% owned and controlled by Perekriostok Holdings LimitedGUM Holdings Limited . . . . . . . . . . . . . . . . . . . . . . . . . . . . . . . . . . . . . . . Gibraltar 85.94% owned and controlled by CTF Holdings LimitedOil and GasAlfa Petroleum Holdings Limited . . . . . . . . . . . . . . . . . . . . . . . . . . . . . . . . BVI 100% owned and controlled by Alfa Finance Holdings S.A.TNK Industrial Holdings Limited . . . . . . . . . . . . . . . . . . . . . . . . . . . . . . . . BVI 50% joint venture of Alfa Petroleum Holdings LimitedOAO SIDANCO . . . . . . . . . . . . . . . . . . . . . . . . . . . . . . . . . . . . . . . . . . . . . Russia 67.9% owned and controlled by TNK Industrial Holdings LimitedSlavneft . . . . . . . . . . . . . . . . . . . . . . . . . . . . . . . . . . . . . . . . . . . . . . . . . . Russia 11.95% owned by TNK Industrial Holdings LimitedTelecommunicationsAlfa Telecom Limited . . . . . . . . . . . . . . . . . . . . . . . . . . . . . . . . . . . . . . . . . BVI 100% owned and controlled by Alfa Finance Holdings S.A.Golden Telecom Inc. . . . . . . . . . . . . . . . . . . . . . . . . . . . . . . . . . . . . . . . . . USA 40% owned by Alfa Telecom LimitedKyivstar . . . . . . . . . . . . . . . . . . . . . . . . . . . . . . . . . . . . . . . . . . . . . . . . . . Ukraine 20.1% owned by Alfa Telecom LimitedEco Telecom Limited . . . . . . . . . . . . . . . . . . . . . . . . . . . . . . . . . . . . . . . . . Gibraltar 100% owned and controlled by Eco Holdings limitedOAO Vimpel-Communications . . . . . . . . . . . . . . . . . . . . . . . . . . . . . . . . . . Russia 25% plus one share owned by Eco Telecom Limited9495