Arkansas Department of Correction 2003 and 2004 Recidivism Study
2003-2004 Recidivism Study - Arkansas Department of Correction
2003-2004 Recidivism Study - Arkansas Department of Correction

You also want an ePaper? Increase the reach of your titles
YUMPU automatically turns print PDFs into web optimized ePapers that Google loves.
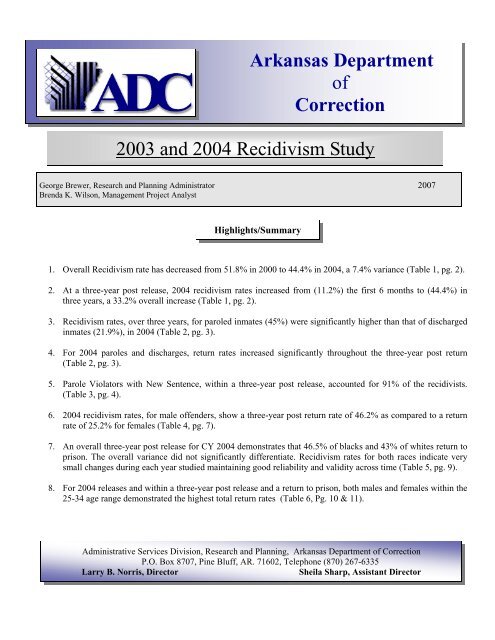
<strong>Arkansas</strong> <strong>Department</strong><strong>of</strong><strong>Correction</strong><strong>2003</strong> <strong>and</strong> <strong>2004</strong> <strong>Recidivism</strong> <strong>Study</strong>George Brewer, Research <strong>and</strong> Planning Administrator 2007Brenda K. Wilson, Management Project AnalystHighlights/Summary1. Overall <strong>Recidivism</strong> rate has decreased from 51.8% in 2000 to 44.4% in <strong>2004</strong>, a 7.4% variance (Table 1, pg. 2).2. At a three-year post release, <strong>2004</strong> recidivism rates increased from (11.2%) the first 6 months to (44.4%) inthree years, a 33.2% overall increase (Table 1, pg. 2).3. <strong>Recidivism</strong> rates, over three years, for paroled inmates (45%) were significantly higher than that <strong>of</strong> dischargedinmates (21.9%), in <strong>2004</strong> (Table 2, pg. 3).4. For <strong>2004</strong> paroles <strong>and</strong> discharges, return rates increased significantly throughout the three-year post return(Table 2, pg. 3).5. Parole Violators with New Sentence, within a three-year post release, accounted for 91% <strong>of</strong> the recidivists.(Table 3, pg. 4).6. <strong>2004</strong> recidivism rates, for male <strong>of</strong>fenders, show a three-year post return rate <strong>of</strong> 46.2% as compared to a returnrate <strong>of</strong> 25.2% for females (Table 4, pg. 7).7. An overall three-year post release for CY <strong>2004</strong> demonstrates that 46.5% <strong>of</strong> blacks <strong>and</strong> 43% <strong>of</strong> whites return toprison. The overall variance did not significantly differentiate. <strong>Recidivism</strong> rates for both races indicate verysmall changes during each year studied maintaining good reliability <strong>and</strong> validity across time (Table 5, pg. 9).8. For <strong>2004</strong> releases <strong>and</strong> within a three-year post release <strong>and</strong> a return to prison, both males <strong>and</strong> females within the25-34 age range demonstrated the highest total return rates (Table 6, Pg. 10 & 11).Administrative Services Division, Research <strong>and</strong> Planning, <strong>Arkansas</strong> <strong>Department</strong> <strong>of</strong> <strong>Correction</strong>P.O. Box 8707, Pine Bluff, AR. 71602, Telephone (870) 267-6335Larry B. Norris, DirectorSheila Sharp, Assistant Director
<strong>Arkansas</strong>’ <strong>Recidivism</strong> <strong>Study</strong> (Addendum)The <strong>2003</strong> <strong>and</strong> <strong>2004</strong> recidivism research is an addendum to the original 1997-1999 study produced in<strong>2003</strong> <strong>and</strong> the 2000 addendum produced in <strong>2004</strong> <strong>and</strong> the 2001 addendum produced in 2005 <strong>and</strong> the2002 addendum produced in 2006. This addendum was prepared by the <strong>Arkansas</strong> <strong>Department</strong> <strong>of</strong><strong>Correction</strong>'s Research <strong>and</strong> Planning Division. The addendum reviews the return rates <strong>of</strong> inmatesreleased from custody in CY<strong>2003</strong> <strong>and</strong> CY<strong>2004</strong>, as compared to prior years. The data for this researchwas obtained from the ADC electronic Offender Management Information System (eOMIS). If anindividual was released January 1, <strong>2003</strong> through December 31, <strong>2003</strong>, <strong>and</strong> January 1, <strong>2004</strong> throughDecember 31, <strong>2004</strong>, respectively, the data provided reflects returns for a full three-year post release.All charts <strong>and</strong> tables reflect a three-year post release review <strong>and</strong> utilized strictly for clarity <strong>and</strong> ease tothe reader.The study is categorized into return rates <strong>of</strong> six (6) months, one (1) year, <strong>and</strong> three (3) years,respectively. As with the 2002 addendum regarding a three-year post release <strong>of</strong> inmates produced in2006, the ADC Research <strong>and</strong> Planning Section will continue to study, track <strong>and</strong> update trends inrelease/return rates annually.Overall <strong>Recidivism</strong> RatesAs demonstrated, table one (1) <strong>and</strong> figure one (1) show the overall ADC <strong>2004</strong> recidivism rates. Thepost-release period consists <strong>of</strong> six months, one-year, <strong>and</strong> three years, from 1997 through <strong>2004</strong>. In<strong>2003</strong>, there were a total <strong>of</strong> 6,135 inmates, <strong>and</strong> in <strong>2004</strong>, there were a total <strong>of</strong> 6244, released from ADC(refer to table, year <strong>2003</strong> <strong>and</strong> <strong>2004</strong>). Within six months <strong>of</strong> release, 12.9% for <strong>2003</strong><strong>and</strong> 11.2% for<strong>2004</strong>, returned to prison. Within one year <strong>of</strong> release, 25.9% for <strong>2003</strong>, <strong>and</strong> 22.1% for <strong>2004</strong>, returned<strong>and</strong> within three years there was an overall <strong>of</strong> 47.4% for <strong>2003</strong> <strong>and</strong> 44.4% for <strong>2004</strong> returned toprison. ADC is experiencing an approximate 49.4% average return rate <strong>of</strong> inmates releasedfrom prison.* In all tables, the “number <strong>of</strong> releases”, are the number <strong>of</strong> unduplicated releases in a given yearused to generate recidivism rates. Table <strong>and</strong> Figure 1 do not specify the type <strong>of</strong> return. Theydemonstrate an overall return rate, regardless <strong>of</strong> reason.Table 1Overall <strong>Recidivism</strong> RatesTotal %# % # % #Release Number Returned Returned Returned Returned Returned Returned Total %Year Releases 6 Months 6 Months 1 Year 1 Year 3 Years 3 Years Returns1997 4668 15.4% 721 29.9% 1394 49.0% 2289 49.0%1998 5434 16.5% 898 31.2% 1694 52.0% 2825 50.7%1999 5330 15.6% 832 30.6% 1629 51.4% 2738 51.4%2000 5872 14.2% 834 29.0% 1701 51.8% 3040 51.8%2001 5962 15.9% 948 29.7% 1771 51.4% 3066 51.4%2002 6015 15.1% 911 28.5% 1716 49.4% 2969 49.4%<strong>2003</strong> 6135 12.9% 792 25.9% 1586 47.4% 2905 47.4%<strong>2004</strong> 6244 11.2% 698 22.1% 1377 44.4% 2772 44.4%Averages 5708 14.6% 829 28.3% 1609 49.6% 2826 49.4%
Figure 1<strong>2003</strong> <strong>and</strong> <strong>2004</strong> <strong>Recidivism</strong> <strong>Study</strong>(Addendum) 2Overall <strong>Recidivism</strong> Rates60504030203 Yr1 Yr6 Mths1001997 1998 1999 2000 2001 2002 <strong>2003</strong> <strong>2004</strong>Year<strong>Recidivism</strong> Rates: Release TypeTable two (2) demonstrates recidivism rate by type <strong>of</strong> release. ADC releases inmates by parole withsupervision, which is granted by the Parole Board or by discharge (max flat <strong>of</strong> sentence). In <strong>2003</strong> <strong>and</strong><strong>2004</strong>, there were 5,958 inmates <strong>and</strong> 6,075 inmates, respectively, released by regular parole <strong>and</strong> 177inmates <strong>and</strong> 169 inmates, respectively, discharged. Results indicate that within six months <strong>of</strong> releasein <strong>2003</strong>, 788 or 13.2% <strong>and</strong> in <strong>2004</strong>, 693 or 11.4% inmates released returned as a result <strong>of</strong> paroleviolation, while only 4 or 2.3% in <strong>2003</strong> <strong>and</strong> 5 or 3.0% in <strong>2004</strong>, <strong>of</strong> inmates discharged returned with anew sentence. Total returns <strong>of</strong> parole releases from ADC demonstrate a 48% in <strong>2003</strong> <strong>and</strong> a 45.0% in<strong>2004</strong> recidivism rates, while discharges show a 24.3% return rate in <strong>2003</strong> <strong>and</strong> a 21.9% in <strong>2004</strong>.Table 2<strong>Recidivism</strong> Rates By Type <strong>of</strong> ReleaseYear Type <strong>of</strong> Total 6 Mths % 1 Year % 3 Years %Release Releases Returns Returns Returns Returns Returns Returns1997 Paroled - Regular 3964 693 17.5% 1316 33.2% 2129 53.7%Discharge 692 28 4.0% 77 11.1% 204 29.5%1998 Paroled - Regular 4798 870 18.1% 1557 32.5% 2596 54.1%Discharge 624 27 4.3% 65 10.4% 156 25.0%1999 Paroled - Regular 4677 803 17.2% 1557 33.3% 2553 54.6%Discharge 643 28 4.4% 71 11.0% 184 28.6%2000 Paroled - Regular 5691 832 14.6% 1691 29.7% 3005 52.8%Discharge 181 2 1.1% 10 5.5% 35 19.3%2001 Paroled - Regular 5778 947 16.4% 1762 30.5% 3042 52.6%Discharge 184 1 0.5% 9 4.9% 24 13.0%2002 Paroled - Regular 5841 910 15.6% 1707 29.2% 2938 50.3%Discharge 174 1 0.6% 9 5.2% 31 17.8%<strong>2003</strong> Paroled - Regular 5958 788 13.2% 1577 26.5% 2861 48.0%Discharge 177 4 2.3% 9 5.1% 43 24.3%<strong>2004</strong> Paroled - Regular 6075 693 11.4% 1368 22.5% 2735 45.0%Discharge 169 5 3.0% 9 5.3% 37 21.9%Total Par Reg 36824 5074 13.8% 10958 29.8% 18998 51.6%Total Disch 2667 92 3.4% 250 9.4% 671 25.2%
<strong>2003</strong> <strong>and</strong> <strong>2004</strong> <strong>Recidivism</strong> <strong>Study</strong>(Addendum) 3<strong>Recidivism</strong> Rates: (Return Types) Parolees <strong>and</strong> DischargesTable 3 <strong>and</strong> Figures (3, 3-1, 3-2, 3-3) show inmates that return to prison for parole violations with anew sentence(s), parole violators returning with a technical violation(s), <strong>and</strong> discharged (areconvicted inmate) that returned to prison as a recommitment with a new sentence. Since theopening <strong>of</strong> the Technical Parole Violator Program, a return to prison for a technical violation while onparole has vastly decreased to no returns for releases <strong>of</strong> <strong>2003</strong> <strong>and</strong> <strong>2004</strong>, while a parole violation witha new sentence carries the majority <strong>of</strong> returns. Even though a new conviction may also have atechnical violation attached, the new conviction in most cases will supersede the technicalviolation making the new conviction the primary reason for return to prison. In <strong>2003</strong> <strong>and</strong> <strong>2004</strong>,as reflected in Table 3 <strong>and</strong> Figure 3, within three years, 2,668 or 43.5% <strong>and</strong> 2,535 or 40.6%,respectively, <strong>of</strong> the parolees return to prison as a result <strong>of</strong> a parole violation with new sentence, 237or 3.9% <strong>and</strong> 237 or 3.8%, respectively, <strong>of</strong> the discharged inmates returned as a result <strong>of</strong> a newcharge <strong>and</strong> there were zero (0) returned as a result <strong>of</strong> a technical violation for both <strong>2003</strong> <strong>and</strong> <strong>2004</strong>.Table 3<strong>Recidivism</strong> Of Parolees And DischargesYear Total Type <strong>of</strong> 6 Mths % 1 Year % 3 Years %Releases Return Returns Returns Returns Returns Returns ReturnsPV/New Sentence 179 3.8% 326 6.9% 512 10.9%1997 4668 PV/Technical 511 10.9% 976 20.9% 1453 31.1%Discharge - Reconviction 31 0.7% 92 2.0% 324 7.0%PV/New Sentence 195 3.6% 378 7.0% 629 11.6%1998 5434 PV/Technical 674 12.4% 1167 21.5% 1854 34.1%Discharge - Reconviction 29 0.5% 79 1.4% 272 5.0%PV/New Sentence 217 4.1% 388 7.3% 616 11.6%1999 5323 PV/Technical 581 10.9% 1156 21.7% 1848 34.7%Discharge - Reconviction 30 0.6% 81 1.6% 309 5.9%PV/New Sentence 196 3.3% 424 7.2% 795 13.5%2000 5872 PV/Technical 633 10.8% 1254 10.6% 2078 14.0%Discharge - Reconviction 5 0.1% 23 0.4% 167 2.9%PV/New Sentence 283 4.7% 540 9.1% 913 15.3%2001 5962 PV/Technical 663 11.1% 1211 20.3% 1972 33.1%Discharge - Reconviction 2 0.0% 20 0.3% 181 3.0%PV/New Sentence 793 13.2% 1516 25.2% 2549 42.4%2002 6015 PV/Technical 113 1.9% 174 2.9% 215 3.6%Discharge - Reconviction 5 0.1% 26 0.4% 205 3.4%PV/New Sentence 785 12.8% 1558 25.4% 2668 43.5%<strong>2003</strong> 6135 Discharge - Reconviction 7 0.1% 28 0.5% 237 3.9%PV/New Sentence 686 11.0% 1341 21.5% 2535 40.6%<strong>2004</strong> 6244 Discharge - Reconviction 12 0.2% 36 0.6% 237 3.8%Total 45653 6630 14.5% 12794 28.0% 22569 49.4%
<strong>2003</strong> <strong>and</strong> <strong>2004</strong> <strong>Recidivism</strong> <strong>Study</strong>(Addendum) 4Figure 3Parolees Returning W/Tech. Violation250020001500100050006 Mths 1 Year 3 YearsReturn Within1997 Tech.Viol.1998 Tech.Viol.1999 Tech.Viol.2000 Tech.Viol.2001 Tech.Viol.2002 Tech. Viol.Figure 3-1300025002000150010005000Parolees With New Sentences6 Mths 1 Year 3 YearsReturn Within1997 PV/NT1998 PV/NT1999 PV/NT2000 PV/NT2001 PV/NT2002 PV/NT<strong>2003</strong> PV/NT<strong>2004</strong> PV/NTFigure 3-2250Discharges with New Sentences2001501005006 Mths 1 Year 3 YearsReturn Within1997 New Sent1998 New Sent1999 New Sent2000 New Sent2001 New Sent2002 New Sent<strong>2003</strong> New Sent<strong>2004</strong> New Sent
Figure 3-3<strong>2003</strong> <strong>and</strong> <strong>2004</strong> <strong>Recidivism</strong> <strong>Study</strong>(Addendum) 5Recidivsm <strong>2003</strong>30002500200015001000500<strong>2003</strong> PV/NT<strong>2003</strong> New Sent06 Mths 1 Year 3 YearsReturn WithinFigure 3-4Recidivsm <strong>2004</strong>30002500200015001000500<strong>2004</strong> PV/NT<strong>2004</strong> New Sent06 Mths 1 Year 3 YearsReturn Within<strong>Recidivism</strong> Rates: GenderTable 4 <strong>and</strong> Figures 4, 4-1, 4-2 exhibits recidivism rates by gender. In <strong>2003</strong> <strong>and</strong> <strong>2004</strong>, malesincreased in return rates over the three-year post release time frame. From six months to one-year,data demonstrated a fairly constant return rate for both males <strong>and</strong> females; however, by the end <strong>of</strong> thethird year there was a significant increase in males returning to prison. Within each consecutive year,the overall return rate for males increased from 1997 to 2001, while 2001 to <strong>2004</strong> reflects a 6.4 %decrease in overall recidivism rates.
<strong>2003</strong> <strong>and</strong> <strong>2004</strong> <strong>Recidivism</strong> <strong>Study</strong>(Addendum) 6Table 4<strong>Recidivism</strong> Rates By GenderYear Gender Total 6 month % 1 Year % 3 Years Total % Total InmatesReleases Return Returns Returns Returns Returns Returns Not Returning1997 Female 439 38 8.7% 94 21.4% 162 36.9% 277Male 4229 683 16.2% 1300 30.7% 2127 50.3% 21021998 Female 512 75 14.6% 123 24.0% 227 44.3% 285Male 4922 823 16.7% 1501 30.5% 2528 51.4% 23941999 Female 545 58 10.6% 115 21.1% 206 37.8% 339Male 4785 774 16.2% 1514 31.6% 2532 52.9% 22532000 Female 652 75 11.5% 158 24.2% 264 40.5% 388Male 5220 759 14.5% 1543 29.6% 2766 53.0% 24542001 Female 625 81 13.0% 140 22.4% 260 41.6% 365Male 5337 867 16.2% 1631 30.6% 2806 52.6% 25312002 Female 594 67 11.3% 134 22.6% 242 40.7% 320Male 5421 844 15.6% 1582 29.2% 2727 50.3% 2426<strong>2003</strong> Female 616 54 8.8% 111 18.0% 215 34.9% 401Male 5519 738 13.4% 1475 26.7% 2690 48.7% 2829<strong>2004</strong> Female 551 31 5.6% 56 10.2% 139 25.2% 413Male 5693 667 11.7% 1321 23.2% 2633 46.2% 3060Figure 4300025002000150010005000<strong>Recidivism</strong> By Gender6 mths 1 Year 3 YearsReturned WithinMales 1997Males 1998Males 1999M ales 2000M ales 2001M ales 2002M ales <strong>2003</strong>M ales <strong>2004</strong>Females 1997Females 1998Females 1999Females 2000Females 2001Females 2002Females <strong>2003</strong>Females <strong>2004</strong>
Figure 4-1<strong>2003</strong> <strong>and</strong> <strong>2004</strong> <strong>Recidivism</strong> <strong>Study</strong>(Addendum) 7300025002000150010005000<strong>Recidivism</strong> - Males6 mths 1 Year 3 YearsReturn Within199719981999200020012002<strong>2003</strong><strong>2004</strong>Figure 4-2300250200150100500<strong>Recidivism</strong> - Females6 mths 1 Year 3 YearsReturn Within199719981999200020012202<strong>2003</strong><strong>2004</strong><strong>Recidivism</strong> Rates: Race<strong>Recidivism</strong> rates were generated by race for CY<strong>2003</strong> <strong>and</strong> CY<strong>2004</strong>, respectively, <strong>and</strong> incorporatedtime frames <strong>of</strong> six (6) months, one-year, <strong>and</strong> three-years. <strong>Recidivism</strong> rates were based on three areas<strong>of</strong> ethnic diversity. Within the ADC, the population primarily consists <strong>of</strong> Caucasian <strong>and</strong> African-American racial designation, while only a small percentage consists <strong>of</strong> Hispanic <strong>and</strong> other. For thisreport, the Hispanic category consists <strong>of</strong> Cuban <strong>and</strong> Mexican racial designations, <strong>and</strong> the othercategory incorporates both Asian <strong>and</strong> Native American. The <strong>2003</strong> <strong>and</strong> <strong>2004</strong> recidivism addendumstudy incorporates Caucasian, African-American, Hispanic, <strong>and</strong> other racial designations todemonstrate recidivism rates by race as provided in Table 5. In <strong>2003</strong>, 3,304 <strong>and</strong> in <strong>2004</strong>, 3,450Caucasian inmates were released. Within six (6) months, 467 or 14.1% <strong>and</strong> 432 or 12.5%,respectively, returned to prison. Within one (1) year, 883 or 26.7% <strong>and</strong> 786 or 22.8%, respectively,returned <strong>and</strong> within three (3) years, 1,531 or 46.3% <strong>and</strong> 1,483 or 43.0%, respectively, returned toprison. For CY<strong>2003</strong> <strong>and</strong> CY<strong>2004</strong>, African-American inmates have a slightly higher recidivism rate(48.7% vs. 46.3%) <strong>and</strong> (46.5% vs. 43.0%), respectively, than their Caucasian counterparts (see table5).
Table 5<strong>2003</strong> <strong>and</strong> <strong>2004</strong> <strong>Recidivism</strong> <strong>Study</strong>(Addendum) 8<strong>2004</strong> <strong>Recidivism</strong> Rates By RaceYear Race Total 6 Month % 1 Year % 3 Years %Releases Returns Returns Returns Returns Returns Returns1997 Black 2420 413 17.1% 795 32.9% 1268 52.4%1997 Hispanic 29 2 6.9% 4 13.8% 7 24.1%1997 Other 16 0 0.0% 0 0.0% 2 12.5%1997 White 2202 306 13.9% 595 27.0% 1013 46.0%1998 Black 2685 481 17.9% 877 32.7% 1463 54.5%1998 Hispanic 25 5 20.0% 7 28.0% 8 32.0%1998 Other 18 1 5.6% 4 22.2% 9 50.0%1998 White 2706 411 15.2% 737 27.2% 1275 47.1%1999 Black 2541 414 16.3% 801 31.5% 1362 53.6%1999 Hispanic 19 2 10.5% 3 15.8% 5 26.3%1999 Other 13 0 0.0% 2 15.4% 3 23.1%1999 White 2757 416 15.1% 822 29.8% 1367 49.6%2000 Black 2756 401 14.6% 817 29.6% 1512 54.9%2000 Hispanic 66 6 9.1% 10 15.2% 16 24.2%2000 Other 62 4 6.5% 5 8.1% 9 14.5%2000 White 2988 423 14.2% 869 29.1% 1503 50.3%2001 Black 2718 463 17.0% 839 30.9% 1476 54.3%2001 Hispanic 64 3 4.7% 10 15.6% 18 28.1%2001 Other 45 3 6.7% 4 8.9% 8 17.8%2001 White 3135 479 15.3% 918 29.3% 1564 49.9%2002 Black 2618 408 15.6% 741 28.3% 1335 51.0%2002 Hispanic 75 5 6.7% 9 12.0% 13 17.3%2002 Other 30 0 0.0% 3 10.0% 7 23.3%2002 White 3292 497 15.1% 962 29.2% 1613 49.0%<strong>2003</strong> Black 2768 321 11.6% 691 25.0% 1349 48.7%<strong>2003</strong> Hispanic 50 4 8.0% 11 22.0% 20 40.0%<strong>2003</strong> Other 13 0 0.0% 1 7.7% 5 38.5%<strong>2003</strong> White 3304 467 14.1% 883 26.7% 1531 46.3%<strong>2004</strong> Black 2711 255 9.4% 573 21.1% 1260 46.5%<strong>2004</strong> Hispanic 64 10 15.6% 14 21.9% 24 37.5%<strong>2004</strong> Other 19 1 5.3% 4 21.1% 5 26.3%<strong>2004</strong> White 3450 432 12.5% 786 22.8% 1483 43.0%<strong>Recidivism</strong> Rates: AgeAge shows to be significantly related to recidivism within the ADC. An inmate’s age at his/her lastadmission was significantly related to return to custody (See table 6). For males, this was fairlyevident when reviewing age cohorts <strong>of</strong> 25-34 as primary, <strong>and</strong> 35-44 as secondary return age ranges.Females returning to prison also demonstrated increase returns in age ranges <strong>of</strong> 25-34 <strong>and</strong> 35-44 (SeeFigure 6).
<strong>2003</strong> <strong>and</strong> <strong>2004</strong> <strong>Recidivism</strong> <strong>Study</strong>(Addendum) 9Table 6<strong>2003</strong> <strong>Recidivism</strong> by Age (males)Gender AGE 6 Months 1 Year 3 Years Total %Returns Returns Returns ReturnsMale =65 1 2 4 0.1%Total 738 1475 2690 100.0%Table 6.1<strong>2003</strong> <strong>Recidivism</strong> by Age (females)Gender AGE 6 Months 1 Year 3 Years Total %Returns Returns Returns ReturnsFemale < = 17 0 0 0 0.0%18 - 24 6 10 18 8.4%25 - 34 27 58 108 50.2%35 - 44 14 32 71 33.0%45 -54 6 10 17 7.9%55 - 64 1 1 1 0.5%>=65 0 0 0 0.0%Total 54 111 215 100.0%Table 6.2<strong>2004</strong> <strong>Recidivism</strong> by Age (males)Gender AGE 6 Months 1 Year 3 Years Total %Returns Returns Returns ReturnsMale =65 1 1 2 0.1%Total 844 1582 2727 100.0%
Table 6.3<strong>2004</strong> <strong>Recidivism</strong> by Age (females)<strong>2003</strong> <strong>and</strong> <strong>2004</strong> <strong>Recidivism</strong> <strong>Study</strong>(Addendum) 10Gender AGE 6 Months 1 Year 3 Years Total %Returns Returns Returns ReturnsFemale < = 17 0 0 1 0.4%18 - 24 8 18 29 12.0%25 - 34 26 52 106 43.8%35 - 44 29 54 91 37.6%45 -54 3 9 14 5.8%55 - 64 1 1 1 0.4%>=65 0 0 0 0.0%Total 67 134 242 100.0%Figure 61200<strong>2003</strong> <strong>Recidivism</strong> By AgeMale < = 17Female1000800Male 18 - 24FemaleMale 25 - 34600FemaleMale 35 - 44400200FemaleMale 45 - 54Female06 Mths 1Yr 3 YrsReturn WithinMale >=55FemaleLinear (Male 25 -34)
Figure 6.1<strong>2003</strong> <strong>and</strong> <strong>2004</strong> <strong>Recidivism</strong> <strong>Study</strong>(Addendum) 111200<strong>2004</strong> <strong>Recidivism</strong> By AgeMale < = 17Female1000800Male 18 - 24FemaleMale 25 - 3460040020006 Mths 1Yr 3 YrsReturn WithinFemaleMale 35 - 44FemaleMale 45 - 54FemaleMale >=55FemaleLinear (Male 25- 34)<strong>Recidivism</strong> Rates: OffenseTable Seven (7) reflects the return rates as a result <strong>of</strong> the type <strong>of</strong> <strong>of</strong>fense, for a select period <strong>of</strong> time. Avariety <strong>of</strong> <strong>of</strong>fenses were analyzed in order to underst<strong>and</strong> the breadth <strong>and</strong> depth <strong>of</strong> recidivism rates by<strong>of</strong>fense <strong>and</strong> the return to prison within a three-year time frame. For clarity, Table 7 denotes the<strong>of</strong>fense category, the actual number <strong>of</strong> releases/returns for the years <strong>2003</strong> <strong>and</strong> <strong>2004</strong>, the actualnumbers <strong>and</strong> percent <strong>of</strong> returns within three (3) years for each category.
<strong>2003</strong> <strong>and</strong> <strong>2004</strong> <strong>Recidivism</strong> <strong>Study</strong>(Addendum) 13Three Year <strong>Recidivism</strong> Rates by Offense CategoryOffense Category <strong>2003</strong> Releases Ret w/in 3 yrs <strong>2004</strong> Releases Ret w/in 3 yrsHot Check Violation 84 31 36.9% 97 29 29.9%Incest 6 2 33.3% 12 2 16.7%Inciting Riot 1 0 0.0% 0 0 0.0%Indescent Exposure 2 0 0.0% 0 0 0.0%Interference With Custody 0 0 0.0% 1 1 100.0%Interfering With Law Enf Offic 0 0 0.0% 1 0 0.0%Intro Cont Subs Body/Another 0 0 0.0% 1 0 0.0%Keeping a Gambling House 0 0 0.0% 1 0 0.0%Kidnapping 25 11 44.0% 15 8 53.3%Manslaughter 54 27 50.0% 33 13 39.4%Manu/Del/Poss Control Substance 909 420 46.2% 1268 511 40.3%Murder 1st Degree 57 14 24.6% 50 10 20.0%Murder 2nd Degree 72 29 40.3% 59 21 35.6%Negligent Homicide 14 4 28.6% 8 2 25.0%Non-Support 19 8 42.1% 12 5 41.7%Obtain Signature by Deception 0 0 0.0% 1 0 0.0%Offense Com. Presence <strong>of</strong> Child 1 1 100.0% 0.0%Permit Child Abuse 1 0.0% 1 0 0.0%Poss Anhyd Ammon Unlaw/Container 3 0.0% 2 2 100.0%Poss Firearm Certain Person 36 14 38.9% 73 35 47.9%Poss. Of Firearm - School 2 1 50.0% 0.0%Poss <strong>of</strong> Defaced Firearm 1 0.0% 2 0 0.0%Poss W/Intent to Mfg 5 2 40.0% 5 0 0.0%Possession <strong>of</strong> Drug Paraphernal 2 1 50.0% 0 0 0.0%Possession <strong>of</strong> Ephedrine 6 3 50.0% 5 2 40.0%Promoting Prostitution 1st Degree 0 0 0.0% 1 0 0.0%Rape 50 22 44.0% 64 22 34.4%Reckless Burning 1 0 0.0% 4 3 75.0%Residential Burglary 134 82 61.2% 211 130 61.6%Robbery 504 328 65.1% 406 246 60.6%Sexual Abuse 1st Degree 104 47 45.2% 95 33 34.7%Sexual Assault 14 6 42.9% 21 7 33.3%Sexual Indecency With a Child 0 0 0.0% 1 1 100.0%Sexual Solicitation <strong>of</strong> A Child 6 4 66.7% 7 2 28.6%Sexual Solicitation <strong>of</strong> A Child 0 0 0.0% 4 1 25.0%Simul Poss <strong>of</strong> Drugs/Firearm 3 1 33.3% 13 2 15.4%Stalking 1 1 100.0% 2 0 0.0%Tampering With Physical Evidence 4 2 50.0% 2 2 100.0%Terrioristic Act 23 10 43.5% 32 12 37.5%Terroristic Threatening 1st Deg 104 60 57.7% 78 43 55.1%Theft By Receiving 242 153 63.2% 267 154 57.7%Theft <strong>of</strong> Leased Property 10 3 30.0% 5 1 20.0%Theft <strong>of</strong> Prop Lost, Mislaid, Del 1 1 100.0% 0 0.0%Theft <strong>of</strong> Property 1379 864 62.7% 905 509 56.2%Theft <strong>of</strong> Public Benefits 1 1 100.0% 3 1 33.3%Theft <strong>of</strong> Services 2 2 100.0% 3 1 33.3%Trans, Distr. Mat.Deplctg Child 2 0.0% 2 0 0.0%Unlawful Copy/Sale <strong>of</strong> Record 1 0 0.0% 0 0 0.0%Use <strong>of</strong> Anothers Prop for Crime 0 0 0.0% 2 0 0.0%Use <strong>of</strong> Communication Facility 1 1 100.0% 0 0.0%Viol <strong>of</strong> a Minor 1st Degree 0 0 0.0% 2 0 0.0%Viol Omb DWI Act 4th Offense 70 23 32.9% 95 35 36.8%Violation <strong>of</strong> Medicaid Fraud AC 1 0 0.0% 0 0 0.0%Violation <strong>of</strong> Minor - 1st Degree 1 0 0.0% 0 0 0.0%Violation <strong>of</strong> Minor - 2nd Degree 4 2 50.0% 0 0 0.0%Wife Battering 1st Degree 1 0 0.0% 0 0 0.0%Worker's Comp Fraud 0 0 0.0% 1 0 0.0%
<strong>2003</strong> <strong>and</strong> <strong>2004</strong> <strong>Recidivism</strong> <strong>Study</strong>(Addendum) 14