Night Vision Device Market exhibit a growth of CAGR 7% through 2020
Night Vision Devices Market Analysis:By Type (Night Vision Goggles, Night Vision Monocular, Night Vision Binocular); Components (Image Intensifier Tubes, Micro Channel Plates); Application (Military, Security, Surveillance, Search and Rescue) - Forecast (2015 -2020) Request for Sample Data / Brochure: http://industryarc.com/pdfdownload.aspx?id=1286
Night Vision Devices Market Analysis:By Type (Night Vision Goggles, Night Vision Monocular, Night Vision Binocular); Components (Image Intensifier Tubes, Micro Channel Plates); Application (Military, Security, Surveillance, Search and Rescue) - Forecast (2015 -2020)
Request for Sample Data / Brochure:
http://industryarc.com/pdfdownload.aspx?id=1286
- No tags were found...
You also want an ePaper? Increase the reach of your titles
YUMPU automatically turns print PDFs into web optimized ePapers that Google loves.
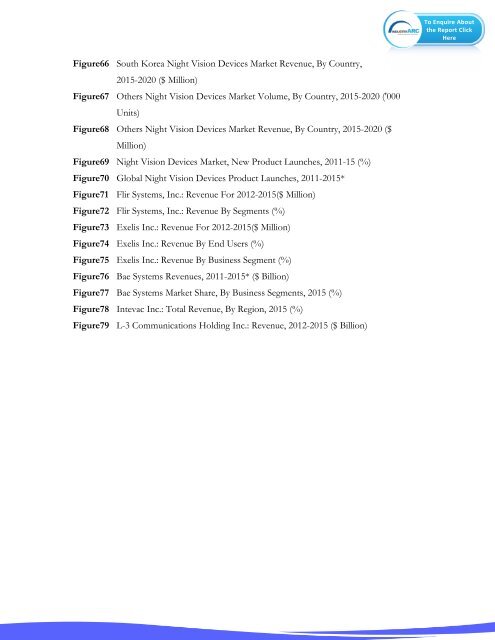
To Enquire Aboutthe Report ClickHereFigure66 South Korea <strong>Night</strong> <strong>Vision</strong> <strong>Device</strong>s <strong>Market</strong> Revenue, By Country,2015-<strong>2020</strong> ($ Million)Figure67 Others <strong>Night</strong> <strong>Vision</strong> <strong>Device</strong>s <strong>Market</strong> Volume, By Country, 2015-<strong>2020</strong> ('000Units)Figure68 Others <strong>Night</strong> <strong>Vision</strong> <strong>Device</strong>s <strong>Market</strong> Revenue, By Country, 2015-<strong>2020</strong> ($Million)Figure69 <strong>Night</strong> <strong>Vision</strong> <strong>Device</strong>s <strong>Market</strong>, New Product Launches, 2011-15 (%)Figure70 Global <strong>Night</strong> <strong>Vision</strong> <strong>Device</strong>s Product Launches, 2011-2015*Figure71 Flir Systems, Inc.: Revenue For 2012-2015($ Million)Figure72 Flir Systems, Inc.: Revenue By Segments (%)Figure73 Exelis Inc.: Revenue For 2012-2015($ Million)Figure74 Exelis Inc.: Revenue By End Users (%)Figure75 Exelis Inc.: Revenue By Business Segment (%)Figure76 Bae Systems Revenues, 2011-2015* ($ Billion)Figure77 Bae Systems <strong>Market</strong> Share, By Business Segments, 2015 (%)Figure78 Intevac Inc.: Total Revenue, By Region, 2015 (%)Figure79 L-3 Communications Holding Inc.: Revenue, 2012-2015 ($ Billion)


