Mappable data - Making Maps
Mappable data - Making Maps
Mappable data - Making Maps

You also want an ePaper? Increase the reach of your titles
YUMPU automatically turns print PDFs into web optimized ePapers that Google loves.
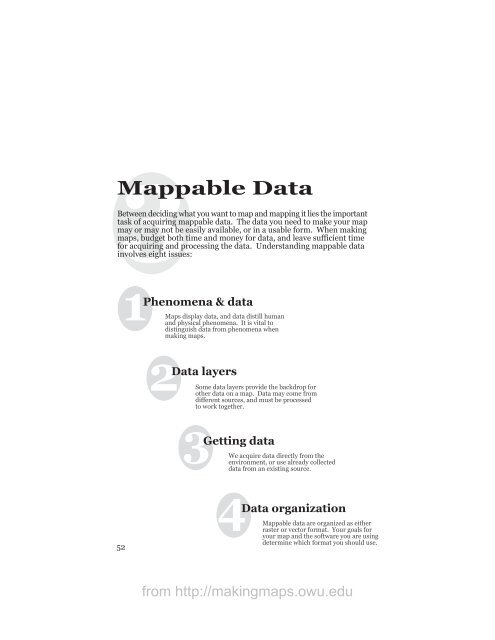
3<strong>Mappable</strong> DataBetween deciding what you want to map and mapping it lies the importanttask of acquiring mappable <strong>data</strong>. The <strong>data</strong> you need to make your mapmay or may not be easily available, or in a usable form. When makingmaps, budget both time and money for <strong>data</strong>, and leave sufficient timefor acquiring and processing the <strong>data</strong>. Understanding mappable <strong>data</strong>involves eight issues:1Phenomena & <strong>data</strong><strong>Maps</strong> display <strong>data</strong>, and <strong>data</strong> distill humanand physical phenomena. It is vital todistinguish <strong>data</strong> from phenomena whenmaking maps.2Data layersSome <strong>data</strong> layers provide the backdrop forother <strong>data</strong> on a map. Data may come fromdifferent sources, and must be processedto work together.3Getting <strong>data</strong>We acquire <strong>data</strong> directly from theenvironment, or use already collected<strong>data</strong> from an existing source.524Data organization<strong>Mappable</strong> <strong>data</strong> are organized as eitherraster or vector format. Your goals foryour map and the software you are usingdetermine which format you should use.from http://makingmaps.owu.edu
5Quantifying <strong>data</strong>Data can be qualitative or quantitative, andthere are several different kinds of each.The level of quantification will shape 5howyou symbolize your <strong>data</strong>.6Transforming <strong>data</strong>Common processing of <strong>data</strong> makes themmore mappable, including averages,densities, and ratios.7Data accuracyAccuracy is complicated! There are manyaspects of <strong>data</strong> accuracy you must assesswhen working with mappable <strong>data</strong>.8Digital <strong>data</strong> and GISDigital <strong>data</strong> require understandingissues of meta<strong>data</strong> and copyright.53from http://makingmaps.owu.edu
1Phenomena & <strong>data</strong>Phenomena are all the stuff out in the real world. Data capturespecific phenomena. Keep in mind that maps do not directlydisplay phenomena: they display <strong>data</strong>. Some maps are designedto mimic phenomena, and other maps are designed to mimicthe <strong>data</strong>. The surface map (below) shows temperature in amanner that mimics the phenomena. The population map(bottom) reveals more about the <strong>data</strong> (one value for each county)than the phenomena (people are not evenly spaced in a county).Phenomenon: temperature is foundeverywhere in varying degree.Data: known temperatures at a fewlocations.Map: shows semicontinuous changein temperatures, extrapolatedfrom known temperatures at afew locations.Comment: map suggests thephenomenon of temperature.Phenomenon: people in Utah (low to high).Data: U.S. Census count of how manypeople are in each county.Map: map may suggest an even spreadof people throughout each county.Comment: map displays the characterof the <strong>data</strong> (total number by county)rather than the phenomenon (wherepeople actually live).54from http://makingmaps.owu.edu
2Data layersSome <strong>data</strong> layers provide context and reference for other <strong>data</strong>layers on a map. Road and municipal boundary <strong>data</strong> may serveas the backdrop on a map showing variations in zoning in atown (created for a meeting about proposed zoning changes).In this case the zoning <strong>data</strong> are of most importance, and theroad and boundary <strong>data</strong> are included to help understand thezoning <strong>data</strong>. Data layers often come from different sources, andcoordinate systems and projection may have to be adjusted forthe <strong>data</strong> to work together.Poor <strong>data</strong> choice & design:Well Inspections, 2000Clarke Co., MNMap intent: to show well inspectionsfor 2000 and whether they passedinspection for a county commissioners’meeting.Vital <strong>data</strong>: well locations and statusof the well inspections.PassedNot PassedMinor RoadState RoadInterstate Hwy.Township BoundaryGood <strong>data</strong> choice & design:Well Inspections, 2000Clarke Co., MNPassedNot PassedState RoadInterstate Hwy.Township BoundaryBackground <strong>data</strong>: roads, county outline,and township boundaries.Problem: background <strong>data</strong> visually overwhelmthe vital well <strong>data</strong>; too manyroads, and the river (which seems tobe related to well failure) is missing.Data and design adjustments: themap needs to effectively show thewell inspection <strong>data</strong>. Data layers whichdo not help understand the well <strong>data</strong>,such as minor roads, can be removed.Data which do help to understand thewell inspection <strong>data</strong>, such as rivers inthis case, need to be included. Other<strong>data</strong> can be redesigned to be lessnoticeable, such as the townshipboundaries and roads.55from http://makingmaps.owu.edu