TABLE B—77.—Business formation and business failures, 1929-68Business failures *Amount of currentindex NewNumber of failures liabilities (millionsof net businessof dollars)Year or month business incorporationnessLiability sizeLiability sizeBusi-formation(1957-59 = (number)rate 2failureclassclass100)TotalTotalUnder$100,000$100,000andUnder$100,000over$100,000andover1929 .. .103.9 22,909 22,165 744 483.3 261.5 221.81930121.6 26,355 25,408 947 668.3 303.5 364.81931133.4 28,285 27,230 1,055 736.3 354.2 382.21932154.1 31,822 30,197 1 625 928.3 432.6 495.71933 3100.3 19,859 18,880 979 457.5 215.5 242.0193461.1 12,091 11,421 670 334.0 138.5 195.41935 . _61.7 12,244 11,691 553 310.6 135.5 175.1193647.8 9,607 9,285 322 203.2 102.8 100.4193745.9 9,490 9,203 287 183.3 101.9 81.4193861.1 12,836 12,553 283 246.5 140.1 106.41939 3 _ . . .69.6 14,768 14,541 227 182.5 132.9 49.7194063.0 13,619 13,400 219 166.7 119.9 46.8194154.5 11,848 11,685 163 136.1 100.7 35.4194244.6 9,405 9,282 123 100.8 80.3 20.5194316.4 3,221 3,155 66 45.3 30.2 15.119446.5 1,222 1,176 46 31.7 14.5 17.119454.2 809 759 50 30.2 11.4 18.81946132,916 5.2 1,129 1,002 127 67.3 15.7 51.61947 .112,638 14.3 3,474 3,103 371 204.6 63.7 140.91948123.1 96,101 20.4 5,250 4,853 337 234.6 93.9 140.7194996.7 85,491 34.4 9,246 8,708 538 308.1 161.4 146.71950102.3 92,925 34.3 9,162 8,746 416 248.3 151.2 97.11951.102.8 83,649 30.7 8,058 7,626 432 259.5 131.6 128.01952 . 108.0 92,819 28.7 7,611 7,081 530 283.3 131.9 151.41953103.5 102,545 33.2 8,862 8,075 787 394.2 167.5 226.6195499.8 117,164 42.0 11,086 10,226 860 462.6 211.4 251.21955107.6 139,915 41.6 10,969 10,113 856 449.4 206.4 243.01956103.2 141,163 48.0 12,686 11,615 1,071 562.7 239.8 322.9195798.3 137,112 51.7 13,739 12,547 1,192 615.3 267.1 348.2195897.1 150,781 55.9 14,964 13,499 1,465 728.3 297.6 430.71959104.6 193,067 51.8 14,053 12,707 1,346 692.8 278.9 413.91960 1 ... 99.8 182,713 57.0 15,445 13,650 1,795 938.6 327.2 611.4196195.4 181,535 64.4 17,075 15,006 2,069 1,090.1 370.1 720.01962 .98.0 182,057 60.8 15,782 13,772 2,010 1,213.6 346.5 867.11963 . 100.6 186,404 56.3 14,374 12,192 2,182 1,352.6 321.0 1,031.61964104.5 197,724 53.2 13,501 11,346 2 155 1,329.2 313.6 1,015.61965106.0 203,797 53.3 13,514 11,340 2,174 1,321.7 321.7 1,000.01966105.5 200,010 51.6 13,061 10,833 2,228 1,385.7 321.5 1,064.11967107.7 206,569 49.0 12,364 10,144 2,220 1,265.2 297.9 967.3196838.6 9,636 7,829 1,807 941.0 241.1 699.9Seasonally adjusted1967: Jan....102.2 16,703 54.9 1,191 1,003 188 108.2 30.2 77.9Feb103.2 15,987 57.1 1,216 995 221 113.5 29.3 84.1Mar103.3 16,244 49.7 1,216 981 235 119.3 28.7 90.6Apr103.7 16,760 52.1 1,160 966 194 103,8 27.8 76.1May105.0 17,627 48.6 1,100 917 183 93.4 27.1 66.3June108.1 17,799 48.6 1,047 850 197 104.6 24.7 80.0July108.4 16,300 43.2 843 708 135 72.6 20.8 51.7Aug110.7 17,674 49.3 1,017 793 224 108.9 23.7 85.2Sept110.3 18,118 49.1 913 758 155 93.9 22.2 71.8Oct110.6 18,000 47.4 949 782 167 81.6 22.5 59.1Nov112.7 18,403 42.2 881 718 163 70.0 21.3 48.7Dec113.8 18,168 43.2 831 673 158 195.4 19.6 175.81968: Jan113.5 17,223 38.2 844 651 193 104.5 20.4 84.1Feb114.5 18,014 37.5 832 682 150 79.6 21.4 58.2Mar113.6 17,974 44.3 1,021 839 182 88.6 26.1 62.5Apr113.9 18,659 43.5 1,003 833 170 80.1 24.8 55,3May115.1 18,796 40.9 909 707 202 91.4 21.9 69.5June..,116.2 19,197 36.9 751 616 135 74.7 18.6 56. CJuly119.1 19,530 41.0 810 646 164 90.3 19.2 71.1Aug119.7 20,053 36.5 734 607 127 65.8 18.3 47.5Sept122.1 21,237 40.3 705 598 107 58.7 19.1 39.5oct.:.:125.2 21,721 37.5 768 614 154 65.4 18.6 46.8Nov124.6 20,850 35.7 696 569 127 58.7 17.9 40.8Dec29.9 563 467 96 83.4 14.8 68.61 Commercial and industrial failures only. Excludes failures of banks and railroads and, beginning 1933, of real estate,insurance, holding, and financial companies, steamship lines, travel agencies, etc.2 Failure rate per 10,000 listed enterprises.3 Series revised; not strictly comparable with earlier data.Sources: Department of Commerce (Bureau of the Census) and Dun & Bradstreet, Inc.3l6
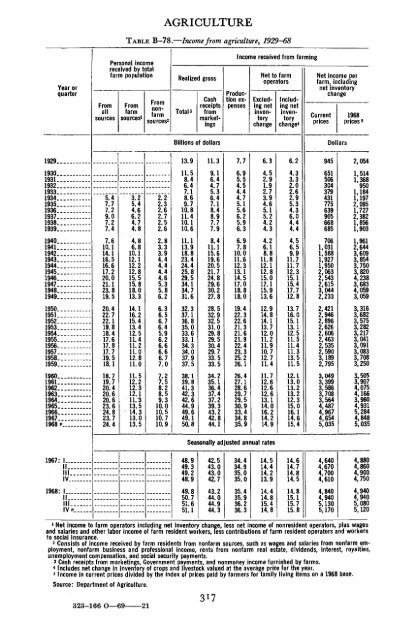
AGRICULTURETABLE B—78.—Incomefrom agriculture, 1929-68Year orquarterFromallsourcesPersonal incomereceived by totalfarm populationFromfarmsources 1Fromnonfarmsources 2Realized grossTotalsIncome received from farmingNet to farmoperatorsCashreceiptsfrommarketingsProductionexpensesExcludingnetinventorychangeIncludingnetinventorychange 4Net income perfarm, includingnet inventorychangeCurrentprices1968prices 8Billions of dollarsDollars1929 __1930 .1931193219331934 . ...193519361937193819395.47.77.29.07.27.43.25.44.66.24.74.82.22.32.62.72.52.613.911.58.46.47.18.69.710.811.410.110.611.39.16.44.75.36.47.18.48.97.77.97.76.95.54.54.44.75.15.66.25.96.36.34.52.91.92.73.94.65.15.24.24.36.24.33.32.02.62.95.34.36.04.44.49456515063043794317756399056686852,0541,5141,3689501,1841,1972,0951,7272,3821,8561,90319401941194219431944.194619471948.194919501951.1952.19531954.195519561957.19581959.19601961196219631964.19651966.19671968 » _.__7.610.114.116.516.617.220.021.123.819.520.422.722.119.818.417.617.817.719.518.118.719.720.420.620.623.624.823.724.44.86.810.112.112.212.815.515.818.013.314.116.215.4.13.412.511.411.211.012.811.011.512.212.312.111.313.514.313.013.52.83.33.94.44.44.44.65.35.86.26.36.56.76.45.96.26.66.66.77.07.27.58.28.59.310.010.510.710.911.113.918.823.424.425.829.534.134.731.632.337.136.835.033.633.134.334.037.937.538.139.841.342.342.644.949.649.150.88.411.115.619.620.521.724.829.630.227.828.532.932.531.029.829.530.429.733.533.534.235.136.437.437.239.343.242.844.16.97.810.011.612.313.114.517.018.818.019.422.322.621.321.621.922.423.325.226.126.427.128.629.729.530.933.434.835.94.26.18.811.812.112.815.017.115.913.612.914.814.113.712.011.211.910.712.711.411.712.612.612.613.114.016.214.214.94.56.59.911.711.712.315.115.417.712.813.716.015.113.112.511.511.411.313.511.512.113.013.213.212.315.016.114.615.47061,0311,5881,9271,9502,0632,5432,6153,0442,2332,4212,9462,8962,6262,6062,4632,5352,5903,1892,7953,0493,3993,5863,7083,5644 4874,9674,6545,0351,9612,6443,6093,8543,7503,8204,2383,6834,0593,0593,3163,6823,5753,2823,2173,0413,0913,0833,7083,2503,5053,9074,0754,1663,9604,9315,2844,8485,035Seasonally adjusted annual rates1967: 1 ________IIIIIIV1968: 1IIIIIIV v48.949.349.248.949.850.751.651.142.543.043.042.743.244.044.944.334.434.935.035.035.435.936.236.314.514.414.213.914 414.815.414.814.614.714.814.514.815.115.715.84,6404,6704,7004,6104,8404,9405,1305,1704,8804,8604,9004,7504,9404,9405,0805,1201 Net income to farm operators including net inventory change, less net income of nonresident operators, plus wagesand salaries and other labor income of farm resident workers, less contributions of farm resident operators and workersto social insurance.2 Consists of income received by farm residents from nonfarm sources, such as wages and salaries from nonfarm employment,nonfarm business and professional income, rents from nonfarm real estate, dividends, interest, royalties,unemployment compensation, and social security payments.3 Cash receipts from marketings, Government payments, and nonmoney income furnished by farms.4 Includes net change in inventory of crops and livestock valued at the average price for the year.5 Income in current prices divided by the index of prices paid by farmers for family living Items on a 1968 base.Source: Department of Agriculture.323-166 O—69 -21317
- Page 1:
ECONOMIC REPORTOF THE PRESIDENTMM '
- Page 5 and 6:
CONTENTSPageECONOMIC REPORT OF THE
- Page 7:
ECONOMIC REPORTOF THE PRESIDENT
- Page 10 and 11:
• We must find a way of combining
- Page 12 and 13:
third. Only 5 percent of manufactur
- Page 14 and 15:
• It provides funds for our conti
- Page 16 and 17:
THE ROADS TO AVOIDWe stand at a cri
- Page 18 and 19:
cussion on the wage-price problem.
- Page 20 and 21:
AFTER VIETNAMDespite some encouragi
- Page 22 and 23:
Myths about gold die slowly. But pr
- Page 24 and 25:
QUALITY OF THE ENVIRONMENTMore than
- Page 26 and 27:
is a staggering $5 billion. Recent
- Page 28 and 29:
the Business Sector is a promising
- Page 30 and 31:
impatient. This feeling is in the g
- Page 33:
LETTER OF TRANSMITTALCOUNCIL OF ECO
- Page 36 and 37:
CHAPTER 2. POLICIES FOR BALANCED EX
- Page 38 and 39:
TablesPage7. Measures of Economic A
- Page 40 and 41:
The remainder of this chapter revie
- Page 42 and 43:
With higher employment and more rap
- Page 44 and 45:
FISCAL POLICYThe economic backgroun
- Page 46 and 47:
Federal Reserve policy continued to
- Page 48 and 49:
over $10 billion (annual rate) from
- Page 50 and 51:
foi> new houses. Only in the fourth
- Page 52 and 53:
WAGES AND COMPENSATIONSpurred by ri
- Page 54 and 55:
Output per manhour in the private e
- Page 56 and 57:
TABLE 6.—United States balance of
- Page 58 and 59:
all of which stimulated metal impor
- Page 60 and 61:
e to prolong the slack performance
- Page 62 and 63:
desired, at a considerably more mod
- Page 64 and 65:
eludes other modest increases in pu
- Page 66 and 67:
investment should be another source
- Page 68 and 69:
would not be produced, and some res
- Page 70 and 71:
countries, our competitive position
- Page 72 and 73:
in the composition of the working-a
- Page 74 and 75:
TABLE 7.—Measures of economic act
- Page 76 and 77:
assist such workers, who often suff
- Page 78 and 79:
and hence consumer expenditures, by
- Page 80 and 81:
THE RECORD OF POLICYis the performa
- Page 82 and 83:
Chart 7Selected Interest RatesPERCE
- Page 84 and 85:
policy can be implemented either th
- Page 86 and 87:
stronger than had been anticipated,
- Page 88 and 89:
allocation of resources between Fed
- Page 90 and 91:
ADJUSTING TO NEW DEVELOPMENTSUnder
- Page 92 and 93:
may also be market imperfections or
- Page 94 and 95:
cases involving more than half the
- Page 96 and 97:
y keeping variations in the rate of
- Page 98 and 99:
There is, of course, good reason to
- Page 100 and 101:
Chapter 3Price Stability in a High
- Page 102 and 103:
increases exercises much less disci
- Page 104 and 105:
price stability. The relationship b
- Page 106 and 107:
TABLE 10.—Changes in employment,
- Page 108 and 109:
or metropolitan area. Greater recip
- Page 110 and 111:
stable employment might also modera
- Page 112 and 113:
The New Careers Program, administer
- Page 114 and 115:
industries of critical economic imp
- Page 116 and 117:
Legislative Achievements and Propos
- Page 118 and 119:
Natural Gas. This important fuel ha
- Page 120 and 121:
Competitive ProcurementBecause comp
- Page 122 and 123:
nounced. Fifteen percent of the far
- Page 124 and 125:
pursuits. If these interindustry sh
- Page 126 and 127:
Recognizing this situation, the Cou
- Page 128 and 129:
merous structural improvements, and
- Page 130 and 131:
ECONOMIC GROWTH AND WORLD TRADEIn t
- Page 132 and 133:
The GATT rules are interpreted as p
- Page 134 and 135:
technical assistance from both publ
- Page 136 and 137:
TYPES OF RESERVESExisting stocks of
- Page 138 and 139:
Chart 9World Trade and ReservesBILL
- Page 140 and 141:
time. At different times in 1968, t
- Page 142 and 143:
eligible official sterling reserves
- Page 144 and 145:
are. In part, this is because major
- Page 146 and 147:
There are limits on the willingness
- Page 148 and 149:
tions could occur if exemptions wer
- Page 150 and 151:
method had to be found to ensure th
- Page 152 and 153:
associated with parity adjustments
- Page 154 and 155:
to buyers in world markets. Imports
- Page 156 and 157:
chipping away at tariffs and other
- Page 158 and 159:
DEFINITION OF POVERTYEven a rough m
- Page 160 and 161:
Chart 10Number of Poor Persons and
- Page 162 and 163:
the annual decline in the number of
- Page 164 and 165:
y providing more jobs for elderly i
- Page 166 and 167:
poor grow only at the same pace as
- Page 168 and 169:
EDUCATION AND POVERTYEducation can
- Page 170 and 171:
The rapidly growing public sector h
- Page 172 and 173:
public assistance should not be det
- Page 174 and 175:
of the food stamp program will expa
- Page 176 and 177:
mostly domestics, agricultural empl
- Page 178 and 179:
enefits must be provided to middle-
- Page 180 and 181:
Total Employment. Most jobs are in
- Page 182 and 183:
Three considerations bear on the ch
- Page 184 and 185:
velopment activities. Loans, grants
- Page 187:
REPORT TO THE PRESIDENTFROM THE CAB
- Page 191:
CONTENTSPageSUMMARY OF FINDINGS 189
- Page 194 and 195:
Chart 1Federal Purchases for Nation
- Page 196 and 197:
As revenues expand in a growing pea
- Page 198 and 199:
1. The armed services would decline
- Page 200 and 201:
Chart 3Illustrative Paths of Defens
- Page 202 and 203:
3. For the same reasons, the Depart
- Page 204 and 205:
the Cabinet Committee on Price Stab
- Page 206 and 207:
lion at 1968 prices, as shown in Ch
- Page 208 and 209:
Maintaining Standards Under Cash Be
- Page 210 and 211:
TABLE 3.—Illustrative new program
- Page 212 and 213:
An alternative major program initia
- Page 214 and 215:
separations averaged about 470,000
- Page 216 and 217:
financial base of the system. And m
- Page 219:
Appendix AREPORT TO THE PRESIDENT O
- Page 223 and 224:
Report to the President on the Acti
- Page 225 and 226:
Continuing its practice of asking l
- Page 227:
Appendix BSTATISTICAL TABLES RELATI
- Page 230 and 231:
Production and business activity:Pa
- Page 233 and 234:
NATIONAL INCOME OR EXPENDITURETABLE
- Page 235 and 236:
TABLE B-2.—Gross national product
- Page 237 and 238:
TABLE B-3.—Implicit price deflato
- Page 239 and 240:
TABLE B-5.—Gross national product
- Page 241 and 242:
TABLE B—6.—Gross national produ
- Page 243 and 244:
TABLE B-8.—Gross national product
- Page 245 and 246:
TABLE B-10.—Personal consumption
- Page 247 and 248:
Year orquarter192919301931193219331
- Page 249 and 250:
TABLE B-14.—Relation of national
- Page 251 and 252:
TABLE B-16.— Total and per capita
- Page 253 and 254:
TABLE B-17.—Sources of personal i
- Page 255 and 256:
TABLE B-19.—Saving by individuals
- Page 257 and 258:
POPULATION, EMPLOYMENT, WAGES, ANDP
- Page 259 and 260:
TABLE B-22.—Noninstitutional popu
- Page 261 and 262:
TABLE B-24.—Selected unemployment
- Page 263 and 264:
TABLE B-26.— Unemployment insuran
- Page 265 and 266:
TABLE B-27.—Wage and salary worke
- Page 267 and 268:
TABLE B-29.—Average gross hourly
- Page 269 and 270:
TABLE B-31.—Average weekly hours
- Page 271 and 272: TABLE B—33.—Average weekly earn
- Page 273 and 274: PRODUCTION AND BUSINESS ACTIVITYTAB
- Page 275 and 276: TABLE B—37.—Industrial producti
- Page 277 and 278: TABLE B-39.—Business expenditures
- Page 279 and 280: TABLE B-40.—New construction acti
- Page 281 and 282: TABLE B-41.—New housing starts an
- Page 283 and 284: TABLE B-4r3.—Manufacturers' shipm
- Page 285 and 286: PRICESTABLE B^-5.—Consumer price
- Page 287 and 288: TABLE B-47.—Consumer price indexe
- Page 289 and 290: TABLE B-48.— Wholesale price inde
- Page 291 and 292: TABLE B-49.—Wholesale price index
- Page 293 and 294: 1929 5.1930 5.1931 5.1932 ».1933 5
- Page 295 and 296: TABLE B-53.—Federal Reserve Bank
- Page 297 and 298: TABLE B-54.—Bond yields and inter
- Page 299 and 300: TABLE B—56.—Instalment credit e
- Page 301 and 302: TABLE B-58.—Mortgage debt outstan
- Page 303 and 304: GOVERNMENT FINANCETABLE B-60.—Fed
- Page 305 and 306: TABLE B-61.—Federal budget receip
- Page 307 and 308: TABLE B-63.—Receipts and expendit
- Page 309 and 310: End of year ormonth1939 ._..1940_19
- Page 311 and 312: TABLE B—67.—Receipts and expend
- Page 313 and 314: TABLE B-69.—State and local gover
- Page 315 and 316: TABLE B—71.—Sales, profits, and
- Page 317 and 318: TABLE B—72.—Relation of profits
- Page 319 and 320: TABLE B—74.—Current assets and
- Page 321: TABLE B-76.—Common stock prices,
- Page 325 and 326: TABLE B-80.—Farm population, empl
- Page 327 and 328: TABLE B-81.—Indexes of prices rec
- Page 329 and 330: TABLE B-83.—Comparative balance s
- Page 331 and 332: TABLE B-84.—United States balance
- Page 333 and 334: TABLE B-86.—United States merchan
- Page 335 and 336: TABLE B-88.—International reserve
- Page 337 and 338: TABLE B-90.—Price changes in inte