Stat 257.01 Fall 2004 Assignment #2 (Selected) Solutions (3.2 ...
Stat 257.01 Fall 2004 Assignment #2 (Selected) Solutions (3.2 ...
Stat 257.01 Fall 2004 Assignment #2 (Selected) Solutions (3.2 ...

You also want an ePaper? Increase the reach of your titles
YUMPU automatically turns print PDFs into web optimized ePapers that Google loves.
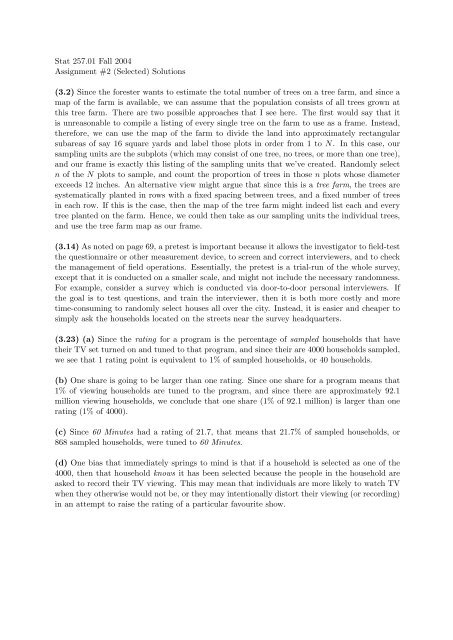
<strong>Stat</strong> <strong>257.01</strong> <strong>Fall</strong> <strong>2004</strong><strong>Assignment</strong> <strong>#2</strong> (<strong>Selected</strong>) <strong>Solutions</strong>(<strong>3.2</strong>) Since the forester wants to estimate the total number of trees on a tree farm, and since amap of the farm is available, we can assume that the population consists of all trees grown atthis tree farm. There are two possible approaches that I see here. The first would say that itis unreasonable to compile a listing of every single tree on the farm to use as a frame. Instead,therefore, we can use the map of the farm to divide the land into approximately rectangularsubareas of say 16 square yards and label those plots in order from 1 to N. In this case, oursampling units are the subplots (which may consist of one tree, no trees, or more than one tree),and our frame is exactly this listing of the sampling units that we’ve created. Randomly selectn of the N plots to sample, and count the proportion of trees in those n plots whose diameterexceeds 12 inches. An alternative view might argue that since this is a tree farm, the trees aresystematically planted in rows with a fixed spacing between trees, and a fixed number of treesin each row. If this is the case, then the map of the tree farm might indeed list each and everytree planted on the farm. Hence, we could then take as our sampling units the individual trees,and use the tree farm map as our frame.(3.14) As noted on page 69, a pretest is important because it allows the investigator to field-testthe questionnaire or other measurement device, to screen and correct interviewers, and to checkthe management of field operations. Essentially, the pretest is a trial-run of the whole survey,except that it is conducted on a smaller scale, and might not include the necessary randomness.For example, consider a survey which is conducted via door-to-door personal interviewers. Ifthe goal is to test questions, and train the interviewer, then it is both more costly and moretime-consuming to randomly select houses all over the city. Instead, it is easier and cheaper tosimply ask the households located on the streets near the survey headquarters.(<strong>3.2</strong>3) (a) Since the rating for a program is the percentage of sampled households that havetheir TV set turned on and tuned to that program, and since their are 4000 households sampled,we see that 1 rating point is equivalent to 1% of sampled households, or 40 households.(b) One share is going to be larger than one rating. Since one share for a program means that1% of viewing households are tuned to the program, and since there are approximately 92.1million viewing households, we conclude that one share (1% of 92.1 million) is larger than onerating (1% of 4000).(c) Since 60 Minutes had a rating of 21.7, that means that 21.7% of sampled households, or868 sampled households, were tuned to 60 Minutes.(d) One bias that immediately springs to mind is that if a household is selected as one of the4000, then that household knows it has been selected because the people in the household areasked to record their TV viewing. This may mean that individuals are more likely to watch TVwhen they otherwise would not be, or they may intentionally distort their viewing (or recording)in an attempt to raise the rating of a particular favourite show.
(<strong>3.2</strong>9) (a) The total that never smoked is 7213 + 2482 + 744 + 1878 = 12317. Hence, theproportion of those who never smoked that think their peers care a lot about staying away frommarijuana is 7213/12317 ≈ 0.59.(b) The total of current smokers is 857 + 1102 + 298 + 1312 = 3569. Hence, the proportionof current smokers who think their peers care a lot about staying away from marijuana is857/3569 ≈ 0.24.(c) The total that care a lot is 7213 + 2693 + 75 + 857 = 10838. Hence, the proportion of thosewho think their peers care a lot about staying away from marijuana that have never smoked is7213/10838 ≈ 0.67.(d) The total that don’t care is 1878+1550+119+1312 = 4859. Hence, the proportion of thosewho think their peers don’t care about staying away from marijuana that have never smoked is1878/4859 ≈ 0.39.(Note that these are the type of proportions that need to be computed when carrying out aChi-squared (χ 2 ) test.)(e) Non smokers care more about staying away from marijuana than current smokers (59%,24%, respectively). Also from (a) and (b), among those who care a lot about staying away frommarijuana, 59% were non smokers while 24% were current smokers.