dressing individuals
17&r=age
17&r=age
- No tags were found...

You also want an ePaper? Increase the reach of your titles
YUMPU automatically turns print PDFs into web optimized ePapers that Google loves.
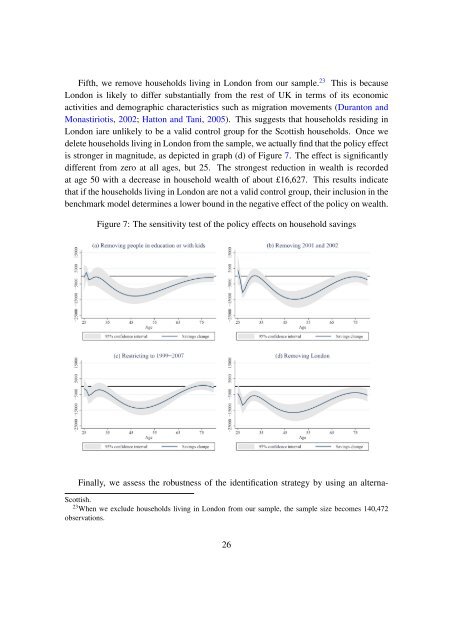
Fifth, we remove households living in London from our sample. 23 This is becauseLondon is likely to differ substantially from the rest of UK in terms of its economicactivities and demographic characteristics such as migration movements (Duranton andMonastiriotis, 2002; Hatton and Tani, 2005). This suggests that households residing inLondon iare unlikely to be a valid control group for the Scottish households. Once wedelete households living in London from the sample, we actually find that the policy effectis stronger in magnitude, as depicted in graph (d) of Figure 7. The effect is significantlydifferent from zero at all ages, but 25. The strongest reduction in wealth is recordedat age 50 with a decrease in household wealth of about £16,627. This results indicatethat if the households living in London are not a valid control group, their inclusion in thebenchmark model determines a lower bound in the negative effect of the policy on wealth.Figure 7: The sensitivity test of the policy effects on household savingsFinally, we assess the robustness of the identification strategy by using an alterna-Scottish.23 When we exclude households living in London from our sample, the sample size becomes 140,472observations.26