<strong>Low</strong> <strong>beneficial</strong> <strong>effects</strong> <strong>of</strong> <strong>short</strong> <strong>term</strong> <strong>anti<strong>diabetic</strong></strong> <strong>diet</strong> …II. MATERIALS AND METHODS2.1. Experimental Design. 30 White Wistar stra<strong>in</strong> <strong>rats</strong> <strong>of</strong> male gender, 4 months old at the start <strong>of</strong> theexperiment, were used. The animals were obta<strong>in</strong>ed from the animal facility <strong>of</strong> the Department <strong>of</strong> Physiology andBiochemistry <strong>of</strong> the Faculty <strong>of</strong> Natural Sciences and Mathematics, Skopje. Prior the experiment, they weregiven tap water and pellet <strong>diet</strong> (Filpaso, 52.11, Skopje, Republic <strong>of</strong> Macedonia). The components <strong>of</strong> thecommercial feed as listed by manufacturer were: crude fat m<strong>in</strong>. 5.7 % , crude prote<strong>in</strong>s m<strong>in</strong>imum 18 %,carbohydrates m<strong>in</strong>imum 60 %, fibre maximum 4.5%, ash maximum 8 %.Induction <strong>of</strong> diabetes <strong>in</strong> <strong>rats</strong> and Insul<strong>in</strong> <strong>treatment</strong> A s<strong>in</strong>gle i.p. <strong>in</strong>jection <strong>of</strong> 55 mg/kg streptozotoc<strong>in</strong>(Sigma Aldrich Chemie, GmbH, Deutschland) dissolved immediately before adm<strong>in</strong>istration <strong>in</strong> freshly prepared50 mM citrate buffer (pH 4.0) was given to STZ, STZ+Ins. and STZ+Diet <strong>rats</strong> on day 0. The <strong>in</strong>jections weregiven after 12 hours <strong>of</strong> food deprivation. Control animals received an equivalent volume <strong>of</strong> citrate buffer. Thegroup under <strong>in</strong>sul<strong>in</strong> <strong>treatment</strong> received subcutaneous <strong>in</strong>itial dose <strong>of</strong> 4 to 8U (Novo Rapid, Flex Pen, 2880Bagsvaerd, Denmark) followed by 1 to 2 U daily to obta<strong>in</strong> euglicemia. The <strong>diabetic</strong> and normal animals werekept <strong>in</strong> the cages separately and their body weight, the levels <strong>of</strong> serum glucose <strong>in</strong> all animals were measured andthen these quantities were compared.Dietary characteristics <strong>of</strong> Pur<strong>in</strong>a Veter<strong>in</strong>ary Diets® DCO® brand Can<strong>in</strong>e formula provides completeand balanced nutrition for ma<strong>in</strong>tenance <strong>of</strong> the adult dog and has been formulated to achieve the follow<strong>in</strong>gcharacteristics: High level <strong>of</strong> complex carbohydrates; Increased fibre <strong>in</strong>clud<strong>in</strong>g soluble fibre; Moderate total<strong>diet</strong>ary fat and calories and high omega 6:3 ratio. The components <strong>of</strong> the special Pur<strong>in</strong>a feed as listed bymanufacturer were: crude prote<strong>in</strong> m<strong>in</strong>imum 21%; crude fat m<strong>in</strong>imum 10%; crude fibre maximum. 10%;moisture maximum 12%; Carbohydrate maximum 46%. Chemical composition <strong>of</strong> the special feed: whole gra<strong>in</strong>corn, dried beet pulp, poultry by-product meal, corn gluten meal, pearled barley, animal fat preserved withmixed-tocopherols (form <strong>of</strong> Vitam<strong>in</strong> E), pea fibre, animal digest, calcium phosphate, dried whey, potassiumchloride, fish oil, salt, calcium carbonate, L-Lys<strong>in</strong>e monohydrochloride, chol<strong>in</strong>e chloride, Vitam<strong>in</strong> Esupplement, z<strong>in</strong>c sulphate, ferrous sulphate, niac<strong>in</strong>, manganese sulphate, Vitam<strong>in</strong> A supplement, calciumpantothenate, thiam<strong>in</strong>e mononitrate, copper sulphate, rib<strong>of</strong>lav<strong>in</strong> supplement, Vitam<strong>in</strong> B-12 supplement,pyridox<strong>in</strong>e hydrochloride, folic acid, Vitam<strong>in</strong> D-3 supplement, calcium iodide, biot<strong>in</strong>, menadione sodiumbisulphite complex (source <strong>of</strong> Vitam<strong>in</strong> K activity), sodium selenite. *15% - a source <strong>of</strong> fibre.Animals were divided <strong>in</strong>to 5 groups as follows:C -control group: control group <strong>of</strong> <strong>rats</strong> (n=6)Diet - group: healthy <strong>rats</strong> with <strong>diet</strong> food ad libitum (6);STZ - group: <strong>rats</strong> with <strong>in</strong>duced diabetes mellitus <strong>–</strong> <strong>diabetic</strong> control (6);STZ+Diet - group: <strong>rats</strong> with <strong>in</strong>duced diabetes mellitus and <strong>diet</strong> food (6);STZ+Ins. - group: <strong>rats</strong> with <strong>in</strong>duced diabetes mellitus and <strong>in</strong>sul<strong>in</strong> (6).All procedure was <strong>in</strong> accordance with National Institutes <strong>of</strong> Health guidel<strong>in</strong>es for the care and use <strong>of</strong>experimental animals. At overnight fast <strong>of</strong> 12 hours, the animals were sacrificed by exsaqu<strong>in</strong>ation underketam<strong>in</strong>e: xylaz<strong>in</strong>e anaesthesia (90 mg/kg i.p. and 10 mg/kg, i.p. respectively). For plasma separation, bloodsamples were collected <strong>in</strong>to tubes with anticoagulant solution. Tissue samples were removed immediately, flashfrozen, measured and stored <strong>in</strong> <strong>–</strong>80ºC until further analysis. Liver tissue, heart, aorta and testes were harvestedbetween 10-12 AM, except for those animals, which died dur<strong>in</strong>g the experiment.2.1.1Plasma biochemical assay. Biochemical parameters were measured <strong>in</strong> hepar<strong>in</strong>ised plasma <strong>of</strong> <strong>rats</strong>at the start and the end <strong>of</strong> the experiment by a photometric cl<strong>in</strong>ical chemistry analyser (Olympus, AU 400) us<strong>in</strong>grout<strong>in</strong>e cl<strong>in</strong>ical chemical assays. Blood samples were collected <strong>in</strong>to tubes after an overnight fast <strong>of</strong> 12 hours,and centrifuged at 1450 × g at 4ºC for 10 m<strong>in</strong>utes.2.1.2Tissue antioxidant analysis. Superoxide dismutase activity Liver SOD (EC 1.15.1.1) activity wasassayed with a method <strong>of</strong> W<strong>in</strong>terbourn and co workers (1975) [10], with SOD de<strong>term</strong><strong>in</strong>ation kit (RA20408,Fluka, Biochemika, Ste<strong>in</strong>heim, Germany). Glutathione reductase activity Liver glutathione reductase (GSSG-Red; EC 1.6.4.2) activity was assayed with a glutathione reductase assay kit (GRSA 114K4000, Sigma-Aldrich,Ste<strong>in</strong>heim, Germany) accord<strong>in</strong>g to the method <strong>of</strong> Dolph<strong>in</strong> et al. (1989) adopted by Garcia-Alfonso et al. (1993).Tissue glutathione content Liver glutathione (GSH) content was measured with a glutathione assay kit (CS0260,Sigma-Aldrich, Ste<strong>in</strong>heim, Germany) accord<strong>in</strong>g to method described by Akerboom et al. (1981).2.2.Prote<strong>in</strong> quantification. The prote<strong>in</strong> content <strong>in</strong> different tissues was measured accord<strong>in</strong>g to <strong>Low</strong>ry etal (1951).29
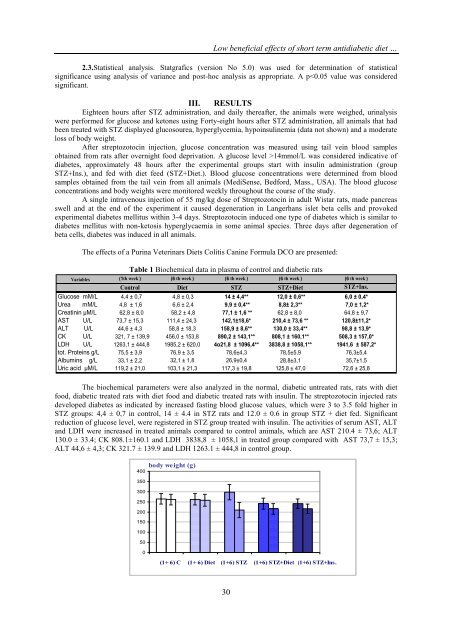
<strong>Low</strong> <strong>beneficial</strong> <strong>effects</strong> <strong>of</strong> <strong>short</strong> <strong>term</strong> <strong>anti<strong>diabetic</strong></strong> <strong>diet</strong> …2.3.Statistical analysis. Statgrafics (version No 5.0) was used for de<strong>term</strong><strong>in</strong>ation <strong>of</strong> statisticalsignificance us<strong>in</strong>g analysis <strong>of</strong> variance and post-hoc analysis as appropriate. A p14mmol/L was considered <strong>in</strong>dicative <strong>of</strong>diabetes, approximately 48 hours after the experimental groups start with <strong>in</strong>sul<strong>in</strong> adm<strong>in</strong>istration (groupSTZ+Ins.), and fed with <strong>diet</strong> feed (STZ+Diet.). Blood glucose concentrations were de<strong>term</strong><strong>in</strong>ed from bloodsamples obta<strong>in</strong>ed from the tail ve<strong>in</strong> from all animals (MediSense, Bedford, Mass., USA). The blood glucoseconcentrations and body weights were monitored weekly throughout the course <strong>of</strong> the study.A s<strong>in</strong>gle <strong>in</strong>travenous <strong>in</strong>jection <strong>of</strong> 55 mg/kg dose <strong>of</strong> Streptozotoc<strong>in</strong> <strong>in</strong> adult Wistar <strong>rats</strong>, made pancreasswell and at the end <strong>of</strong> the experiment it caused degeneration <strong>in</strong> Langerhans islet beta cells and provokedexperimental diabetes mellitus with<strong>in</strong> 3-4 days. Streptozotoc<strong>in</strong> <strong>in</strong>duced one type <strong>of</strong> diabetes which is similar todiabetes mellitus with non-ketosis hyperglycaemia <strong>in</strong> some animal species. Three days after degeneration <strong>of</strong>beta cells, diabetes was <strong>in</strong>duced <strong>in</strong> all animals.The <strong>effects</strong> <strong>of</strong> a Pur<strong>in</strong>a Veter<strong>in</strong>ars Diets Colitis Can<strong>in</strong>e Formula DCO are presented:Table 1 Biochemical data <strong>in</strong> plasma <strong>of</strong> control and <strong>diabetic</strong> <strong>rats</strong>Variables (1th week ) (6 th week ) (6 th week ) (6 th week ) (6 th week )Control Diet STZ STZ+Diet STZ+Ins.Glucose mM/L 4,4 ± 0,7 4,8 ± 0,3 14 ± 4,4** 12,0 ± 0,6** 6,0 ± 0,4*Urea mM/L 4,8 ± 1,6 6,6 ± 2,4 9,9 ± 0,4** 8,8± 2,3** 7,0 ± 1,2*Creat<strong>in</strong><strong>in</strong> µM/L 62,8 ± 8,0 58,2 ± 4,8 77,1 ± 1,6 ** 62,8 ± 8,0 64,8 ± 9,7AST U/L 73,7 ± 15,3 111,4 ± 24,3 142,1±18,6* 210,4 ± 73,6 ** 120,8±11,2*ALT U/L 44,6 ± 4,3 58,8 ± 18,3 158,9 ± 8,6** 130,0 ± 33,4** 98,8 ± 13,9*CK U/L 321, 7 ± 139,9 456,0 ± 153,8 890,2 ± 143,1** 808,1 ± 160,1** 508,3 ± 157,0*LDH U/L 1263,1 ± 444,8 1985,2 ± 620,0 4o21,8 ± 1096,4** 3838,8 ± 1058,1** 1941,6 ± 587,2*tot. Prote<strong>in</strong>s g/L 75,5 ± 3,9 76,9 ± 3,5 78,6±4,3 78,5±5,9 76,3±5,4Album<strong>in</strong>s g/L 33,1 ± 2,2 32,1 ± 1,8 26,9±0,4 28,8±3,1 35,7±1,5Uric acid µM/L 119,2 ± 21,0 103,1 ± 21,3 117,3 ± 19,8 125,8 ± 47,0 72,6 ± 25,8The biochemical parameters were also analyzed <strong>in</strong> the normal, <strong>diabetic</strong> untreated <strong>rats</strong>, <strong>rats</strong> with <strong>diet</strong>food, <strong>diabetic</strong> treated <strong>rats</strong> with <strong>diet</strong> food and <strong>diabetic</strong> treated <strong>rats</strong> with <strong>in</strong>sul<strong>in</strong>. The streptozotoc<strong>in</strong> <strong>in</strong>jected <strong>rats</strong>developed diabetes as <strong>in</strong>dicated by <strong>in</strong>creased fast<strong>in</strong>g blood glucose values, which were 3 to 3.5 fold higher <strong>in</strong>STZ groups: 4,4 ± 0,7 <strong>in</strong> control, 14 ± 4.4 <strong>in</strong> STZ <strong>rats</strong> and 12.0 ± 0.6 <strong>in</strong> group STZ + <strong>diet</strong> fed. Significantreduction <strong>of</strong> glucose level, were registered <strong>in</strong> STZ group treated with <strong>in</strong>sul<strong>in</strong>. The activities <strong>of</strong> serum AST, ALTand LDH were <strong>in</strong>creased <strong>in</strong> treated animals compared to control animals, which are AST 210.4 ± 73,6; ALT130.0 ± 33.4; CK 808.1±160.1 and LDH 3838,8 ± 1058,1 <strong>in</strong> treated group compared with AST 73,7 ± 15,3;ALT 44,6 ± 4,3; CK 321.7 ± 139.9 and LDH 1263.1 ± 444,8 <strong>in</strong> control group.400350300250200150100500body weight (g)(1+ 6) C(1+ 6) Diet (1+6) STZ (1+6) STZ+Diet (1+6) STZ+Ins.Figure 1 Changes <strong>in</strong> body weight <strong>in</strong> control and <strong>diabetic</strong> <strong>rats</strong>30