TRANSPORT
A4 Application Form Resident.pmd - HDFC Bank
A4 Application Form Resident.pmd - HDFC Bank
- No tags were found...

Create successful ePaper yourself
Turn your PDF publications into a flip-book with our unique Google optimized e-Paper software.
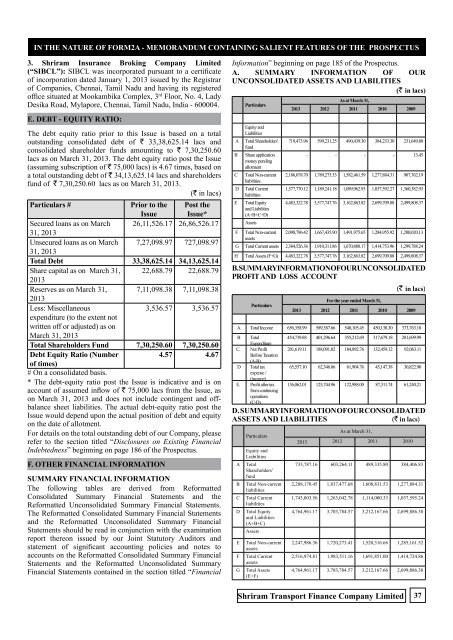
in the nature of FORM2A - MEMORANDUM CONTAINING SALIENT FEATURES OF THE PROSPECTUS3. Shriram Insurance Broking Company Limited(“SIBCL”): SIBCL was incorporated pursuant to a certificateof incorporation dated January 1, 2013 issued by the Registrarof Companies, Chennai, Tamil Nadu and having its registeredoffice situated at Mookambika Complex, 3 rd Floor, No. 4, LadyDesika Road, Mylapore, Chennai, Tamil Nadu, India - 600004.e. Debt - equity ratio:The debt equity ratio prior to this Issue is based on a totaloutstanding consolidated debt of ` 33,38,625.14 lacs andconsolidated shareholder funds amounting to ` 7,30,250.60lacs as on March 31, 2013. The debt equity ratio post the Issue(assuming subscription of ` 75,000 lacs) is 4.67 times, based ona total outstanding debt of ` 34,13,625.14 lacs and shareholdersfund of ` 7,30,250.60 lacs as on March 31, 2013.(` in lacs)Particulars #Prior to theIssuePost theIssue*Secured loans as on March 26,11,526.17 26,86,526.1731, 2013Unsecured loans as on March 7,27,098.97 727,098.9731, 2013Total Debt 33,38,625.14 34,13,625.14Share capital as on March 31, 22,688.79 22,688.792013Reserves as on March 31, 7,11,098.38 7,11,098.382013Less: Miscellaneous3,536.57 3,536.57expenditure (to the extent notwritten off or adjusted) as onMarch 31, 2013Total Shareholders Fund 7,30,250.60 7,30,250.60Debt Equity Ratio (Number4.57 4.67of times)# On a consolidated basis.* The debt-equity ratio post the Issue is indicative and is onaccount of assumed inflow of ` 75,000 lacs from the Issue, ason March 31, 2013 and does not include contingent and offbalancesheet liabilities. The actual debt-equity ratio post theIssue would depend upon the actual position of debt and equityon the date of allotment.For details on the total outstanding debt of our Company, pleaserefer to the section titled “Disclosures on Existing FinancialIndebtedness” beginning on page 186 of the Prospectus.F. OTHER FINANCIAL INFORMATIONSUMMARY FINANCIAL INFORMATIONThe following tables are derived from ReformattedConsolidated Summary Financial Statements and theReformatted Unconsolidated Summary Financial Statements.The Reformatted Consolidated Summary Financial Statementsand the Reformatted Unconsolidated Summary FinancialStatements should be read in conjunction with the examinationreport thereon issued by our Joint Statutory Auditors andstatement of significant accounting policies and notes toaccounts on the Reformatted Consolidated Summary FinancialStatements and the Reformatted Unconsolidated SummaryFinancial Statements contained in the section titled “FinancialInformation” beginning on page 185 of the Prospectus.A. SUMMARY INFORMATION OF OURUNCONSOLIDATED ASSETS AND LIABILITIES(` in lacs)ABCDEParticularsEquity andLiabilitiesTotal Shareholders'fundShare applicationmoney pendingallotmentTotal Non-currentliabilitiesTotal CurrentliabilitiesTotal Equityand Liabilities(A+B+C+D)AssetsAs at March 31,2013 2012 2011 2010 2009719,473.96 599,231.25 490,439.30 384,233.30 231,649.80- - - - 13.452,186,078.70 1,789,275.33 1,582,461.59 1,277,884.31 907,762.191,577,770.12 1,189,241.18 1,089,962.93 1,037,592.27 1,360,382.934,483,322.78 3,577,747.76 3,162,863.82 2,699,709.88 2,499,808.37F Total Non-current 2,098,796.42 1,667,435.90 1,491,975.65 1,284,955.92 1,200,020.13assetsG Total Current assets 2,384,526.36 1,910,311.86 1,670,888.17 1,414,753.96 1,299,788.24H Total Assets (F+G) 4,483,322.78 3,577,747.76 3,162,863.82 2,699,709.88 2,499,808.37B. SUMMARY INFORMATION OF OUR UNCONSOLIDATEDPROFIT AND LOSS ACCOUNT(` in lacs)ParticularsFor the year ended March 31,2013 2012 2011 2010 2009A. Total Income 656,358.99 589,387.66 540,105.45 450,138.30 373,763.10B TotalExpenditureC. Net ProfitBefore Taxation(A-B)D Total taxexpense /(income)E. Profit after taxfrom continuingoperations(C-D)454,739.88 401,296.64 355,212.69 317,679.18 281,699.99201,619.11 188,091.02 184,892.76 132,459.12 92,063.1165,557.10 62,346.06 61,904.76 45,147.38 30,822.90136,062.01 125,744.96 122,988.00 87,311.74 61,240.21D. SUMMARY INFORMATION OF OUR CONSOLIDATEDASSETS AND LIABILITIES(` in lacs)ABCDEFGParticularsEquity andLiabilitiesTotalShareholders'fundTotal Non-currentliabilitiesTotal CurrentliabilitiesTotal Equityand Liabilities(A+B+C)AssetsTotal Non-currentassetsTotal CurrentassetsTotal Assets(E+F)As at March 31,2013 2012 2011 2010733,787.16 603,264.11 489,335.80 384,406.832,288,170.45 1,837,477.68 1,608,831.53 1,277,884.311,743,003.56 1,263,042.78 1,114,000.33 1,037,595.244,764,961.17 3,703,784.57 3,212,167.66 2,699,886.382,247,986.36 1,720,273.41 1,520,316.66 1,285,161.522,516,974.81 1,983,511.16 1,691,851.00 1,414,724.864,764,961.17 3,703,784.57 3,212,167.66 2,699,886.38Shriram Transport Finance Company Limited37