

The Bot Baseline Fraud in Digital Advertising
1NBjsKK
1NBjsKK

Create successful ePaper yourself
Turn your PDF publications into a flip-book with our unique Google optimized e-Paper software.
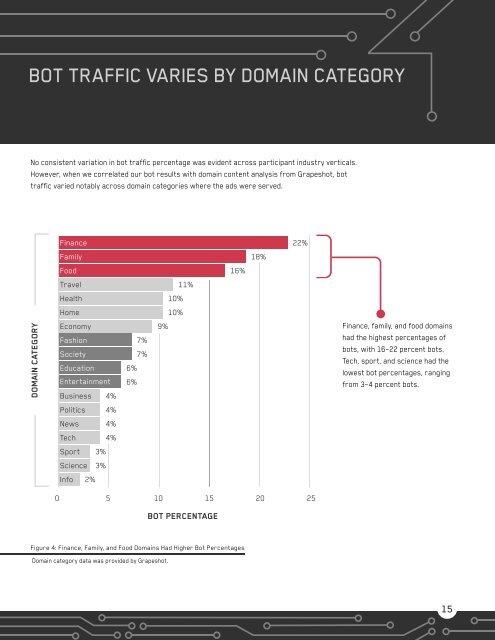
BOT TRAFFIC VARIES BY DOMAIN CATEGORYNo consistent variation <strong>in</strong> bot traffic percentage was evident across participant <strong>in</strong>dustry verticals.However, when we correlated our bot results with doma<strong>in</strong> content analysis from Grapeshot, bottraffic varied notably across doma<strong>in</strong> categories where the ads were served.F<strong>in</strong>ance22%Family18%Food16%Travel11%Health10%Home10%DOMAIN CATEGORYEconomyFashionSocietyEducationEnterta<strong>in</strong>mentBus<strong>in</strong>ess 4%7%7%6%6%9%F<strong>in</strong>ance, family, and food doma<strong>in</strong>shad the highest percentages ofbots, with 16–22 percent bots.Tech, sport, and science had thelowest bot percentages, rang<strong>in</strong>gfrom 3–4 percent bots.Politics4%News4%Tech4%Sport3%Science3%Info2%0 5 10 15 20 25BOT PERCENTAGEFigure 4: F<strong>in</strong>ance, Family, and Food Doma<strong>in</strong>s Had Higher <strong>Bot</strong> PercentagesDoma<strong>in</strong> category data was provided by Grapeshot.15