Using CoreSight Trace Techniques on Cortex - IAR Systems
Using CoreSight Trace Techniques on Cortex - IAR Systems
Using CoreSight Trace Techniques on Cortex - IAR Systems
Create successful ePaper yourself
Turn your PDF publications into a flip-book with our unique Google optimized e-Paper software.
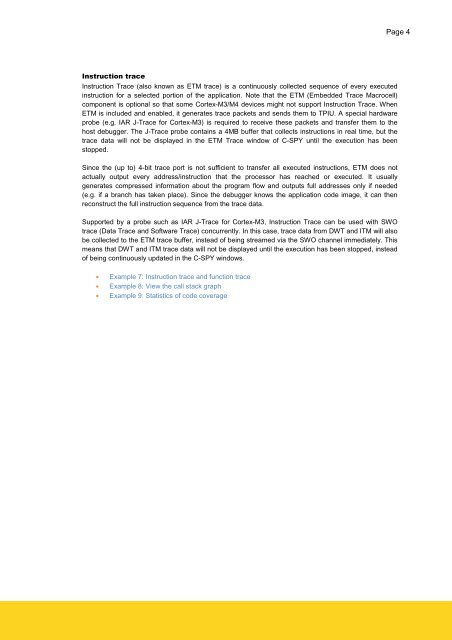
Instructi<strong>on</strong> trace<br />
Instructi<strong>on</strong> <str<strong>on</strong>g>Trace</str<strong>on</strong>g> (also known as ETM trace) is a c<strong>on</strong>tinuously collected sequence of every executed<br />
instructi<strong>on</strong> for a selected porti<strong>on</strong> of the applicati<strong>on</strong>. Note that the ETM (Embedded <str<strong>on</strong>g>Trace</str<strong>on</strong>g> Macrocell)<br />
comp<strong>on</strong>ent is opti<strong>on</strong>al so that some <strong>Cortex</strong>-M3/M4 devices might not support Instructi<strong>on</strong> <str<strong>on</strong>g>Trace</str<strong>on</strong>g>. When<br />
ETM is included and enabled, it generates trace packets and sends them to TPIU. A special hardware<br />
probe (e.g. <strong>IAR</strong> J-<str<strong>on</strong>g>Trace</str<strong>on</strong>g> for <strong>Cortex</strong>-M3) is required to receive these packets and transfer them to the<br />
host debugger. The J-<str<strong>on</strong>g>Trace</str<strong>on</strong>g> probe c<strong>on</strong>tains a 4MB buffer that collects instructi<strong>on</strong>s in real time, but the<br />
trace data will not be displayed in the ETM <str<strong>on</strong>g>Trace</str<strong>on</strong>g> window of C-SPY until the executi<strong>on</strong> has been<br />
stopped.<br />
Since the (up to) 4-bit trace port is not sufficient to transfer all executed instructi<strong>on</strong>s, ETM does not<br />
actually output every address/instructi<strong>on</strong> that the processor has reached or executed. It usually<br />
generates compressed informati<strong>on</strong> about the program flow and outputs full addresses <strong>on</strong>ly if needed<br />
(e.g. if a branch has taken place). Since the debugger knows the applicati<strong>on</strong> code image, it can then<br />
rec<strong>on</strong>struct the full instructi<strong>on</strong> sequence from the trace data.<br />
Supported by a probe such as <strong>IAR</strong> J-<str<strong>on</strong>g>Trace</str<strong>on</strong>g> for <strong>Cortex</strong>-M3, Instructi<strong>on</strong> <str<strong>on</strong>g>Trace</str<strong>on</strong>g> can be used with SWO<br />
trace (Data <str<strong>on</strong>g>Trace</str<strong>on</strong>g> and Software <str<strong>on</strong>g>Trace</str<strong>on</strong>g>) c<strong>on</strong>currently. In this case, trace data from DWT and ITM will also<br />
be collected to the ETM trace buffer, instead of being streamed via the SWO channel immediately. This<br />
means that DWT and ITM trace data will not be displayed until the executi<strong>on</strong> has been stopped, instead<br />
of being c<strong>on</strong>tinuously updated in the C-SPY windows.<br />
• Example 7: Instructi<strong>on</strong> trace and functi<strong>on</strong> trace<br />
• Example 8: View the call stack graph<br />
• Example 9: Statistics of code coverage<br />
Page 4


