

Absences Add Up
1t9Q3wC
1t9Q3wC

You also want an ePaper? Increase the reach of your titles
YUMPU automatically turns print PDFs into web optimized ePapers that Google loves.
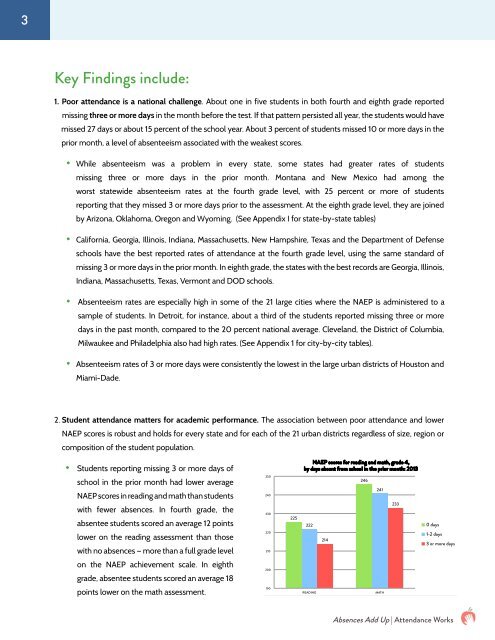
3Key Findings include:1. Poor attendance is a national challenge. About one in five students in both fourth and eighth grade reportedmissing three or more days in the month before the test. If that pattern persisted all year, the students would havemissed 27 days or about 15 percent of the school year. About 3 percent of students missed 10 or more days in theprior month, a level of absenteeism associated with the weakest scores.• While absenteeism was a problem in every state, some states had greater rates of studentsmissing three or more days in the prior month. Montana and New Mexico had among theworst statewide absenteeism rates at the fourth grade level, with 25 percent or more of studentsreporting that they missed 3 or more days prior to the assessment. At the eighth grade level, they are joinedby Arizona, Oklahoma, Oregon and Wyoming. (See Appendix I for state-by-state tables)• California, Georgia, Illinois, Indiana, Massachusetts, New Hampshire, Texas and the Department of Defenseschools have the best reported rates of attendance at the fourth grade level, using the same standard ofmissing 3 or more days in the prior month. In eighth grade, the states with the best records are Georgia, Illinois,Indiana, Massachusetts, Texas, Vermont and DOD schools.• Absenteeism rates are especially high in some of the 21 large cities where the NAEP is administered to asample of students. In Detroit, for instance, about a third of the students reported missing three or moredays in the past month, compared to the 20 percent national average. Cleveland, the District of Columbia,Milwaukee and Philadelphia also had high rates. (See Appendix 1 for city-by-city tables).• Absenteeism rates of 3 or more days were consistently the lowest in the large urban districts of Houston andMiami-Dade.2. Student attendance matters for academic performance. The association between poor attendance and lowerNAEP scores is robust and holds for every state and for each of the 21 urban districts regardless of size, region orcomposition of the student population.• Students reporting missing 3 or more days ofNAEP scores for reading and math, grade 4,by days absent from school in the prior month: 2013school in the prior month had lower averageNAEP scores in reading and math than studentswith fewer absences. In fourth grade, theabsentee students scored an average 12 points2502402302252222462412330 dayslower on the reading assessment than thosewith no absences — more than a full grade level2202102141-2 days3 or more dayson the NAEP achievement scale. In eighthgrade, absentee students scored an average 18200points lower on the math assessment.190READINGMATH<strong>Absences</strong> <strong>Add</strong> <strong>Up</strong> | Attendance Works