Absences Add Up
1t9Q3wC
1t9Q3wC
You also want an ePaper? Increase the reach of your titles
YUMPU automatically turns print PDFs into web optimized ePapers that Google loves.
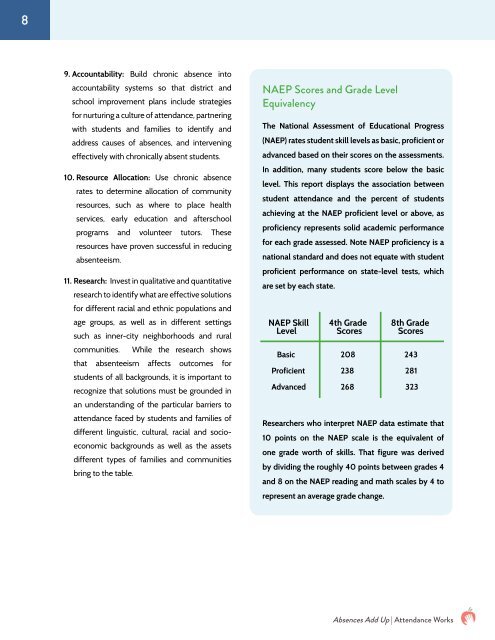
89. Accountability: Build chronic absence intoaccountability systems so that district andschool improvement plans include strategiesfor nurturing a culture of attendance, partneringwith students and families to identify andaddress causes of absences, and interveningeffectively with chronically absent students.10. Resource Allocation: Use chronic absencerates to determine allocation of communityresources, such as where to place healthservices, early education and afterschoolprograms and volunteer tutors. Theseresources have proven successful in reducingabsenteeism.11. Research: Invest in qualitative and quantitativeresearch to identify what are effective solutionsfor different racial and ethnic populations andage groups, as well as in different settingssuch as inner-city neighborhoods and ruralcommunities. While the research showsthat absenteeism affects outcomes forstudents of all backgrounds, it is important torecognize that solutions must be grounded inan understanding of the particular barriers toattendance faced by students and families ofdifferent linguistic, cultural, racial and socioeconomicbackgrounds as well as the assetsdifferent types of families and communitiesbring to the table.NAEP Scores and Grade LevelEquivalencyThe National Assessment of Educational Progress(NAEP) rates student skill levels as basic, proficient oradvanced based on their scores on the assessments.In addition, many students score below the basiclevel. This report displays the association betweenstudent attendance and the percent of studentsachieving at the NAEP proficient level or above, asproficiency represents solid academic performancefor each grade assessed. Note NAEP proficiency is anational standard and does not equate with studentproficient performance on state-level tests, whichare set by each state.NAEP Skill 4th Grade 8th GradeLevel Scores ScoresBasic 208 243Proficient 238 281Advanced 268 323Researchers who interpret NAEP data estimate that10 points on the NAEP scale is the equivalent ofone grade worth of skills. That figure was derivedby dividing the roughly 40 points between grades 4and 8 on the NAEP reading and math scales by 4 torepresent an average grade change.<strong>Absences</strong> <strong>Add</strong> <strong>Up</strong> | Attendance Works


