2015 $29.9 $15.0 $44.92016 $28.4 $18.1 $46.42017 $26.9 $21.7 $48.62018 $25.6 $26.0 $51.62019 $24.3 $31.2 $55.52020 $23.1 $37.2 $60.5(Numbers in billions)Source: Mark Potts, at recoveringjournalist.comAt the time Potts made his chart, print ad revenue for newspapers was thought tobe falling at about 5 percent per year, while online revenue was growing at nearly 20percent per year. Potts simply extrapolated those percentages into future years.His conclusions: By the year 2020 print ad revenue will be about half what it is today,and online ad revenue will be more than 10 times what it is today. The far right-handcolumn in Potts’ chart combines earnings from both those sources. It shows total adrevenue falling and falling until 2012, staying flat in 2013 and then slowly turningaround, as online growth equals and then surpasses the losses in print.By this scenario, newspapers would be in for six more years of economic pain —continued cuts in staff, newshole and newsgathering resources — before they even startto turn a corner. (For Potts’ own analysis, look up his blog, recoveringjournalist.com,and click on “Crossing the Chasm.”)Sadly, however, Potts seems to have overestimated the likely revenue gains from theInternet. No one expects online newspaper advertising to keep rising at a 20 percentclip. In fact, that 20 percent increase for 2007 (it turned out to be less than 19 percent,actually) represents a dramatic decline; online revenue had been growing by more than30 percent in previous years.As for Potts’ assumption of only a 5 percent per year drop in print ad revenue, thatseems wildly optimistic now. The actual rate of decline for 2007 turned out to be not 5percent but 9.4 percent. Analysts expect something similar in 2008.But the scariest problem — which Potts himself points out — is that many paperswon’t share in the online growth. There will be winners and losers. And even as theindustry as a whole survives, we may begin seeing, pretty soon, big American cities withno daily newspaper.“It’s going to be really bloody, incredibly devastating,” Potts predicts. “And I thinkthere are going to be a lot of major metros that don’t make it.”If this sounds like hyperventilation, consider the findings of a report by the JoanShorenstein Center on the Press, Politics & Public Policy called “Creative Destruction:An Exploratory Look at News on the Internet.” This report, published last August,examined trends in Internet-based news. One of its findings was that although readershipof the Web sites of national “brand-name” papers (such as the New York Timesand Washington Post) is increasing, that isn’t the case for many other newspaper sites.Many, in fact, are losing ground.“Unlike the brand-name sites, the typical site of a large-city daily is not growing,” thereport says. “The average traffic level in April 2007 was nearly identical to the level inApril 2006.”14<strong>Feedback</strong> January 2009 (Vol. 50, No. 1)
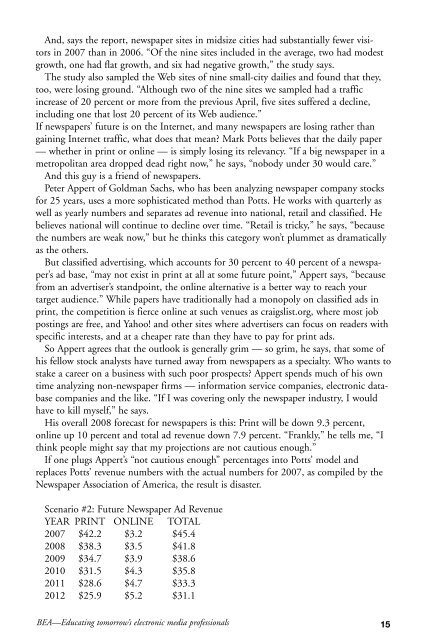
And, says the report, newspaper sites in midsize cities had substantially fewer visitorsin 2007 than in 2006. “Of the nine sites included in the average, two had modestgrowth, one had flat growth, and six had negative growth,” the study says.The study also sampled the Web sites of nine small-city dailies and found that they,too, were losing ground. “Although two of the nine sites we sampled had a trafficincrease of 20 percent or more from the previous April, five sites suffered a decline,including one that lost 20 percent of its Web audience.”If newspapers’ future is on the Internet, and many newspapers are losing rather thangaining Internet traffic, what does that mean? Mark Potts believes that the daily paper— whether in print or online — is simply losing its relevancy. “If a big newspaper in ametropolitan area dropped dead right now,” he says, “nobody under 30 would care.”And this guy is a friend of newspapers.Peter Appert of Goldman Sachs, who has been analyzing newspaper company stocksfor 25 years, uses a more sophisticated method than Potts. He works with quarterly aswell as yearly numbers and separates ad revenue into national, retail and classified. Hebelieves national will continue to decline over time. “Retail is tricky,” he says, “becausethe numbers are weak now,” but he thinks this category won’t plummet as dramaticallyas the others.But classified advertising, which accounts for 30 percent to 40 percent of a newspaper’sad base, “may not exist in print at all at some future point,” Appert says, “becausefrom an advertiser’s standpoint, the online alternative is a better way to reach yourtarget audience.” While papers have traditionally had a monopoly on classified ads inprint, the competition is fierce online at such venues as craigslist.org, where most jobpostings are free, and Yahoo! and other sites where advertisers can focus on readers withspecific interests, and at a cheaper rate than they have to pay for print ads.So Appert agrees that the outlook is generally grim — so grim, he says, that some ofhis fellow stock analysts have turned away from newspapers as a specialty. Who wants tostake a career on a business with such poor prospects? Appert spends much of his owntime analyzing non-newspaper firms — information service companies, electronic databasecompanies and the like. “If I was covering only the newspaper industry, I wouldhave to kill myself,” he says.His overall 2008 forecast for newspapers is this: Print will be down 9.3 percent,online up 10 percent and total ad revenue down 7.9 percent. “Frankly,” he tells me, “Ithink people might say that my projections are not cautious enough.”If one plugs Appert’s “not cautious enough” percentages into Potts’ model andreplaces Potts’ revenue numbers with the actual numbers for 2007, as compiled by theNewspaper Association of America, the result is disaster.Scenario #2: Future Newspaper Ad RevenueYEAR PRINT ONLINE TOTAL2007 $42.2 $3.2 $45.42008 $38.3 $3.5 $41.82009 $34.7 $3.9 $38.62010 $31.5 $4.3 $35.82011 $28.6 $4.7 $33.32012 $25.9 $5.2 $31.1BEA—Educating tomorrow’s electronic media professionals 15
- Page 1: VOLUME 50 • NUMBER 1 • JANUARY
- Page 4 and 5: [ ARTICLE ]Is Radio Education Deadi
- Page 6 and 7: changes, the mission and goals of m
- Page 8 and 9: Attitudes and Perceptions of Oklaho
- Page 10 and 11: Figure 4RELATIONSHIP STATUS BETWEEN
- Page 12 and 13: O’Donnel, L., Hausman, C, & Benoi
- Page 16 and 17: 2013 $23.5 $5.7 $29.22014 $21.3 $6.
- Page 18 and 19: New York Times and some others —
- Page 20 and 21: [ ARTICLE ]HD Radio in theIntermoun
- Page 22 and 23: digital radio receiver the followin
- Page 24 and 25: and outside the broadcast studio…
- Page 26 and 27: Barboutis, C. (1997). “Digital Au
- Page 28 and 29: the game. One can also find a numbe
- Page 30 and 31: Razor scooters (Khermouch, 2001). A
- Page 32 and 33: ing during the rest of the year. Fu
- Page 34 and 35: * Sprint made its two humorous Supe
- Page 36 and 37: ing another $150 worth of free cove
- Page 38 and 39: efore the game to highlights of the
- Page 40 and 41: Caywood, C. L., Schultz, D. E., & W
- Page 42 and 43: Retrieved September 20, 2008 from:
- Page 44 and 45: [ ARTICLE ]HEADS UP: What DeansExpe
- Page 46 and 47: ment to your teaching or research.
- Page 48 and 49: Dr. Robert L. Snyder died early in
- Page 50 and 51: Accrediting Council forEducation in
- Page 52 and 53: Faculty and Student NewsCompetition
- Page 54 and 55: [ DIRECTORY ][ Staff, Executive Com
- Page 56 and 57: Alaska Broadcasters AssociationAriz
- Page 58 and 59: Indiana UniversityInternational Col
- Page 60: 2008-09 BEA OFFICERSPresidentMark T