INTELLECTUAL CAPITAL
Report Released - Entovation International
Report Released - Entovation International

Create successful ePaper yourself
Turn your PDF publications into a flip-book with our unique Google optimized e-Paper software.
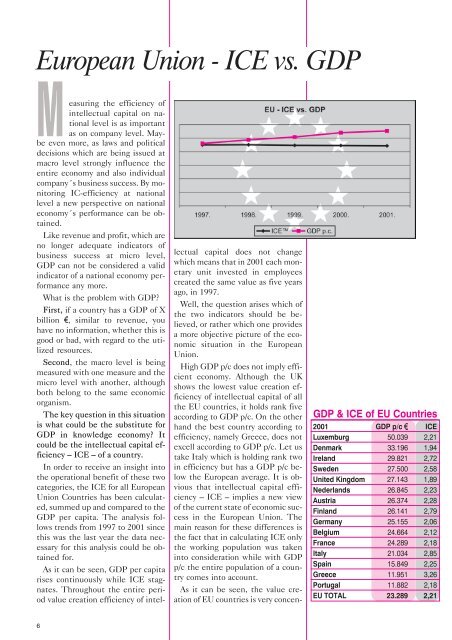
European Union - ICE vs. GDPMeasuring the efficiency ofintellectual capital on nationallevel is as importantas on company level. May-be even more, as laws and politicaldecisions which are being issued atmacro level strongly influence theentire economy and also individualcompany´s business success. By monitoringIC-efficiency at nationallevel a new perspective on nationaleconomy´s performance can be obtained.Like revenue and profit, which areno longer adequate indicators ofbusiness success at micro level,GDP can not be considered a validindicator of a national economy performanceany more.What is the problem with GDP?First, if a country has a GDP of Xbillion , similar to revenue, youhave no information, whether this isgood or bad, with regard to the utilizedresources.Second, the macro level is beingmeasured with one measure and themicro level with another, althoughboth belong to the same economicorganism.The key question in this situationis what could be the substitute forGDP in knowledge economy? Itcould be the intellectual capital efficiency– ICE – of a country.In order to receive an insight intothe operational benefit of these twocategories, the ICE for all EuropeanUnion Countries has been calculated,summed up and compared to theGDP per capita. The analysis followstrends from 1997 to 2001 sincethis was the last year the data necessaryfor this analysis could be obtainedfor.As it can be seen, GDP per capitarises continuously while ICE stagnates.Throughout the entire periodvalue creation efficiency of intel-lectual capital does not changewhich means that in 2001 each monetaryunit invested in employeescreated the same value as five yearsago, in 1997.Well, the question arises which ofthe two indicators should be believed,or rather which one providesa more objective picture of the economicsituation in the EuropeanUnion.High GDP p/c does not imply efficienteconomy. Although the UKshows the lowest value creation efficiencyof intellectual capital of allthe EU countries, it holds rank fiveaccording to GDP p/c. On the otherhand the best country according toefficiency, namely Greece, does notexcell according to GDP p/c. Let ustake Italy which is holding rank twoin efficiency but has a GDP p/c belowthe European average. It is obviousthat intellectual capital efficiency– ICE – implies a new viewof the current state of economic successin the European Union. Themain reason for these differences isthe fact that in calculating ICE onlythe working population was takeninto consideration while with GDPp/c the entire population of a countrycomes into account.As it can be seen, the value creationof EU countries is very concen-GDP & ICE of EU Countries2001 GDP p/c ICELuxemburg 50.039 2,21Denmark 33.196 1,94Ireland 29.821 2,72Sweden 27.500 2,58United Kingdom 27.143 1,89Nederlands 26.845 2,23Austria 26.374 2,28Finland 26.141 2,79Germany 25.155 2,06Belgium 24.664 2,12France 24.289 2,18Italy 21.034 2,85Spain 15.849 2,25Greece 11.951 3,26Portugal 11.882 2,18EU TOTAL 23.289 2,216