INTELLECTUAL CAPITAL
Report Released - Entovation International
Report Released - Entovation International

You also want an ePaper? Increase the reach of your titles
YUMPU automatically turns print PDFs into web optimized ePapers that Google loves.
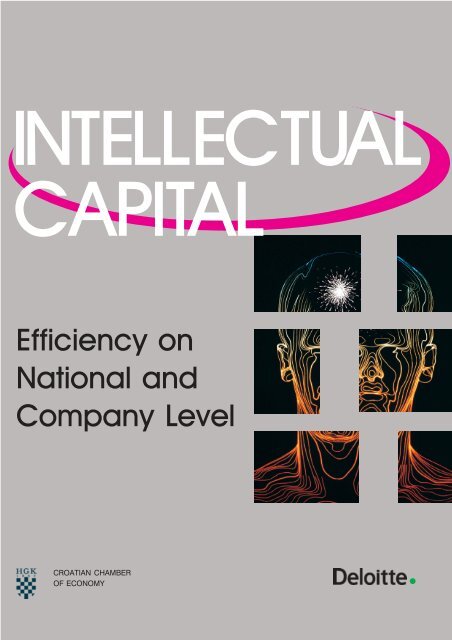
<strong>INTELLECTUAL</strong><strong>CAPITAL</strong>Efficiency onNational andCompany LevelCROATIAN CHAMBEROF ECONOMY
●●●●●●●●●GlossaryFor quick and simple understanding ofthis analysis please find a briefdescription of terms used in this paper:Value added (VA): newly created value,calculated as followsVA = Operating profit+ Employeecosts + Depreciation +AmortisationorVA = OUTPUT (Total income) - INPUT(All costs of purchasing goods andservices from the market.)Human Capital (HC): overall employeeexpenses (salaries, education, training);In this analysis considered aninvestment, not cost, and thus notsubstantial part of INPUT any more.Structural Capital (SC): result of HumanCapital’s past performance(organisation, licences, patents, image,standards, relationship with customers).Capital Employed (CE): all material andfinancial assets.Human Capital Efficiency (HCE=VA/HC):indicator which shows how much VA iscreated on each monetary unit investedin HC.Structural Capital Efficiency (SCE=SC/VA): indicator that shows the share ofSC in value creation.Intellectual Capital Efficiency(ICE=HCE+SCE): Indicator which showshow efficiently IC has created value.Capital Employed Efficiency (CEE=VA/CE): indicator that shows how much VAis created on each monetary unitinvested in CE.Value Added Intellectual Coefficient(VAIC TM =ICE+CEE): indicates the valuecreation efficiency of all resources (sumof the previous indicators). It expressesthe intellectual ability of a company,regional or national economy.Value CreationEfficiency Analysis(powered by VAIC)Starting point for the VAIC analysis (www.vaicon.net)is the business result, value added. Twokey resources are involved in the value creationprocess: physical and financial capital (CE –capital employed) and intellectual capital (IC). In orderto calculate the value creation efficiency of theseresources each one is related to the created VA. Thisway the efficiency indicators are received:Intellectual capital efficiency (ICE) incorporateshuman capital efficiency (HCE) and structural capitalefficiency (SCE) is one of the key idicators usedthroughout this report.VAIC (Value Added Intellectual Coefficient),incorporating ICE and CEE, is the other key indicatorreflecting the company’s “total efficiency” or its“intellectual ability”. The higher the VAIC indicator,the better management has utilized the existingpotential.What is the benefit of this measuring method? It isfocussed on value creation, not cost control and takesintellectual capital performance, particulary humancapital into account. This is valuable new informationfor all participants in value creation process:managers, shareholders, employees and others.The VAIC analysis is simple. What makes it unique isthat it can be applied on all levels of business activity:the macro-economic (national) level, the meso(sectors) level and the microeconomic (company level)and within the company. All data needed for the VAICanalysis on macro level are included in standardbalance sheets and business reports.Through VAIC management can detect weak pointsof value creation at any level of business, national,regional, within an industry, sector or a company.Control of value creation efficiency enables managersto leverage their company’s potential and maximiseits value. However, what VAIC cannot provide, is aprecise depiction of required changes in managementof a company or an economy. VAIC is just a tool forscanning value creation efficiency (like blood analysiswith humans). Therefore it is best if combined withother IC/KM-management tools.2
intellectual capitalForewordMeasuring intellectual capitalefficiency is one ofthe greatest challengesfor all who are involvedin economy, at macro as well as atmicro level.It is a challenge for everyonedealing with economic theory,since the prevailing one does notoffer plausible answers to the existingbusiness reality.It is a challenge for governments,which are becoming moreand more helpless as existing waysof governing national economieshave become less and less efficient.It is a challenge for managerswho lead companies in times ofturmoil with no reliable indicatorsof their business success.It is a challenge for the employeeswho, on the one hand, are notyet aware of their new, significantrole in value creation and,on the other hand, are totally insecurewith regard to the futureof their working places.Until now just several conceptsof presenting national IC-performancewere published. The report“Sweden’s Intellectual CapitalBalance Sheet” was the firstand laid the foundations for the“Intellectual Capital of the Stateof Israel”. A different conceptwas applied in the report “IntellectualCapital Dvelopment inthe Arab Region”. This reportand the one published last year,the “Intellectual Capital – Efficiencyof Croatian Economy”,take a third approach in measuringand presenting company’sand national IC – performance.The pages to follow provide apossible way of coping with thechallenges referred to previously.The Analysis is based on two keyresources in each business: intellectualcapital and capital employed(physical and financialcapital). Both are treated equally,as investments, and both arein the function of value creation.The IC of a company consistsof all employees, their organizationand their ability to createvalue, which is evaluated at themarket. A company can have thebest qualification structure, i.e.intellectual potential, but if itcreates little value with regard toits resources, its intellectual abilityis low.Therefore, in order to get a fulland objective picture of businesssuccess, it is not enough to monitoronly capital employed but alsointellectual capital efficiency atall levels: inside the company, betweencompanies, between sectorsof a national economy andbetween nations on a global scale.Hope you will enjoy reading the analysisProf. Dr. Ante Pulic3
Activating Intellectual CapitalThe challenges of 21 st century require efficient management ofknowledge, and its relevant form ineconomy, intellectual capital, whichhas finally become the key factor ofvalue creation. The problem that weare facing lies in the fact that knowledgeis “intangible”, and thereforehard to manage and measure. Thefactor we can measure is the efficiencyof applying knowledge in valuecreation.Along with other available resources,the key drivers of new economyshould be activated – the employees,their knowledge and organizationin value creation processes thatwill be evaluated in the market.Deloitte has recognized the importanceand power of knowledgeand joined the initiative of theCroatian Chamber of Economy contributingto research, encouragement,management and measurementof intellectual capital.We also support the value creationefficiency analysis (powered byVAIC), a new output measure formeasuring intellectual capital performanceon corporate, local, sector,regional, national and global level.This analysis has already been recognizedas a Croatian export service,recognized and verified in globalmarkets. VAIC helps national andlocal governments, company managementand consultants in determiningweak points and reasons forvalue destruction, in systematic improvementof value creation efficiencyand establishing balance onhigher and higher levels.The mission of Deloitte is to assistour clients and their employees inachieving business success. This alsoapplies to the field of managementand measurement of intellectual capitalin order to enable them to becomepowerful players in global markets.Branko TomaškovićpartnerIn the current challenging businessenvironment, organisations arefaced with increasingly competitivemarkets. While an emphasis on costreduction remains a vital focus, understandingthe value added by HumanResources has never been moreimportant.The intellectual capital efficiencyanalysis (powered by VAIC) is akey tool and methodology in helpingmanagement understand whetherthey are making sufficient investmentsin human capital and whethertheir human resource managementprograms are being applied correctly.Historically, human resource functionshave been tasked with performing‘factory’ type operations,such as payroll, recruitment andsome training. However, there is amuch needed strategic human capitalmanagement role as well, thatlooks at:● People development● Career planning● Succession planning● Change management● Motivation and rewardsHuman resources are complicated,and understanding how well theyperform and why they perform theway they do, can be an invaluablemanagement tool. VAIC providesthe opportunity for management tobetter understand how they can createmore value in their business bybetter managing the capital theyhave invested in people.We are delighted to have the opportunityto work with Professor Pulicand his team in supporting businessesin both understanding theirhuman capital investments and howto better leverage that investment increating long-term sustainable shareholdervalue.Paul Trinderpartner4
The following could be saidabout this key indicator ofnew economy: intellectual capitalefficiency is for all the participantsin current economy thesame as productivity – the numberof produced items in a certaintime unit – once was for manuallabour and manual labourer.In order to calculate this efficiency,it is necessary to checkhow much value added the employeesmanaged to create in interactionwith the company’sstructural capital with all the infrastructureavailable.intellectual capitalIntellectual Capital Efficiency – Why ?<strong>INTELLECTUAL</strong> <strong>CAPITAL</strong>EFFICIENCY (ICE) indicateshow much value added is created onone monetary unit invested in employees.Therefore it provides informationabout value creation efficiencyof a company, business sector,regional or national economy.This is one of the first analyses totake intellectual capital performanceinto account when assessinga company’s business success. Overallefficiency (VAIC), which is thekey parameter throughout this analysis,is largely determined by ICE –intellectual capital efficiency.Who can benefit from this analysis?Government and all otherdeceision makers thatcreate and form thebusiness environmentThe results that follow indicateto governments to whatextent economy has made progressor stagnated in comparison to theprevious year and how individualnational economies are performingin comparison to others. Generaltrends show how the «value creationability» has been developingin certain sector of economy,which are the stagnating andwhich the growing ones, how efficientthe biggest European companiesare whose efficiency considerablyinfluences the efficiency oftheir national economies.CompaniesThis analysis is important forcompanies as well, since it givesinsight into value creation capacity.Namely, numerous companiesVALUE ADDED (VA) is an exceptionallyimportant new indicator,since it shows the ability of acompany or whole economy to createvalue. It is a source for coveringinvestments costs of all the employees– wages, health insurance,and pension funds – liabilities towardsthe creditors, taxes andshareholders’ dividends, investmentsin the future.generate income and profits, althoughthey do not create value.This is a paradox due to new businessenvironment and new criteriafor business success. Besidesthat, this analytical approach enablesthem to orientate themselvesin three directions;●●●To see how capable they areof value creation in their businessenvironment, in otherwords to assess their currentposition with regard to theirimmediate competitionTo compare the efficiency oftheir intellectual capital withthe one created both on regionalas well as national levelTo get a clear picture aboutefficiency of companies andsectors in international terms.InvestorsAs a close relationship betweenthe intellectual capital efficiencyand the market value of a companyhas been proved in many cases,it enables forecasting fluctuationsin share value. Examples haveshown that a decrease in intellectualcapital efficiency over severalyears has resulted in a decrease intheir companies value and occasionallyeven led to bankruptcy.This is why intellectual capital efficiencyrepresents a very importantorientation for investors.EmployeesThey finally receive the placewhich belongs to them in neweconomy: the employees have becomea key investment, companiessuccess or failure depends on.This is not just declarative: in thisanalysis employees are not treatedas costs - wages and salaries arenot costs but substantial part ofvalue added- but as a resourcewhich is equal to financial capital.Now employees can monitor theirown value creation efficiency andorientate themselves accordingly(e.g. requirements of the laborunion can now be viewed in thecontext of their member’s valuecreation efficiency).5
European Union - ICE vs. GDPMeasuring the efficiency ofintellectual capital on nationallevel is as importantas on company level. May-be even more, as laws and politicaldecisions which are being issued atmacro level strongly influence theentire economy and also individualcompany´s business success. By monitoringIC-efficiency at nationallevel a new perspective on nationaleconomy´s performance can be obtained.Like revenue and profit, which areno longer adequate indicators ofbusiness success at micro level,GDP can not be considered a validindicator of a national economy performanceany more.What is the problem with GDP?First, if a country has a GDP of Xbillion , similar to revenue, youhave no information, whether this isgood or bad, with regard to the utilizedresources.Second, the macro level is beingmeasured with one measure and themicro level with another, althoughboth belong to the same economicorganism.The key question in this situationis what could be the substitute forGDP in knowledge economy? Itcould be the intellectual capital efficiency– ICE – of a country.In order to receive an insight intothe operational benefit of these twocategories, the ICE for all EuropeanUnion Countries has been calculated,summed up and compared to theGDP per capita. The analysis followstrends from 1997 to 2001 sincethis was the last year the data necessaryfor this analysis could be obtainedfor.As it can be seen, GDP per capitarises continuously while ICE stagnates.Throughout the entire periodvalue creation efficiency of intel-lectual capital does not changewhich means that in 2001 each monetaryunit invested in employeescreated the same value as five yearsago, in 1997.Well, the question arises which ofthe two indicators should be believed,or rather which one providesa more objective picture of the economicsituation in the EuropeanUnion.High GDP p/c does not imply efficienteconomy. Although the UKshows the lowest value creation efficiencyof intellectual capital of allthe EU countries, it holds rank fiveaccording to GDP p/c. On the otherhand the best country according toefficiency, namely Greece, does notexcell according to GDP p/c. Let ustake Italy which is holding rank twoin efficiency but has a GDP p/c belowthe European average. It is obviousthat intellectual capital efficiency– ICE – implies a new viewof the current state of economic successin the European Union. Themain reason for these differences isthe fact that in calculating ICE onlythe working population was takeninto consideration while with GDPp/c the entire population of a countrycomes into account.As it can be seen, the value creationof EU countries is very concen-GDP & ICE of EU Countries2001 GDP p/c ICELuxemburg 50.039 2,21Denmark 33.196 1,94Ireland 29.821 2,72Sweden 27.500 2,58United Kingdom 27.143 1,89Nederlands 26.845 2,23Austria 26.374 2,28Finland 26.141 2,79Germany 25.155 2,06Belgium 24.664 2,12France 24.289 2,18Italy 21.034 2,85Spain 15.849 2,25Greece 11.951 3,26Portugal 11.882 2,18EU TOTAL 23.289 2,216
intellectual capitalCreated value added2001 VA m Share %Germany 1.863.830 23,33United Kingdom 1.383.844 17,32France 1.358.900 17,01Italy 1.140.830. 14,28Spain 589.648 7,38Nederlands 393.843 4,93Belgium 227.369 2,85Sweden 214.557. 2,69Austria 200.394 2,51Denmark 152.522 1,91Finland 118.499 1,48Greece 114.568 1,43Portugal 106.395 1,33Ireland 102.691 1,29Luxemburg 19.737 0,25EU TOTAL 7.987.627 100,00trated. Please note that next to thecreated amount of VA the share intotal value creation is listed too. Thefirst four countries create 72% andthe other eleven ones the remaining28% of the entire value added. Inorder to get a clear picture of theeconomic competence of the EUcountries, it is important to takeICE into consideration.As one could notice, IC efficiencyof several nations is in opposition tothe created mass of value added.The “small” countries are actuallythe ones which have the most efficienteconomies within the EU. Anexception to this and, at the sametime a phenomenon, is Italy. It combinesa desirable optimum: largeamount of value added and high levelof efficiency.The problem here is that big economieslike Germany or the UK areperforming considerably below theEuropean average, France beingjust slighly below.Among the big four only Italy’seconomy turns out to be efficient.But why is the efficiency of “big”economies, primarily the UK andGermany such an important issue?Because it is here that even a slightimprovement in efficiency wouldresult in a considerable increase invalue added. E.g. if the UK raised itsefficiency only by 2% it would createapproximately 32.000.000.000more value added while a 2% increasein Greece, a smaller economy,would result only in 23.000.000more value added .This example shows that value creationefficiency of intellectual capitalcan shed entirely new light onnational economies performance andit is certainly a different one fromGDP. In a knowledge based economynew ways of measuring nationalperformance have to be consideredif orientation is to be obtained.Therefore any considerate government,which feels responsible for thewell being of its national economy,has to pay due attention to the presentedissue.European Union ICE Ranking2001 ICE VA mGreece 3,26 114.568Italy 2,85 1.140.830Finland 2,79 118.499Ireland 2,72 102.691Sweden 2,58 214.557Austria 2,28 200.394Spain 2,25 589.648Nederlands 2,23 393.843Luxemburg 2,21 19.737France 2,18 1.358.900Portugal 2,18 106.395Belgium 2,12 227.369Germany 2,06 1.863.830Denmark 1,94 152.522United Kingdom 1,89 1.383.844EU TOTAL 2,21 7.987.6277
ICE and Market Value –New Possibilities for CompaniesIt is hard to obtain a correlation between ICE andGDP but it is not for the market value of companiesand their ICE. According to the results of anempirical analysis carried out at 30 randomly chosencompanies listed at the FTSE 250, there is aclose relationship between these two indicators.Statistical analysis was applied to 27 companies forthe period of 8 years in three different ways. Eachprocedure led to the same conclusion, that a relationbetween the coefficients ICE and MVA doesexist. The significance tests were positive.By taking an average ICE - MVA, as shown in thegraph below, a high degree of correspondence betweenthe two indicators can be noticed.A high correspondence had also been received at astudy carried out at the Vienna StockExchange. 70companies listed on the Vienna stock exchange wereselected and analyzed for three years (1994 – 1997).The results of the ICE analysis were compared withthe MVA of the same companies. As it can be seen ahigh correspondence between average MVA andICE does exist. In our opinion these empirical re-Of what relevance is this for companies? They receivehelp in two and more ways:●●Firstly, regarding the increase of their marketvalue. Now that they have received a signpostwhich directs them, they can work on increasingtheir IC efficiencySecondly, they can determine the actual valueof their company although it is not listed at thestock exchange, or they can assess the value ofcompany parts.sults could be the proof of a close relationship betweenthe value creation efficiency of intellectualcapital and the market value of companies.8
Intellectual Capital Efficiency –European TOP 500 by Countriesintellectual capitalCountry No. of Comp. VA m Best Company 2002 Sector ICEAustria 9 8.811 Verbund Electricity 3,77Belgium 15 34.930 D’Ietern Support services 3,51Czech Republic 1 1.052 Češky Telekom Telecommunications 5,47Denmark 8 12.409 TDC Telecommunications 2,97Finland 17 31.529 Sampo Insurance 4,79France 57 279.141 CNP Assurance Life assurance 6,65Germany 77 328.623 WCM Real estate 4,62Greece 6 6.728 Hellenic Telecommunications Telecommunications 3,38Hungary 1 562 MOL Hungarian Oil and Gas Oil & gas 2,75Ireland 7 11.178 Bank of Ireland Banks 2,91Italy 32 96.596 ENI Oil & gas 6,32Liechtenstein 1 1.083 Hilti Construction & Building 1,68Luxembourg 3 4.947 Ses Global Media & photography 21,98Norway 6 16.175 Norske Skogindustrier Forestry & paper 3,92Poland 2 3.160 Telekomunikacja Polska Telecommunications 3,31Portugal 6 8.943 CIMPOR Construction & Building 5,37Russia 2 10.477 Gazprom Gas distribution 7,99Spain 23 72.032 Gas Natural Gas distribution 7,45Sweden 22 44.508 Svenska Handelsbanken Banks 3,76Switzerland 32 114.692 Holcim Construction & Building 5,10The Netherlands 29 99.110 Nuon Electricity 3,38United Kingdom 144 403.221 British Land Real estate 18,62TOTAL 500 1.589.905 ICE TOP 500 2,43The data presented in the chartimplies several ambiquities:● First, the small number of Italiancompanies represented among theICE top 500 is in no relation to thesize and efficiency of this economyon national level. The reasonfor this is that Italy is building itseconomic strenght on small to mediumsized, but very efficient companies.●Second, the most efficient nationalcompanies come fromtraditional sectors, not the hightech one: Oil & Gas and Gasdistribution – 4, Construction& Building – 3, Electricity – 2,the hit sector being Telecommunicationsthe most efficientone in 4 countries.● Third, in the UK and Germany,the two largest countries accordingto value added, themost efficient companies comefrom real estate sectors while intwo smaller economies – Irelandand Sweden – banks arethe most efficient.● Fourth, the appearance ofCzech Republic, Hungary, Polandand Russia indicates thatnew players are joining thegame, from areas noone has consideredbefore.9
TOP 500 - VA by SectorsShare % Sector VA 2002 m ICE16,19 Banks 257.347 2,308,83 Telecommunications 140.364 3,228,24 Automobiles & parts 130.929 1,927,91 Oil & gas 125.701 5,334,26 Electricity 67.670 3,374,09 Construction & Building 65.037 2,163,90 Diversified industrials 62.079 2,133,89 Pharmaceuticals & biotechnology 61.869 2,733,65 Media & photography 57.966 2,123,42 Food procesors 54.449 2,433,42 Chemicals 54.361 2,023,27 Engineering & machinery 52.068 1,693,18 Food & drug retailers 50.542 2,042,91 Insurance 46.212 2,612,84 General Retailers 45.142 1,912,45 Support services 39.012 1,772,18 Transport 34.586 1,991,80 Aerospace & defence 28.600 1,671,43 Life assurance 22.801 2,451,28 Beverages 20.376 3,031,26 Leisure & hotels 20.020 2,091,16 Mining 18.451 3,941,14 Gas distribution 18.175 5,131,05 Forestry & paper 16.745 2,791,00 Household goods 15.912 2,100,81 Personal Care 12.925 2,180,76 Health 12.075 1,890,74 Steel & other metals 11.842 1,910,70 Tobacco 11.165 3,740,54 IT Hardware 8.635 3,270,43 Software & IT services 6.889 1,760,40 Electronic & electrical 6.369 1,750,39 Water 6.225 3,160,28 Other finance 4.504 2,410,18 Real estate 2.861 7,91100,00 ICE TOP 500 TOTAL 1.589.905 2,43Half of the total value added createdby the top 500 is created bythe first six sectors. The other halfis created by the remaining 29 sectors.The problem is that two ofthe first six sectors- Banks and Automobiles& parts- display valuecreation efficiency level which isbelow the Top 500 average. Thisway the potential of the «cream»of European business is unfortunatelyreduced.Data sourceAs already mentioned, allthe data necessary for calculatingICE on nationallevel could be obtainedfrom national statistics offices.It is somewhat morecomplex with the data necessaryfor calculating ICEaccording to sectors orcompanies. The base formore detailed calculationof value added were annualbusiness reports publishedby the companies.The accounting standardsrepresented a seriousproblem here. US GAAPdoes not state the positionwages and salaries, whichmakes it impossible to calculateeither the value addedor the intellectual capitalefficiency. Since thedata for calculation of parameterswas not availablefor all companies, you maynot be able to find somewell known company.The analysis The Valueadded Scoreboard, 2003The Top 800 UK & 600European companies byValue Added, published byDepartment of Trade andIndustry, Business Finance& Investment Unit, UK,represented an importantsource of data for all thecompanies, where it wasnot possible to get hold oftheir annual reports.10
intellectual capitalTOP 500 - ICE by SectorsCriterionThe criterion for beinglisted was the created valueadded whereby the bottomlimit to be includedwas 500 million. Next tothe created value added,the European top 500companies were also rankedaccording to their intellectualcapital value creationefficiency.Daimler Chrysler wasthe biggest company bycreating 30.336 million ofvalue added in 2002. Accordingto the results theaverage efficiency of ourTop 500 is ICE= 2,43.Some well known companieslike MAN, Siemens,Alex Springer Verlag- Germany or Kingfisher,BBC, KPMG – UK, CapGemini Ernst & Young –France did not make it onthe list of the most IC efficientEuropean top 500, asthey achieved minimal eficiency.Other companies thatcould not make it on thelist were the ones which althoughthey created therequired amount of valueadded did not createenough to cover for humancapital (Ericsson – Sweden,Alcatel, Bull – France,Marconi – UK).Share % in VA Sector ICE 2002 VA m0,18 Real estate 7,91 2.8617,91 Oil & gas 5,33 125.7011,14 Gas distribution 5,13 18.1751,16 Mining 3,94 18.4510,70 Tobacco 3,74 11.1654,26 Electricity 3,37 67.6700,54 IT Hardware 3,27 8.6358,83 Telecommunications 3,22 140.3640,39 Water 3,16 6.2251,28 Beverages 3,03 20.3761,05 Forestry & paper 2,79 16.7453,89 Pharmaceuticals & biotechnology 2,73 61.8692,91 Insurance 2,61 46.2121,43 Life assurance 2,45 22.8013,42 Food processors 2,43 54.4490,28 Other finance 2,41 4.50416,19 Banks 2,30 257.3470,81 Personal Care 2,18 12.9254,09 Construction & Building 2,16 65.0373,90 Diversified industrials 2,13 62.0793,65 Media & photography 2,12 57.9661,00 Household goods 2,10 15.9121,26 Leisure & hotels 2,09 20.0203,18 Food & drug retailers 2,04 50.5423,42 Chemicals 2,02 54.3612,18 Transport 1,99 34.5868,24 Automobiles & parts 1,92 130.9292,84 General Retailers 1,91 45.1420,74 Steel & other metals 1,91 11.8420,76 Health 1,89 12.0752,45 Support services 1,77 39.0120,43 Software & IT services 1,76 6.8890,40 Electronic & electrical 1,75 6.3693,27 Engineering & machinery 1,69 52.0681,80 Aerospace & defence 1,67 28.600100,00 ICE TOP 500 TOTAL 2,43 1.589.905In this chart, displaying efficiencyaccording to sectors, all results are realexcept in the sector IT-Hardware.Only these companies from this sectorentered the Top 500 list, whichhad minimal efficiency-meaning thatthey created at least that much valueadded to cover human capital investments.Only two companies satisfiedthis condition and thus joined the list.However, as we are dealing with a keysector of new economy, there is a separatechart in order to receive a realpicture of its IC performance.Company VA m HC ICENokia, Finland 8.071 2.884 3,44Ericsson, Sweden 3.615 5.675 0,07Alcatel, France 3.035 6.442 -0,65Oce, The Netherlands 1.428 1.216 1,32Marconi, UK 1.049 2.614 -1,09Bull, France 633 929 0,21Spirent, UK 564 380 1,81IT Hardware 18.396 20.139 0,8211
ICE TOP 50 European BanksRank Bank ICE 2002 VA m1 Northern Rock, UK 5,88 5442 Svenska Handelsbanken, Sweden 3,76 1.8623 Lloyds, TSB, UK 3,72 8.6434 Alliance & Leicester,UK 3,67 1.0095 HBOS, UK 3,47 6.5316 Banco Popular Espanol, Spain 3,34 1.3537 DePfa, Germany 3,28 6448 Dexia, Belgium 3,13 3.7559 Bank Pekao, Poland 3,13 73210 Union Bank of Norway, Norway 3,07 67911 Alpha Credit Bank, Greece 3,05 91012 Royal Bank of Scotland, UK 3,02 14.09913 ForeningsSparenbanken, Sweden 3,01 1.61914 DnB, Norway 2,99 1.13015 EFG Eurobank Ergasius, Greece 2,96 64016 Banco Comercial Portuges, Portugal 2,96 1.66917 Banco De Sabadell, Spain 2,93 79218 Bank of Ireland, Ireland 2,91 1.97219 Danske Bank, Denmark 2,89 2.63920 UniCredito Italiano, Italy 2,87 6.51521 Bradford & Bingley, UK 2,84 68022 Banca Popolare di Verona, Italy 2,78 88923 Standard Chartered, UK 2,73 2.41924 Nordea, Sweden 2,70 3.84325 HSBC, UK 2,70 16.48426 BHW, Germany 2,69 59427 Banca Antonveneta Popolare, Italy 2,68 1.33828 Banca Lombarda e Piemontese, Italy 2,65 81929 Barclays, UK 2,62 11.33630 National Bank of Greece, Greece 2,59 1.38931 Sberbank, Russia 2,54 1.31032 Banca Popolare di Bergamo, Italy 2,50 91533 Commercial Bank of Greece, Greece 2,48 63034 Banca Monte dei Paschi di Siena, Italy 2,45 3.22035 BBV Argentaria, Spain 2,43 7.65936 Banco Espanol de Credito, Spain 2,42 98937 BNP Paribas, France 2,42 11.62638 Erste Bank, Austria 2,40 1.35039 Almanji, Belgium 2,39 4.10040 Sanpaolo IMI, Italy 2,33 3.84841 DZ Bank, Germany 2,30 2.11542 Credit Agricole, France 2,28 9.64443 Fortis, Belgium 2,20 7.17544 BSCH, Spain 2,15 8.45345 Espirito Santo Financial, Luxemburg 2,13 70246 Banquee Populaires, France 2,13 3.41847 Rabobank, The Netherlands 2,12 5.44448 SEB, Sweden 2,07 2.01549 HVB, Germany 2,04 6.39550 Banca Popolare di Novara, Italy 2,00 577Average intellectual capitalefficiency of the banking sectoris ICE=2,30Unfortunately, this efficiencyis not achieved by thebiggest banks creating thelargest amount of value added.Among the first 10 banks,according to the created valueadded, there are only 5which are more efficient thanthe average and three ofthem (ABN AMRO, TheNetherland, UBS and CreditSuisse, Switzerland, CreditAgricole, France) have such alow efficiency that they couldnot even make it on this listof 50 most efficient banks accordingto ICE.12
intellectual capitalICE - European Top 500 CompaniesRank Company Sector VA m ICE1 Ses Global, Luxembourg Media & photography 932 21,982 British Land, UK Real estate 632 18,623 Enterprise Oil, UK Oil & gas 1.798 18,17(now part of Shell)4 Land Securities, UK Real estate 823 11,195 BG, UK Oil & gas 2.066 9,056 Canary Wharf, UK Real estate 609 8,087 Gazprom, Russia Gas distribution 9.167 7,998 Shell, UK Oil & gas 28.186 7,949 International Power, UK Electricity 656 7,9210 Gas Natural, Spain Gas distribution 1.688 7,4511 Repsol YPF, Spain Oil & gas 10.187 7,1712 Vodafone, UK Telecommunications 16.755 6,7013 CNP Assurance, France Life assurance 899 6,6514 ENI, Italy Oil & gas 15.745 6,3215 Mediaset, Italy Media & photography 1.428 6,1816 Kelda, UK Water 723 6,1417 Northern Rock, UK Banks 544 5,8818 Western Power Distribution, UK Electricity 564 5,8719 ENDESA, Spain Electricity 6.206 5,8220 Railtrack (now RT), UK Transport 1.510 5,7621 Lonmin, UK Mining 647 5,7222 ASF, France Transport 1.318 5,7023 Češky Telekom, Telecommunications 1.052 5,47Czech Republic24 Imperial Tobacco, UK Tobacco 1.232 5,4725 Iberdrola, Spain Electricity 3.170 5,3726 CIMPOR, Portugal Construction & Building 636 5,3727 Eurotunnel, UK Transport 599 5,1428 Holcim, Switzerland Construction & Building 3.029 5,1029 Rio Tinto, UK Mining 4.700 5,0830 Scottish and Southern Electricity 1.633 5,03Energy, UK31 Electricidade de Portugal Electricity 2.288 4,9232 Sampo, Finland Insurance 1.598 4,7933 BP, UK Oil & gas 27.334 4,7634 WCM, Germany Real estate 797 4,6235 TotalFinaElf, France Oil & gas 23.231 4,6036 Gallaher, UK Tobacco 1.023 4,4837 Autostrade, Italy Transport 1.528 4,3638 Buzzi Unicem, Italy Construction & Building 602 4,2939 BHP Billiton, UK Mining 6.389 4,2440 PowerGen UK Electricity 2.019 4,2341 CEPSA, Spain Oil & gas 1.187 4,2242 HEW, Germany Electricity 2.266 4,1943 Lattice, UK Gas distribution 3.738 4,1444 United Utilities, UK Water 1.735 4,1245 Punch, UK Leisure & hotels 622 4,0846 Portugal Telecom, Portugal Telecommunications 2.496 4,0247 Benetton, Italy Household goods 716 3,9548 Innogy, UK Electricity 1.049 3,9449 John Swire, UK Transport 1.330 3,9450 South African Beverages Beverages 1.268 3,93(now SABMiller), UKRank Company Sector VA m ICE51 Norske Skogindustrier, Forestry & paper 1.622 3,92Norway52 Fortum, Finland Oil & gas 1.983 3,8153 Norsk, Hydro, Norway Oil & gas 6.866 3,7954 Verbund, Austria Electricity 857 3,7755 Telefonica, Spain Telecommunications 15.453 3,7656 Allied Domecq, UK Beverages 1.746 3,7657 Svenska Handelsbanken, Banks 1.862 3,76Sweden58 OMV, Austria Oil & gas 1.385 3,7559 BAT, UK Tobacco 6.826 3,7260 Lloyds, TSB, UK Banks 8.643 3,7261 Enel, Italy Electricity 10.460 3,7062 Alliance & Leicester,UK Banks 1.009 3,6763 Union Electrica Fenosa, Spain Electricity 2.059 3,6664 BAA, UK Transport 1.879 3,6365 Italgas, Italy Gas distribution 962 3,6366 Vattenfall, Sweden Electricity 3.657 3,5867 National Grid, UK Electricity 1.852 3,5568 D’Ietern, Belgium Support services 920 3,5169 HBOS, UK Banks 6.531 3,4770 Swisscom, Switzerland Telecommunications 4.430 3,4771 Telenor, Norway Telecommunications 3.644 3,4572 Holmen, Sweden Forestry & paper 673 3,4573 Nokia, Finland IT Hardware 8.071 3,4474 Telekom Austria, Austria Telecommunications 1.588 3,4075 Diageo, UK Beverages 5.402 3,4076 Nuon, The Netherlands Electricity 1.339 3,3877 Hellenic Telecommunications, Telecommunications 2.135 3,38Greece78 Italmobiliare, Italy Construction & Building 1.858 3,3879 P&O Princess Cruises, UK Leisure & hotels 729 3,3680 Olivetti, Italy Telecommunications 12.452 3,3681 SHV, The Netherlands Diversified industrials 1.489 3,3582 Banco Popular Espanol, Spain Banks 1.353 3,3483 Telia (now TeliaSonera), Telecommunications 3.668 3,33Sweden84 Telekomunikacja Polska, Telecommunications 2.428 3,31Poland85 Scottish Power, UK Electricity 2.971 3,3086 Man, UK Other finance 582 3,2887 Bewag, Germany Electricity 893 3,2888 DePfa, Germany Banks 644 3,2889 Cartiere Burgo, Italy Forestry & paper 572 3,2790 KPN, The Netherlands Telecommunications 5.302 3,2291 Saipem, Italy Oil & gas 893 3,2192 Aegon, The Netherlands Life assurance 5.926 3,2093 Interbrew, Belgium Beverages 2.991 3,1694 Severn Trent, UK Water 1.576 3,1595 Anglo American, UK Mining 6.715 3,1596 Dexia, Belgium Banks 3.755 3,1397 KirchMedia, Germany Media & photography 816 3,1398 ProSiebenSat1, Germany Media & photography 516 3,1399 Bank Pekao, Poland Banks 732 3,13100 George Wimpey, UK Construction & Building 512 3,1213
Rank Company Sector VA m ICE Rank Company Sector VA m ICE101 TF1, France Media & photography 709 3,12102 UPM-Kymmene, Finland Forestry & paper 3.758 3,11103 Reckit Benckiser, UK Personal Care 1.419 3,11104 INDITEX, Spain General Retailers 1.137 3,10105 Union Bank of Norway, Norway Banks 679 3,07106 Natinwide, UK Other finance 1.113 3,07107 Alpha Credit Bank, Greece Banks 910 3,05108 Altadis, Spain Tobacco 1.532 3,05109 Porsche, Germany Automobiles & parts 1.815 3,03110 Novartis, Switzerland Pharmaceuticals & 11.461 3,03biotechnology111 Allianz, Germany Insurance 18.941 3,03112 Royal Bank of Scotland, UK Banks 14.099 3,02113 Deutsche Telekom, Germany Telecommunications 27.335 3,02114 Cadbury Schweppes, UK Food procesors 2.804 3,02115 Taylor Woodrow, UK Construction & Building 610 3,01116 ForeningsSparenbanken, Banks 1.619 3,01Sweden117 Gaz De France, France Oil & gas 4.277 3,01118 AstraZeneca, UK Pharmaceuticals & 7.645 3,01biotechnology119 awg, UK Water 980 3,00120 Amadeus Global Travel, Spain Leisure & hotels 669 3,00121 Sanofi-Syntelabo, France Pharmaceuticals & 3.824 3,00biotechnology122 UCB, Belgium Pharmaceuticals & 1.306 2,99biotechnology123 DnB, Norway Banks 1.130 2,99124 Old Mutual, UK Life assurance 2.755 2,99125 Serono, Switzerland Pharmaceuticals & 765 2,98biotechnology126 Hermes International, France Household goods 596 2,98127 TDC, Denmark Telecommunications 2.749 2,97128 Montedison (now Edison), Italy Diversified industrials 3.038 2,97129 EFG Eurobank Ergasius, Banks 640 2,96Greece130 Electrabel, Belgium Electricity 3.347 2,96131 Banco Comercial Portuges, Banks 1.669 2,96Portugal132 Synthes-Stratec, Switzerland Health 776 2,94133 Banco De Sabadell, Spain Banks 792 2,93134 Pernord Ricard, France Beverages 1.322 2,92135 Lonza, Switzerland Chemicals 807 2,92136 Bank of Ireland, Ireland Banks 1.972 2,91137 Danske Bank, Denmark Banks 2.639 2,89138 Bertelsman, Germany Media & photography 5.042 2,88139 UniCredito Italiano, Italy Banks 6.515 2,87140 Parmalat Finanziaria, Italy Food procesors 1.905 2,84141 Yell, UK Media & photography 514 2,84142 Bradford & Bingley, UK Banks 680 2,84143 Stora Enso, Finland Forestry & paper 4.709 2,83144 Tate & Lyle, UK Food procesors 980 2,82145 L’Air Liquide, France Chemicals 3.371 2,82146 Swedish Match, Sweden Tobacco 552 2,81147 GlaxoSmithKline, UK Pharmaceuticals & 15.110 2,81biotechnology148 Richemont, Switzerland Household goods 1.809 2,78149 Helvetia Patria, Switzerland Life assurance 1.072 2,78150 Banca Popolare di Verona, Italy Banks 889 2,78151 Neckarwerke Stuttgart, Germany Electricity 662 2,78152 Hanson, UK Construction & Building 2.235 2,77153 Eircom, Ireland Telecommunications 1.052 2,76(now part of Valentia)154 MOL Hungarian Oil and Gas, Oil & gas 562 2,75Hungary155 Tchibo, Germany Food & drug retailers 1.483 2,75156 Barilla G & RF Llli, Italy Food procesors 660 2,75157 Heineken, The Netherlands Beverages 2.914 2,74158 Standard Chartered, UK Banks 2.419 2,73159 JC Decaux, France Media & photography 662 2,70160 Nordea, Sweden Banks 3.843 2,70161 HSBC, UK Banks 16.484 2,70162 Centrica, UK Gas distribution 2.621 2,70163 BHW, Germany Banks 594 2,69164 Banca Antonveneta Popolare, Banks 1.338 2,68Italy165 BMW, Germany Automobiles & parts 12.081 2,67166 Lafarge, France Construction & Building 5.057 2,67167 Carlsberg, Denmark Beverages 1.788 2,67168 Banca Lombarda e Piemontese, Banks 819 2,65Italy169 Altana, Germany Pharmaceuticals & 972 2,64biotechnology170 Roche, Switzerland Pharmaceutic. & biotech. 9.976 2,63171 Prudential, UK Life assurance 2.536 2,63172 Barclays, UK Banks 11.336 2,62173 Baloise, Switzerland Insurance 1.439 2,61174 Debenhams, UK General Retailers 653 2,61175 BOC, UK Chemicals 2.446 2,60176 National Bank of Greece, Greece Banks 1.389 2,59177 Sudzucker, Germany Food procesors 1.316 2,59178 Six Continents, UK Leisure & hotels 3.225 2,57179 Johnson Matthey, UK Chemicals 616 2,57180 Unilever, UK Food procesors 13.571 2,56181 Merial, UK Pharmaceuticals & 610 2,55biotechnology182 BT, UK Telecommunications 13.730 2,54183 Sberbank, Russia Banks 1.310 2,54184 H&M Hennes & Mauritz, Sweden General Retailers 1.340 2,53185 Nestle, Switzerland Food procesors 16.889 2,53186 Wittington Inestments, UK Food procesors 1.650 2,53187 Ashtead, UK Support services 560 2,53188 Heidelberger Zement, Germany Construction & Building 2.658 2,51189 ING Groep, The Netherlands Insurance 14.543 2,51190 Banca Popolare di Bergamo, Banks 915 2,50Italy191 MARZOTTO, Italy Household goods 586 2,50192 France Telecom, France Telecommunications 18.184 2,49193 Commercial Bank of Greece, Banks 630 2,48Greece194 Grupo Ferrovial, Spain Construction & Building 1.002 2,48195 Svenska Cellulosa, Sweden Forestry & paper 3.244 2,48196 Merloni Elettrodomestici, Italy Household goods 513 2,48197 Novo Nordisk, Denmark Pharmaceuticals & 1.835 2,47biotechnology198 Next, UK General Retailers 930 2,47199 Amvescap, UK Other finance 1.572 2,46200 Cable and Wireless, UK Telecommunications 3.234 2,4614
intellectual capitalRank Company Sector VA m ICE Rank Company Sector VA m ICE201 Motor-Columbus, Electricity 775 2,45Switzerland202 Giavudan, Switzerland Personal Care 755 2,45203 Banca Monte dei Paschi Banks 3.220 2,45di Siena, Italy204 Electricite de France, Electricity 15.370 2,44France205 RWE, Germany Diversified industrials 8.587 2,44206 Aare-Tessin, Switzerland Electricity 767 2,43207 Scotish & Newcastle, UK Beverages 1.923 2,43208 BBV Argentaria, Spain Banks 7.659 2,43209 Banco Espanol de Credito, Banks 989 2,42Spain210 Atlas Copco, Sweden Engineering & machinery 2.272 2,42211 BNP Paribas, France Banks 11.626 2,42212 BPB, UK Construction & Building 813 2,40213 Volkswagen, Germany Automobiles & parts 23.573 2,40214 Erste Bank, Austria Banks 1.350 2,40215 Emap, UK Media & photography 592 2,39216 Elisa Communications, Telecommunications 610 2,39Finland217 Almanji, Belgium Banks 4.100 2,39218 Numico, The Netherlands Food procesors 1.473 2,39219 Dyckerhoff, Germany Construction & Building 876 2,39220 Adidas-Salomon Household goods 1.233 2,39221 Aggregate Industries, UK Construction & Building 704 2,38222 Heraeus, Germany Diversified industrials 843 2,35223 Amersham, UK Health 1.112 2,35224 Energie Baden, Germany Electricity 2.809 2,34225 Coca-Cola HBC, Greece Beverages 1.023 2,33226 Rank,UK Leisure & hotels 900 2,33227 Sanpaolo IMI, Italy Banks 3.848 2,33228 Tesco, UK Food & drug retailers 6.212 2,32229 Swiss Life, Switzerland Life assurance 1.562 2,32230 Sol Melia, Spain Leisure & hotels 563 2,31231 Boots, UK General Retailers 2.611 2,31232 Wolters Kluwer, Media & photography 1.983 2,30The Netherlands233 DZ Bank, Germany Banks 2.115 2,30234 L’Oreal, France Personal Care 4.484 2,30235 Reed International Media & photography 3.581 2,29(now Reed Elsevier), UK236 Danone, France Food procesors 3.701 2,29237 Credit Agricole, France Banks 9.644 2,28238 E.ON, Germany Diversified industrials 15.326 2,27239 Glaverbel, Belgium Construction & Building 802 2,27240 Boehringer Ingelheim, Germany Pharmaceuticals & 3.230 2,26biotechnology241 Beiersdorf, Germany Personal Care 1.370 2,25242 Alliance UniChem, UK Health 807 2,25243 Compagnie Industriali Riunite, Diversified industrials 785 2,24Italy244 Societe BIC, France Household goods 674 2,24245 Dixons, UK General Retailers 1.408 2,24246 Smith & Nephew, UK Health 720 2,24247 Signet, UK General Retailers 770 2,22248 AceraIia, Spain Steel & other metals 1.050 2,22249 M-real, Finland Media & photography 1.796 2,22250 Marks & Spencer, UK General Retailers 3.059 2,21251 Rexam, UK Support services 1.596 2,21252 Fraport, Germany Transport 1.132 2,20253 Wm Morrison Food & drug retailers 1.123 2,20Supermarkets, UK254 Orkla, Norway Food procesors 2.234 2,20255 Fortis, Belgium Banks 7.175 2,20256 Hilton, UK Leisure & hotels 1.545 2,20257 Bunzl, UK Support services 823 2,19258 Suez, France Diversified industrials 13.648 2,17259 CRH, Ireland Construction & Building 3.321 2,16260 BSCH, Spain Banks 8.453 2,15261 Borealis, Denmark Chemicals 559 2,15262 Scania, Sweden Engineering & 1.795 2,15machinery263 Sonae SGPS, Portugal Food & drug retailers 1.256 2,14264 Merck, Germany Pharmaceuticals & 2.807 2,14biotechnology265 DSM, The Netherlands Chemicals 1.996 2,14266 IMERYS, France Construction & 937 2,13Building267 Trinity Mirror, UK Media & photography 797 2,13268 Espirito Santo Financial, Banks 702 2,13Luxemburg269 Jeronimo Martins, Portugal Food & drug retailers 597 2,13270 Banquee Populaires, France Banks 3.418 2,13271 Carrefour, France Food & drug retailers 10.530 2,12272 Rabobank, The Netherlands Banks 5.444 2,12273 Tessenerio, Belgium Chemicals 546 2,12274 Nutreco, The Netherlands Food procesors 623 2,12275 British Sky Broadcasting, UK Media & photography 673 2,11276 Draka, The Netherlands Electronic & electrical 583 2,11277 Istituto Finanziario Industriale, Automobiles & parts 14.121 2,11Italy278 Groupe Lagardere, France Media & photography 4.130 2,10279 P&O, UK Transport 1.423 2,10280 Ciba Specialty Chemicals, Chemicals 1.939 2,10Switzerlands281 Kemira, Finland Chemicals 700 2,09282 Telewest Communications, UK Telecommunications 797 2,09283 GUS, UK General Retailers 2.857 2,08284 Solvay, Belgium Chemicals 2.595 2,08285 Pinault Printemps-Redoute, General Retailers 5.843 2,08France286 BASF, Germany Chemicals 9.369 2,08287 Jefferson Smurfit, Ireland Forestry & paper 1.596 2,07288 Swatch, Switzerland Household goods 1.335 2,07289 SEB, Sweden Banks 2.015 2,07290 Rallye, France Food & drug retailers 3.573 2,06291 Colruyt, Belgium Food & drug retailers 592 2,06292 Franz Haniel & Cie, Germany Support services 2.165 2,06293 Huhtamaki, Finland Support services 827 2,06294 AREVA, France Diversified industrials 4.140 2,05295 Saint-Gobain, France Construction & 9.977 2,04Building296 Pirelli, Italy Diversified industrials 2.295 2,04297 HVB, Germany Banks 6.395 2,04298 CSM, The Netherlands Food procesors 935 2,03299 Safeway, UK Food & drug retailers 2.249 2,03300 Acciona, Spain Construction & Building 766 2,0315
Rank Company Sector VA m ICE301 Schering, Germany Pharmaceuticals & 2.329 2,03biotechnology302 Kerry, Ireland Food procesors 782 2,03303 Peugeot (PSA), France Automobiles & parts 11.615 2,02304 AXA, France Insurance 8.650 2,02305 Christian Dior, France Household goods 3.504 2,02306 Pilkington, UK Construction & Building 1.545 2,02307 Koninklijke Vopak, Support services 1.125 2,02The Netherlands308 Finmeccanica, Italy Aerospace & defence 2.785 2,02309 Arcadia, UK General Retailers 633 2,01310 Syngenta, Switzerland Chemicals 2.148 2,01311 Rentokil Initial, UK Support services 2.386 2,01312 Cobham, UK Aerospace & defence 524 2,01313 Vallourec, France Engineering & machinery 842 2,01314 Vivendi Universal, France Media & photography 17.933 2,00315 Arbed, Luxembourg Steel & other metals 3.314 2,00316 Linde, Germany Engineering & machinery 3.370 2,00317 Banca Popolare di Novara, Banks 577 2,00Italy318 ICI, UK Chemicals 3.015 1,97319 AMB Aachner & Munchener Life assurance 1.579 1,97(now AMB Generali), Germany320 Lex Service (now RAC), UK Support services 536 1,97321 AKZO Nobel, The Netherlands Chemicals 5.059 1,97322 Zodiac, France Aerospace & defence 660 1,97323 Essilor International, France Health 1.069 1,96324 ABN AMRO, The Netherlands Banks 11.312 1,96325 RMC, UK Construction & Building 2.029 1,96326 Fimalac, France Support services 689 1,95327 Bongrain, France Food procesors 743 1,95328 Wolseley, UK Construction & Building 2.342 1,95329 Julius Baer, Switzerland Other finance 640 1,94330 AGBAR, Spain Water 1.210 1,94331 Buderus, Germany Engineering & machinery 669 1,93332 Banca Popolare di Milano, Banks 630 1,93Italy333 Delhaize, Belgium Food & drug retailers 4.050 1,93334 Sainsbury, UK Food & drug retailers 4.271 1,93335 Sandvik, Sweden Engineering & 2.355 1,92machinery336 Koramic Building Products, Construction & Building 524 1,92Belgium337 Wacker-Chemie, Germany Chemicals 1.322 1,92338 mmO2, UK Telecommunications 1.269 1,92339 Independent News & Media, Media & photography 533 1,91Ireland340 Credit Lyonnais, France Banks 3.978 1,91341 Adecco, Switzerland Support services 2.456 1,91342 Etex, Belgium Construction & Building 1.540 1,90343 Hays, UK Support services 1.416 1,90344 Wella, Germany Personal Care 1.135 1,90345 Dimension Data, UK Software & IT services 522 1,90346 FCC, Spain Construction & Building 1.989 1,90347 DS Smith, UK Forestry & paper 572 1,90348 SSAB Svenskt Stal, Sweden Steel & other metals 629 1,90349 Arla Foods, Denmark Food procesors 1.112 1,90350 Zurcher Kantonalbank, Banks 552 1,89SwitzerlandRank Company Sector VA m ICE351 Accor, France Leisure & hotels 3.514 1,89352 Ahold, The Netherlands Food & drug retailers 11.682 1,88353 Allied Irish Banks, Ireland Banks 1.922 1,88354 VNU, The Netherlands Media & photography 2.734 1,88355 Preussag (now TUI), Leisure & hotels 4.150 1,88Germany356 Wienerberger Baustoffindustrie, Construction & Building 572 1,88Austria357 Smiths, UK Aerospace & defence 2.141 1,88358 Hunter Douglas, Construction & Building 747 1,88The Netherlands359 Societe Generale, France Banks 8.242 1,87360 SanomaWSOY, Finland Media & photography 616 1,87361 Assa Abloy, Sweden Engineering & 1.165 1,87machinery362 Caisse d’Epargne, France Banks 3.731 1,87363 Bayer, Germany Chemicals 11.118 1,86364 Eramet, France Steel & other metals 716 1,86365 Groupe SEB, France Household goods 552 1,85366 K+S, Germany Chemicals 723 1,85367 Outokumpu, Finland Steel & other metals 1.302 1,85368 Renault, France Automobiles & parts 7.018 1,84369 BUPA, UK Insurance 1.042 1,84370 Henkel, Germany Personal Care 3.763 1,84371 Bouyges, France Construction & Building 6.235 1,83372 SAP, Germany Software & IT services 4.051 1,83373 Linpac, UK Support services 513 1,83374 Trelleborg, Sweden Automobiles & parts 609 1,83375 Pechiney, France Steel & other metals 2.324 1,82376 Rautaruuki, Finland Steel & other metals 760 1,82377 UBS, Switzerland Banks 18.840 1,82378 Bohler-Uddeholm, Austria Steel & other metals 590 1,81379 Spirent, UK IT Hardware 564 1,81380 Douglas, Germany General Retailers 664 1,81381 Fresenius, Germany Health 3.167 1,80382 FKI, UK Engineering & 1.009 1,80machinery383 MAHLE, Germany Automobiles & parts 1.269 1,80384 Banca Popolare di Lodi, Italy Banks 553 1,80385 Bekaert, Belgium Engineering & 687 1,80machinery386 Voest Alpine Stahl, Steel & other metals 1.157 1,80Austria387 FLS Inudstries, Denmark Engineering & machinery 926 1,79388 Coop Switzerland, Food & drug retailers 2.229 1,79Switzerland389 Tomkins, UK Engineering & 1.952 1,79machinery390 Vedior, The Netherlands Support services 893 1,79391 West LB, Germany Banks 2.356 1,78392 Rexel, France Electronic & electrical 1.286 1,78393 Big Food, UK Food & drug retailers 694 1,77394 WH Smith, UK General Retailers 740 1,77395 Hagemeyer, The Netherlands Electronic & electrical 1.210 1,76396 BBA, UK Transport 742 1,76397 Sig, Switzerland Support services 617 1,76398 GKN, UK Automobiles & parts 2.276 1,76399 Sika Finanz, Switzerland Chemicals 530 1,76400 Granada, UK Media & photography 890 1,7616
intellectual capitalRank Company Sector VA m ICE Rank Company Sector VA m ICE401 Eureko, The Netherlands Life assurance 1.440 1,76 451 Migros Community, General Retailers 3.598 1,60402 Metro, Germany General Retailers 7.479 1,76Switzerland403 Grupo Dragados, Spain Construction & Building 1.776 1,76 452 B Braun Melsungen, Germany Health 1.215 1,60404 Thomson Multimedia, Electronic & electrical 2.264 1,75 453 Commerzbank, Germany Banks 3.827 1,60France454 Carl-Zeiss, Germany Health 1.933 1,60405 CGNU (now Aviva), UK Life assurance 4.298 1,74 455 TietoEnator, Finland Software & IT services 729 1,60406 RHM Group One, UK Food procesors 949 1,74 456 Wurth, Germany Diversified industrials 1.799 1,59407 Reuters, UK Media & photography 2.961 1,74 457 Danka Business Systems, UK Support services 633 1,59408 Jungheinrich, Germany Engineering & machinery 644 1,73 458 Stagecoach, UK Transport 1.636 1,59409 Heidelberger Druckmaschinen, Engineering & machinery 2.118 1,73 459 Rhodia, France Chemicals 1.951 1,59Germany460 Rolls-Royce, UK Aerospace & defence 3.128 1,58410 Autogrill, Italy Leisure & hotels 1.376 1,73461 Bankgesellschaft Berlin, Banks 1.215 1,58411 Co-operative Group (CWS), UK Diversified industrials 1.310 1,72Germany412 Robert Bosch, Germany Automobiles & parts 13.127 1,71 462 JM Volth, Germany Diversified industrials 1.375 1,57413 Clariant, Switzerland Chemicals 2.122 1,71 463 Buhrman, The Netherlands Support services 1.712 1,57414 Austrian Airlines, Austria Transport 564 1,71 464 MG Technologies, Germany Engineering & 2.441 1,57415 ACS, Spain Construction & Building 1.140 1,71machinery416 SKF, Sweden Engineering & machinery 2.139 1,71 465 Air France, France Transport 4.601 1,57417 Galeries Lafayette, France General Retailers 1.105 1,71 466 Altran Technologies, France Software & IT services 949 1,57418 Northern Foods, UK Food procesors 843 1,70 467 Panalpina World Transport, Transport 627 1,57419 Knorr-Bremse, Germany Engineering & machinery 539 1,70Switzerland420 British Airways, UK Transport 3.973 1,70421 Whitbread, UK Leisure & hotels 1.180 1,69422 Misys, UK Software & IT services 639 1,69423 Bayerische Landesbank Banks 895 1,69Girozentrale, Germany424 Hilti, Liechtenstein Construction & Building 1.083 1,68425 First Choice Holidays, UK Leisure & hotels 513 1,68426 Banka di Roma Banks 2.015 1,68(now Capitalia), Italy427 Otto Versand, Germany General Retailers 2.381 1,68428 Freudenberg, Germany Diversified industrials 1.642 1,67429 Partek, Finland Engineering & machinery 657 1,66430 Karstadt Quelle, Germany General Retailers 4.060 1,66431 Royal Volker Wessels Stevin, Construction & Building 809 1,66The Netherlands432 Airtours, UK Leisure & hotels 1.035 1,66433 Rieter, Switzerland Engineering & machinery 783 1,66434 Imtech, The Netherlands Support services 656 1,65435 BAE Systems, UK Aerospace & defence 5.515 1,64436 Gambro, Sweden Health 1.276 1,64437 London Transport, UK Transport 1.246 1,64438 IMI, UK Engineering & 965 1,63machinery439 ZF, Germany Automobiles & parts 2.374 1,63440 Electrolux, Sweden Household goods 3.734 1,63441 Behr, Germany Automobiles & parts 669 1,63442 Kuehne & Nagel International, Transport 829 1,62Switzerland443 VINCI, France Construction & Building 5.562 1,62444 SAAB, Sweden Aerospace & defence 976 1,62445 Royal Vendex KBB, General Retailers 1.113 1,62The Netherlands446 Kamps, Germany Food procesors 599 1,61447 Michelin, France Automobiles & parts 6.569 1,61448 Littlewoods, UK General Retailers 532 1,61449 TNT Post (now TPG), Support services 4.800 1,61The Netheralands450 EADS, The Netherlands Aerospace & defence 8.587 1,61468 Skandia, Sweden Life assurance 733 1,56469 FirstGroup, UK Transport 1.779 1,56470 Danfoss, Denmark Engineering & machinery 802 1,56471 Bau Holding Strabag, Austria Construction & Building 747 1,55472 Georg Fischer, Switzerland Engineering & machinery 969 1,55473 Thyssen Krupp, Germany Engineering & machinery 11.811 1,55474 Deutsche Post, Germany Support services 13.687 1,55475 WPP, UK Media & photography 4.251 1,55476 Metso, Finland Engineering & machinery 1.449 1,55477 Bollore Investissement, Transport 773 1,55France478 Arriva, UK Transport 1.146 1,54479 Continental, Germany Automobiles & parts 3.478 1,54480 DaimlerChrysler, Germany Automobiles & parts 30.336 1,53481 Krones, Germany Engineering & machinery 519 1,53482 Koninklijke Wessanen, Food procesors 680 1,53The Netherlands483 Celanese, Germany Chemicals 1.429 1,53484 Credit Suisse, Switzerland Banks 18.165 1,53485 Thales, France Aerospace & defence 4.284 1,53486 John Lewis, UK General Retailers 1.442 1,53487 Morgan Crucible, UK Engineering & machinery 706 1,53488 ICAP, UK Other finance 597 1,52489 Coats, UK Household goods 660 1,52490 Nexans, France Electronic & electrical 1.026 1,52491 Lufthansa, Germany Transport 5.373 1,52492 FAG Kugelfischer Georg Engineering & machinery 940 1,52Schafer, Germany493 RAG, Germany Diversified industrials 5.802 1,51494 Rheinmetall, Germany Engineering & 1.808 1,51machinery495 Finnair, Finaland Transport 577 1,51496 Pearson, UK Media & photography 2.266 1,51497 Kone, Finland Engineering & machinery 1.386 1,50498 Volvo, Sweden Engineering & machinery 4.353 1,49499 AVA, Germany General Retailers 786 1,49500 Publicis, France Media & photography 1.612 1,4917
Intellectual Capital – Key Resource ofModern EconomyIn the process of monitoring international trends, the CroatianChamber of Economy actively supports,encourages and promotesthe methods and systems that facilitateCroatian economy to facethe challenges of the new, knowledge-based economy effectively.This unique and comprehensiveanalysis of measuring value creationefficiency on national, regionaland corporate level is one ofthe key economic initiatives, sinceit supports the necessary orientationof Croatian economy towardsvalue creation and increasing theoverall efficiency of Croatian economy,which would make it competitivein global terms.With the aim to add additionalimpetus to Croatian economy andencourage it to pay more attentionto the significance of intellectualcapital, the key resource ofpresent-day economy, the CroatianChamber of Economy decidedto publish this brochure for thesecond year.Publishing this brochure for thesecond time in a relatively shortperiod puts Croatia on the list ofvery few countries that have systematicallyand continuously embarkedon analysing the performanceof national intellectualcapital. So far only four countrieshave carried out such an analysis,and they have done it only once.The only exception is Ministry ofTrade and Industry in Great Britain,which has already twice produceda similar analysis, publishedunder the title «The ValueAdded Scoreboard».Moreover, this analysis for 2002shows that Croatian economymanages to perform efficientlyand successfully in global terms.This is clearly indicated by highefficiency level of Croatian bankingsector, which is, indeed, higherthan the European average.The leading Croatian companiessuch as Pliva and INA show similarefficiency as their Europeancounterparts and competitors.Finally, Croatian branch offices offoreign companies clearly indicatethat in terms of efficiency they byno means lag behind their parentcompanies.This intellectual capital efficiencyanalysis is useful for all theplayers in economy: companies -since they can orient themselvesbetter in their business environment,managers and employeessincethey gain insight into valuecreation potential, state – to pinpointthe sectors and areas whichare leading in the national economy.This is why the CroatianChamber of Economy has startedto implement this analysis in itscounty chambers.In order to contribute to growthin efficiency of companies all overCroatia, measuring has been supportedby systematic educationand popularisation of the IC issueamong economic subjests.Nadan Vidošević,President of CroatianChamber of EconomyIntellectual Capital – New Moving Force ofBusiness in Croatian Forests Ltd.Managing the company thatemploys over ten thousandemployees – Croatian Forests Ltd– implies continuous reexaminationhow the company one managesshould be led, how successfulit is or should be, what kind ofclients it has or should have, howmuch is invested in new technologiesand to what extent it affectsthe performance and efficiency ofthe organization and finally, howcompetitive the company is withregard to its environment. Theanswers are not always easy or satisfactory,but they do warn usabout our weaknesses and serve asguidelines for future activities.However, the role of the manageris only to run a company, andits core, energy and strength areits employees, their knowledgeand experience that represent thecompany’s intellectual capital.Until recently hardly anyonethought about intellectual capitalor discussed its importance – performanceand efficiency of a companywas measured by figures, ratiobetween earnings and costs,while knowledge and initiative ofthe employees was welcome, althoughnot measured or evaluated.This era is approaching itsend. Nowadays the employees areencouraged to use their knowledgeand expertise to create value,and the objective of each companyis to refine and leverage itsabilities in the long term.Therefore the company CroatianForests Ltd. has already embarkedon the project of organizing lecturesand workshops to raise awarenessamong the employees of theimportance of this intangible resource– intellectual capital. Financecapital of Croatian ForestsLtd, a state-owned company, isfixed, but intellectual capital ofthe company is huge, which doesnot mean that its potential cannotbe further increased. As a result ofthis exceptional knowledge baseand efforts all the employees in theforestry sector have been makingin the past 250 years of organizedforestry and sustainable managementof forests, today we can prideourselves in having probably themost precious resource of all – naturalforests.Željko Ledinski,Chairman of the Board in CroatianForests Ltd., B. Sc.(Forestry)18
ICE – National Report of Croatiaintellectual capitalThe following pages shall demonstratewhat an IC efficiencyanalysis of a nation can looklike.Until now countries have benchmarkedthemselves by GDP percapita, and the following graphshows such a comparison.The result, in this case double theGDP p/c in Slovenia, would create acertain picture of capabilities ofboth countries’ economies, namelythat the Croatian economy is twiceas weak as the Slovenian one, withall the implications that such a conclusionbrings forth.The IC Efficiency analysis presentsan utterly different picture ofCroatia’s and Slovenia’s economiccapabilities.As we can see, in these two countrieswhich economies are more orless equally efficient in terms of utilizingintellect. Moreover, in someperiods – 1997, 1998 i 2001 – theICE of Croatian economy was evenabove the Slovenian (please notethat in the entire period Slovenia’sGDP was double the Croatian).Knowing both economies well, itcan be said that the result receivedby the ICE analysis is much closerto reality than the one implied byGDP.While creating an intellectual capitalbalance sheet, it is important tostart with the economic environmentin which it operates. In this case itmeans ICE benchmarking withneighbouring countries. According tothe results (see chart below) we cansee that they perform at similiar ICefficiency levels as Croatia.The following step is detailedanalysis of ICE within a nationaleconomy.19
Croatian Economy in 2002The following analysis coverseconomy that creates slightlymore than 60 % of the totalvalue added in Croatia (therest is generated in nonmaterial activitiessuch as health service, education,science, administration ofjustice, the police and the army). Incomparison to the previous year, valueadded rose slightly (about 8,8 %).However, the cause of considerableconcern is the fact that there was asignificant fall in value creation efficiencyin economy. This in turnmeans that more resources wereemployed to realize it.As we can see in the graph, in theyear 2002, after two years of steadyrise, there was a fall in IC efficiency.Until that year IC efficiency washigher than GDP per capita growth.This kind of analysis thereforewarns us that in 2002 Croatian economydid not perform as successfullyas we might think based on officialsources available. Anyone who isgood at calculating will reach thesame conclusion: GDP per capitagrowth is only the result of the lowexchange rate of US dollar, and it isby no means proof of efficiency ofCroatian economy. If we take thecorrected exchange rate of Americandollar, then there is a significant fall,as well as in efficiency.Eight of the 17 sectors listed inthe table create 94 % of value inCroatian economy, but value creationis not evenly distributed evenamong them. The first four are thebackbone, since they create 75 % ofvalue added, and can be said to beprime movers that fuel the Croatianeconomy. However, there are significantdifferences even among them:in comparison to previous year theshare of industry in value added increasedby only 2 %, while the shareof trade rose by 23 % and transportby 19 %. Furthermore, these twosectors, along with electricity, gasand water supply are the only sectorswhose efficiency is above theCroatian average. Industry, constructionbusiness and servicessomewhat lag behind this average,although in the years to come it isrealistic to expect them to reach thenational average. What particularlyworries in the results of this analysisis the very low efficiency in the sectorof “hotels and restaurants” (tourismindustry). With regard to theavailable resources, this sector hasfar too small a share in Croatian economy,and its efficiency just managedto reach the level it had in 1996after several years of declining. If wetake into account the potentials oftourism industry it is certainly anarea that is bound to grow and increaseboth its value creation and itsefficiency in order to “pull forward”other sectors, first and foremost agriculture.County of Istria reached the firstposition on the list, even though valuecreation efficiency of its economyremained the same as in 2001.Economy of the City of Zagreb,which creates more than a half oftotal value, remained on the secondposition, although it also witnesseda decrease in efficiency. County ofZagreb changed its ranking andTrends 1996 - 2002Value Creation in CroatiaVA 2002 VA 2001 ChangeEconomy 86.565 79.549 8,8Other 57.300 57.318 0,0Total 143.865 136.867 5,11996 1997 1998 1999 2000 2001 2002GDP p/c VAIC TM GDP corig.20
intellectual capitalRank Sectors VA share % VAIC1 INDUSTRY 27.489.245 31,7 2,302 RETAILERS 17.602.136 20,3 2,643 TRANSPORT 13.474.677 15,6 2,734 CONSTRUCTION ANDBUILDING 6.845.130 7,9 2,195 SERVICES 5.709.078 6,6 2,286 ELECTRICITY,OIL AND GAS 4.548.508 5,3 2,787 LEISURE & HOTELS 2.972.246 3,4 1,998 AGRICULTURE ANDFORESTRY 2.330.033 2,7 1,599 KEY SECTORS 80.971.053 93,5ECONOMY TOTAL 86.565.471 100,00 2,39reached the third position,but it remained at the sameefficiency level as in 2001.This is mainly due to the factthat there has been a fall inefficiency of total Croatianeconomy.County of Lika-Senj maderelatively the most significantstep forward, since it increasedits value creation efficiencyby 1 kuna in comparison to the previousyear and improved its rankingfrom last position to 14 th . Comparedto previous year’s results, County ofVukovar-Srijem achieved the mostsignificant progress in terms of createdvalue added and also increase inefficiency.In 2002 in the County of Karlovacthere was a significant fall in valuecreation efficiency, which resultedin its fall from the first position to13 th . The same thing happened inCounty of Virovitica-Podravina,which is presently at the very bottomof the ranking. It is also difficultto explain the position of Countyof Dubrovnik-Neretva, withregard to the rich resources at itsdisposal.As with the analysis according tosectors, value creation is concentratedin very few counties. In additionto the City of Zagreb, there are fivecounties that account for almost 80% of overall value added created in2002. Therefore we could concludethat the future of Croatian economyis currently reduced to only four sectors,the City of Zagreb and fivecounties. This need not necessarilybe negative if the leaders of thecountry are aware of that. However,this issue should be dealt with separately.Rank County VA VAIC change to 20010 NATIONAL INDEX OF CROATIA 86.565.471.425 2,39 -0,051 18. ISTARSKA ŽUPANIJA 5.557.831.660 2,70 02 21 GRAD ZAGREB 45.579.808.800 2,64 -0,093 01 ZAGREBAČKA ŽUPANIJA 3.835.504.222 2,64 04 13 ZADARSKA ŽUPANIJA 1.205.918.136 2,58 0,095 05 VARAŽDINSKA ŽUPANIJA 2.672.096.807 2,36 0,086 06 KOPRIVNIČKO-KRIŽEVAČKA ŽUPANIJA 1.800.606.626 2,20 0,067 14 OSJEČKO-BARANJSKA ŽUPANIJA 3.425.649.243 2,19 0,138 02 KRAPINSKO-ZAGORSKA ŽUPANIJA 1.224.266.217 2,16 0,029 20 MEĐIMURSKA ŽUPANIJA 1.559.143.276 2,15 -0,1210 07 BJELOVARSKO-BILOGORSKA ŽUPANIJA 1.127.877.853 2,13 0,3511 12 BRODSKO-POSAVSKA ŽUPANIJA 1.041.127.864 2,12 0,3412 17 SPLITSKO-DALMATINSKA ŽUPANIJA 5.326.520.778 2,04 0,2013 04 KARLOVAČKA ŽUPANIJA 1.519.829.417 2,03 -0,7714 09 LIČKO-SENJSKA ŽUPANIJA 302.818.343 2,03 1,0015 08 PRIMORSKO-GORANSKA ŽUPANIJA 4.832.620.523 1,97 -0,0816 16 VUKOVARSKO-SRIJEMSKA ŽUPANIJA 1.268.840.669 1,95 0,3217 11 POŽEŠKO-SLAVONSKA ŽUPANIJA 613.970.003 1,81 -0,2018 19 DUBROVAČKO-NERETVANSKA ŽUPANIJA 1.281.807.842 1,67 -0,1619 03 SISAČKO-MOSLAVAČKA ŽUPANIJA 1.132.243.652 1,60 -0,2820 15 ŠIBENSKO-KNINSKA ŽUPANIJA 710.260.093 1,57 0,2021 10 VIROVITIČKO-PODRAVSKA ŽUPANIJA 546.729.401 1,56 -0,3021
Top 400How Efficient are the Big Players?Year VA TOP 400 VA economy Share TOP 4002001. 51 mlrd. 79,5mlrd. 64%2002. 44 mlrd. 86,5 mlrd. 51%As we can see, in 2002the value added createdin this group ofcompanies fell dras-tically. It might be comforting toadd that there was a similar trendwith 600 major European companies,which is just another proof thatit is the same process on large scale.Furthermore, there is a marked fallin the share of top 400 companies inthe total value added created inCroatian economy.However, what worries most is anothernegative trend. Namely, valuecreation efficiency of intellectualcapital has also fallen reaching thelowest level – below its 1996 level.That means that for one kuna investedin resources –intellectualcapital – less value is created than in1996. The cause for this condition isthe fall of IC efficiency.While discussing the issue of reducingthe amount of value creationin top Croatian companies, we haveto point out that this is also happeningto many famous internationals.It is quite difficult to comment onsuch results and keep a sense of perspective,therefore just a brief comment.A decrease in value creationefficiency does not necessarily haveto be treated as a negative trend if itoccurs one or two consecutive years.This is generally the result of optingfor long-term investment. However,if there is a fall in value added inseveral consecutive years, followedby a fall in intellectual capital efficiency,it is sure that the company is“going down”. Several companies onthe list are on such a way.ResultsSimilar to last year, the largestCroatian companies have been dividedinto three categories. The basiccriterion was value added. As we havealready said, value creation is key objectiveof companies in modern economy,and it is therefore logical to takeit as a basis for benchmarking. On theother hand, the amount of value addedshould not be the only criterion,since it is even more important howefficiently this value is created, thatis, how much value is created on eachkuna invested in resources – intellec-tual and financial capital.According to thissecond criterion – efficiency– we haveevaluated the companieswithin eachgroup. The list ofcompanies that areshown in the followingtable representthe top companies ofCroatian economy becauseof the amountof value created andremarkable value creationefficiency.The first eight companieshave shownoutstanding efficiency,while only the last two ones arebelow the Croatian average level(VAIC = 2,39). The company VIP-NET (mobile phone operator) managedto increase its value added byCompanies that Created Less Valuethan last YearRank Company m kunas1 LURA -802 EUROPAPRESS -693 ATLAS -534 DINERS -535 VEČERNJI LIST -466 COCA COLA -427 FRANCK -368 TISAK -369 CEDEVITA -3310 LRH OPATIJA -3011 MEDIKA -2812 EXPORTDRVO -20THE FIRST GROUP consists of the companies that created more than 450million value added in 2002. The following table shows their efficiency:Rank Rank Company VA VAICReven.1 8 VIPNET d.o.o. 1.069.569.508 7,522 10 TVORNICA DUHANA ROVINJ d.d. 618.743.763 6,903 2 HT - HRVATSKE TELEKOMUNIK 4.975.197.498 5,244 23 CROATIA AIRLINES d.d. 455.604.242 3,615 4 PLIVA d.d. 1.374.279.316 3,566 1 INA-INDUSTRIJA NAFTE d.d. 2.637.814.837 3,387 15 ERICSSON NIKOLA TESLA d.d. 523.500.605 3,178 3 HRVATSKA ELEKTROPRIVREDA 1.494.106.070 3,009 21 HEP- DISTRIBUCIJA d.o.o. 729.861.122 2,3010 19 HP d.d. 1.102.616.336 2,0622
intellectual capitalTHE SECOND GROUP consists of the companies that create more than100 million value added. Here are the most efficient ones:Rank Rank Company VA VAICReven.1 142 PLINACRO d.o.o. 253.790.643 14,072 194 RONHILL d.o.o. 162.024.888 11,583 30 RENAULT HRVATSKA d.o.o. 107.972.585 10,554 121 CHROMOS AGRO d.d. 144.693.686 9,815 48 TANKERSKA PLOVIDBA d.d. 205.477.104 7,566 101 NAŠICECEMENT d.d. 228.207.226 6,587 46 ZAGREBAČKA PIVOVARA d.d. 434.143.028 6,218 13 P.Z. AUTO d.o.o. 101.915.645 5,869 129 PBZ AMERICAN EXPRESS 205.803.006 5,7610 159 TVORNICA DUHANA ZAGREB 127.937.004 5,6811 107 FLIBA d.o.o. 101.520.882 5,6412 138 SAMOBORKA d.d. 116.360.269 5,6313 72 ŽITO d.o.o. 104.274.904 5,5914 108 JANAF, d.d. 225.664.311 5,4115 163 TC KOROMAČNO d.o.o. 120.959.624 4,7716 67 BELUPO LIJEKOVI I KOZMETIKA 287.677.548 4,2917 99 DM-DROGERIE MARKT d.o.o. 101.486.432 3,9518 39 PEVEC d.o.o. 120.740.270 3,9119 105 GAVRILOVIĆ d.o.o. 128.716.415 3,8720 45 DALMACIJACEMENT-RMC GROUP 271.594.555 3,76THIRD GROUP is the most interesting one. It includes all the companies thatcreate up to 100 million value added. It is interesting since it always includesthe most efficient companies, although with continual oscillations. Genuinesurprise not only in this group, but in entire Croatian economy is definitely MIBraća Pivac. Here is the list for 2002:Rank Rank Company VA VAICReven.1 131 MESNA IND. BRAĆA PIVAC d.o.o. 96.960.530 11,422 283 STROJOPROMET-ZAGREB d.o. 40.680.606 10,203 32 AGROKOR-TRGOVINA d.d. 60.693.301 9,854 306 COMPUTECH d.o.o. 26.165.866 9,185 74 M-SAN GRUPA d.o.o. 58.684.239 9,136 172 MOBIS ELECTRONIC d.o.o. 30.603.330 8,937 335 DUMA KOŽE d.o.o. 28.461.700 8,078 157 VETERINARIA d.o.o. 79.005.478 7,309 302 UGO OPREMA d.o.o. 44.667.867 7,2410 192 JADROPLOV d.d. 51.498.832 7,2111 77 PEUGEOT HRVATSKA d.o.o. 36.651.025 7,1412 37 BENETTON CROATIA d.o.o. 91.351.411 6,2313 65 MEDICAL INTERTRADE d.o.o. 82.453.597 5,8714 284 PRVA SPORT. KLADIONICA d.o.o. 96.127.994 5,8615 210 TERMOCOMMERCE d.o.o. 37.638.317 5,7716 243 WIENERBERGER ILOVAC d.d. 87.951.549 5,7017 145 ŠPORT TIP d.o.o. 53.151.114 5,6118 217 ELEKTROMAGIC d.o.o. 17.092.206 5,6019 141 MINACO d.o.o. NAŠICE 27.291.404 5,5820 56 OKTAL PHARMA d.o.o. 68.641.753 5,2937 %, while HT (Croatian Telecom)increased it by 14 %.What is interesting is the fact thatboth these companies have higher intellectualcapital efficiency than theirparent companies. Thus TelekomAustria has VAIC 3,84 (Vodafone=7,14).Deutsche Telekom, coownerof HT has efficiency of 3,34.Similarly, Ericson Nikola Tesla is farmore successful in its performancethan its parent company in Sweden,which operated at a loss last year.Moreover, in terms of efficiency Plivais better than two of the largestpharmaceuticals in Europe (accordingto value added) – Novartis andRoche- that have efficiency level of3,16 and 2,77. INA (gas and petroleum)is just slightly less efficientthan the Austrian competitor OMV –3,95. Tvornica duhana Rovinj (tobaccoindustry) is far more efficient thanthe largest European company in thesame business - BAT, which has efficiencylevel of 3,92. The exampleswe have just mentioned clearly illustratethat the leading Croatian companiescan hold their own with theEuropean competition.The table clearly shows that all ofthem perform well above Croatianaverage. Most of them are well-knownnames from last year’s report.From this group we should especiallypoint out Plinacro, Cromos Agro andNašicecement, the companies thatmanaged to increase not only valueadded, but also their efficiency.The companies Tankerska plovidbaand P.Z. Auto created less valuein comparison to previous year, andtherefore their efficiency decreasedas well. Nevertheless, their efficiencywas and still is high enough to remainon the list of best companies.It is interesting to note that thecategory of most efficient companiesincludes all three Croatian cementplants, two of them being newon the list – TC Koromačno andDalmacijacement. Newcomers arealso the chain of stores DM, Pevecand Renault Croatia.23
BanksThe new image of banking sectorThe results of value creation inCroatian banks are quite differentfrom those in economy.In spite of the fact that in2002 there was a sharp fall amongthe top 400 companies, the banksmanaged to create more than 6,7 billionvalue added, which representsa 45 % increase on previous year.Likewise their value creation efficiencyincreased by almost 20 %(Croatian average VAIC = 3,67).Moreover, the efficiency of Croatianbanking sector is significantly higherthan European average (see table).General overview of efficiencyof Croatian banks isdivided into three sections.below the average. Since all thesebanks were acquired by foreign capital,it is encouraging to compare theefficiency of their Croatian brancheswith the parent company.Privredna banka, for instance, performsalmost three times more efficientlyand Splitska banka twice asefficiently as their parent companies.Zagrebačka banka is slightlyabove, while Erste is slightly belowthe efficiency level of their parentcompanies.The most efficient bank in thesecond group, and at the same timethe most successful bank in Croatiais Štedbanka. For sixth consecutiveyear this bank has the highest efficiencylevel in the whole sector. TheTHE FIRST GROUP consists of the banks disposing with stock capital exceedingone billion kuna. Until recently the situation was relatively stable, since only two majorCroatian banks managed to exceed this limit. However, the mergers that have takenplace this year have changed the situation and it has become more interesting –therefore the results for 2002 have been presented consolidated.Rank Bank VA VAIC1 SPLITSKA BANKA mem. HVB Group 564.833.000 4,642 PRIVREDNA BANKA ZAGREB 1.536.000.000 4,183 ZAGREBAČKA BANKA 2.150.000.000 3,394 ERSTE & STEIERMARKISCHE 394.829.000 2,70In the first group the leading bankis Splitska banka, which is hardlysurprising since there was a mergerof two already successful institutions(Hypo Vereinsbank and SplitskaBanka). Privredna banka continuesto have a significant rise in valueadded and a moderate increase inefficiency, as well as Zagrebačkabanka, which in spite of this trend,still lags behind in terms of efficiency.The Erste & SteiermarkischeGroup has also fallen in ranking,which is partly what could be expectedif we consider the case offormer Riječka banka. Comparingefficiency of these banks withCroatian average in that sector, it isobvious that both the banks performmajor surprise of the year is Hrvatskapoštanska banka, which prides itselfin highest increase percentage,a real boom in terms of value addedand a significant increase in valuecreation efficiency. This only showsthat the Croatian-owned banks cankeep up with the foreign-ownedbanks. In addition to this, it provesthat there was no need for the massivesale of Croatian banks.In the second group Hypo Alpe-Adria bank fell from the first to thethird position. After three years ofdramatic growth, when value addedwas doubling every year, the bank isnow facing a much quieter period.It remains to be seen how the situationwill be developing in the future.24
intellectual capitalTHE SECOND GROUP consists of the banks disposing with stock capital rangingfrom 200 to 999 million kuna. The situation in this group has become simpler, sincefour banks have changed the category.Rank Bank VA VAIC1 ŠTEDBANKA 34.342.000 6,532 HRVATSKA POŠTANSKA BANKA 130.875.000 4,553 HYPO ALPE-ADRIA BANK 254.151.000 4,314 VARAŽDINSKA BANKA 167.645.000 3,915 RAIFFEISEN BANK AUSTRIA 441.639.000 3,856 RIADRIA BANKA 68.449.000 3,71Varaždinska banka is still performingwell in comparison to its competitorsin this group, with a slightincrease in value added and the efficiencyequal to last year. The bankthat had the most dramatic decreaseTHE THIRD GROUP consists of the banks with stock capital under 200 million kunas.Rank Bank VA VAIC1 CASSA DI RISPARMIO TRIESTE 46.281.000 5,932 CENTAR BANKA 32.049.000 3,533 PARTNER BANKA 30.306.000 3,094 VOLKSBANK 59.954.000 2,725 KREDITNA BANKA ZAGREB 21.447.000 1,966 CROATIA BANKA 49.112.000 1,76Efficiency of top European banksIn order to get a clear picture about efficiency of banking sector in Croatiawe have analysed several major European banks.Bank VA mil. VAICUBS Switzerland 19117 2,30HSBC UK 16726 3,18BNP Paribas France 11797 2,90UniCredito Italy 6611 3,35HVB Germany 6489 2,52Intesa Italy 4523 1,83Erste Bank Austria 1370 2,88Sberbank Rusia 1330 3,02Bank Pekao Poland 742 3,61Average the biggest 70 in Europe 2,78in efficiency in comparison to previousyear is Raiffeisenbank Austria.In spite of this trend, this bank isstill performing more efficientlythan the parent company, which hasefficiency of 3,77 – a fall in efficiencyin comparison to previous year.Finally, Riadria bank has gone up forone position, increasing both its valueadded and efficiency.The leader of third group is Casadi Risparmio Trieste with significantincrease in value added and valuecreation efficiency. The next ones onthe list are Centar banka and Partnerbanka, performing well belowthe first one on the list, althoughboth of these banks recorded growthaccording to both criteria applied inthis analysis. There was a fall in rankingin the efficiency of Volksbankcompared to previous year – while itwas above the average efficiency ofthe banking sector, now it performsbelow. The average another reasonfor worry is the situation in Croatiabanka – this bank halved its valuecreation compared to previous year,which was also followed by a significantfall in efficiency.25
The City of Zagreb – the capital of Croatia3,002,502,001,501,000,500,001996. 1997. 1998. 1999. 2000. 2001. 2002.CroatiaZagrebThe companies that operate in theCity of Zagreb region create 53 % oftotal value added created in Croatianeconomy. Bearing that fact inmind, the results for 2002 are hardlysurprising. Due to the fall in efficiencyof the companies based inZagreb, the overall efficiency ofCroatian economy decreased. Manycompanies that significantly affectgeneral trend created less value in2002 than a year earlier. All but onecompany from the Croatian top 400list which created less value addedthan the year before being fromZagreb.Another problem of the economyof Zagreb are the companies that arestill owned by the city. According totheir strength – available resources,financial and intellectual capital,generated income- this group consistsof 10 leading Croatian companies.Their efficiency continues tobe a problem which, with regard totheir overall strength and influence,has significant negative impact onoverall performance of the economyof the City.With the exception of Gradska plinara(gas provider), all the companieshave fallen in efficiency comparedto previous year. They createvalue at the rate below Zagreb average,many of them below Croatianaverage level, thereby decreasingthe efficiency of whole Croatianeconomy in this region. It is difficultto comprehend that such a situationin this extremely important segmentis still tolerated.Talking about this type of companies,it is important to point out thatthe state-owned companies are farmore successful than those ownedby the City of Zagreb. Therefore itcould be said that INA (oil and gas),HEP (electricity provider), CroatiaAirlines, JANAF (oil distribution)Rank Rank Rev. Company VA VAIC1 142 PLINACRO d.o.o. 253.790.643 14,072 30 RENAULT HRVATSKA d.o.o. 107.972.585 10,553 32 AGROKOR-TRGOVINA d.d. 60.693.301 9,854 121 CHROMOS AGRO d.d. 144.693.686 9,815 306 COMPUTECH d.o.o. 26.165.866 9,186 74 M SAN GRUPA d.o.o. 58.684.239 9,137 172 MOBIS ELECTRONIC d.o.o. 30.603.330 8,938 335 DUMA KOŽE d.o.o. 28.461.700 8,079 8 VIPNET d.o.o. 1.069.569.508 7,5210 157 VETERINARIA d.o.o. 79.005.478 7,3011 302 UGO OPREMA d.o.o. 44.667.867 7,2412 77 PEUGEOT HRVATSKA d.o.o. 36.651.025 7,1413 46 ZAGREBAČKA PIVOVARA d.d. 434.143.028 6,2114 284 PRVA SPORTSKA KLADIONICA 96.127.994 5,8615 210 TERMOCOMMERCE d.o.o. 37.638.317 5,7716 129 PBZ AMERICAN EXPRESS 205.803.006 5,7617 159 TVORNICA DUHANA ZAGREB d.d. 127.937.004 5,6818 145 ŠPORT TIP d.o.o. 53.151.114 5,6119 108 JANAF, d.d. 225.664.311 5,4120 56 OKTAL PHARMA d.o.o. 68.641.753 5,2921 2 HT - HRVATSKE TELEKOMUNIKACIJE 4.975.197.498 5,2422 385 ECOS TRGOVINA d.o.o. 16.652.940 5,0923 80 CITROEN HRVATSKA 41.216.032 5,0624 135 RECRO d.d. 34.238.076 4,9025 386 RADIN-REPRO I ROTO d.o.o. 42.407.352 4,7726 232 FERO-TERM d.o.o. 26.882.144 4,5227 251 ORVAS PLUS d.o.o. 31.509.031 4,5028 166 HEP - PRIJENOS d.o.o. 182.270.703 4,3629 63 EUROLINE d.o.o. 80.137.896 4,3230 99 DM-DROGERIE MARKT d.o.o. 101.486.432 3,9531 25 HEP- PROIZVODNJA d.o.o. 375.899.632 3,9332 120 TORNADO-BAKIN d.o.o. 40.102.286 3,9333 148 HRVATSKA LUTRIJA d.o.o. 175.911.484 3,8634 94 STRABAG d.o.o. 80.776.260 3,8135 22 OMV ISTRABENZ d.o.o. 37.436.005 3,7836 86 FRANCK d.d. 212.975.249 3,7437 76 ATLANTIC TRADE d.o.o. 61.275.701 3,7038 298 BAUHAUS-ZAGREB k.d. 26.016.650 3,6539 338 ŠKOLSKA KNJIGA d.d. 66.289.899 3,6440 23 CROATIA AIRLINES d.d. 455.604.242 3,6141 253 KAMGRAD d.o.o. 26.957.784 3,5742 43 COCA-COLA BEVERAGES HRVATSKA 312.846.438 3,5743 4 PLIVA d.d. 1.374.279.316 3,5644 36 AWT INTERNATIONAL d.o.o. 95.679.953 3,5645 58 GORENJE ZAGREB d.o.o. 45.946.619 3,5646 231 BEIERSDORF d.o.o. 25.192.946 3,5047 147 KRKA-FARMA 47.842.288 3,4748 27 SIEMENS d.d. 336.239.102 3,4149 118 TIFON d.o.o. 15.275.024 3,3950 1 INA-INDUSTRIJA NAFTE d.d. 2.637.814.837 3,38and even HT (telecom) createvalue extremely efficientlywith regard to their sector.The companies from Zagreb,being the backbone ofCroatian economy, are thosethat create value at highestefficiency levels. The first 50companies according to thiscriterion create as much as 20% of total value of all Croatiancompanies.26
intellectual capitalCounty of IstriaRank Rev. Company VA VAIC1 194 RONHILL d.o.o. 162.024.888 11,582 10 TVORNICA DUHANAROVINJ d.d. 618.743.763 6,903 163 TC KOROMAČNO d.o.o. 120.959.624 4,774 375 HEMPEL d.o.o. 49.816.399 4,285 364 ANITA d.d. 89.409.371 3,536 279 EUROTRADE d.o.o. 18.144.687 3,387 185 ISTRATURISTUMAG d.d. 127.101.804 3,218 370 VALALTA d.d. 38.877.163 3,029 326 ISTRA CEMENTINTERNAT. 48.449.82 3,0210 347 ETRADEX d.o.o. 3.892.378 2,8411 127 RIVIERAHOLDING d.d. 164.424.591 2,7712 123 PLAVA LAGUNA d.d. 184.545.805 2,7613 362 GLAS ISTRE d.o.o. 26.184.177 2,4714 184 JADRAN-TURISTROVINJ, d.d. 118.181.695 2,4615 278 ISTRACOMMERCE 19.035.059 2,13The economy of the County of Istriais one of the most dynamic onesin Croatia. In five years it managedto transform from average economyto the most efficient one in wholeCroatia. After economy of the City ofZagreb, which is specific, Istria regionis the one where most value iscreated in Croatia. While intellectualcapital efficiency decreased slightlyin the whole country, the Countyof Istria managed to keep the sameefficiency level as previous year. Althoughthis by itself represents a tremendoussuccess, after two years ofstagnation Istria will have to concentrateon finding ways to boost theeconomy and make it as successful asit was from 1996 to 2000.Rank City VA VAIC1 PULA 1.492.476.288 2,022 ROVINJ 1.028.551.329 3,963 POREČ 626.560.962 2,674 UMAG 460.730.474 2,835 BUZET 264.317.369 2,316 PAZIN 251.567.691 2,177 KRŠAN 247.958.751 20,688 LABIN 227.087.385 2,049 KANFANAR 173.483.859 9,1010 RAŠA 134.688.574 3,7311 VRSAR 104.990.199 3,3712 BUJE 103.583.850 2,1913 NOVIGRAD 97.981.880 2,6514 VODNJAN 44.362.623 2,4515 MEDULIN 40.662.809 2,5516 FAŽANA 38.357.507 3,8417 LUPOGLAV 32.472.773 3,2718 ŽMINJ 30.338.177 2,2719 SVETA NEDELJA 20.245.879 1,4620 LIŽNJAN 18.484.992 2,1421 BRTONIGLA 18.004.107 2,0322 CEROVLJE 13.210.617 1,9223 MARČANA 12.853.330 1,1324 PIĆAN 11.534.780 1,4125 VIŠNJAN 9.993.961 2,7526 TINJAN 7.619.741 3,6427 OPRTALJ 7.160.444 1,7228 SVETI PETAR U ŠUMI 6.777.348 4,9829 KAROJBA 6.398.831 1,7630 BARBAN 4.397.633 1,9131 KAŠTELIR - LABINCI 3.339.367 1,7532 MOTOVUN 3.185.804 1,4733 BALE 2.623.463 1,5334 LANIŠĆE 2.572.068 1,9435 VIŽINADA 2.403.049 2,6636 GROŽNJAN 2.241.446 2,4737 SVETVINČENAT 1.978.933 2,0338 GRAČIŠĆE 1.389.788 3,1639 SVETI LOVREČ 1.243.579 1,603,002,502,001,501,000,500,001996. 1997. 1998. 1999. 2000. 2001. 2002.CroatiaCounty of IstriaThe reason for the stagnation inefficiency is the fact that the leadingtowns in the county are losing momentum– first of all Pula and Rovinj.Economy of Pula has lost momentumin value creation. Namely, it createdthe same amount of value as previousyear, and moreover, this was followedby a decrease in efficiency.The dramatic fall in efficiency happenedin another town, Rovinj,which presently creates 1 kuna lessthan previous year, which is a significantfall. The positive examples, i.e.towns that have increased value creationand efficiency are Umag, Pazin,Kanafar and Vrsar.While listing the most successfultowns, we must mention Kršan.Namely, economy of this town hasincreased value 10 times since 1997,and is presently, with the final resultsfor 2002, absolutely the leadingtown in terms of efficiency inwhole Croatia. On the other hand,the exotic little town Motovun experiencedboth a decrease in valueadded and efficiency compared tothe year before.As far as particular companies areconcerned, cigarette producer Tvornicaduhana Rovinj is still at the verytop of the list, although its efficiencywas lower than previous year.The cement plant is presently thethird, thereby taking the position ofOMV Istrabenz which is no longeron the list of most efficient companies.“AnitaVrsar” is the most efficientcompany not only among allIstrian hotel and catering industries,but also in whole Croatia.27
County of ZagrebRank Rev. Company VA VAIC1 283 STROJOPROMET-ZAGREB d.o. 40.680.606 10,202 220 E PLUS, d.o.o. 12.337.533 9,623 65 MEDICALINTERTRADE d.o.o. 82.453.597 5,874 13 P.Z. AUTO d.o.o. 101.915.645 5,865 107 FLIBA d.o.o. 101.520.882 5,646 138 SAMOBORKA d.d. 116.360.269 5,637 309 ROBIĆ d.o.o. 12.080.393 5,468 181 STANIĆ d.o.o. 42.873.479 4,659 291 MESSERCROATIA PLIN d.o.o. 81.941.693 4,1010 190 VETERINA, d.o.o. 105.616.958 3,1911 398 KVASAC d.o.o. 51.814.920 3,1112 300 ZUBAK AUTO 21.889.665 2,9213 221 ZRAČNA LUKAZAGREB, d.o.o. 129.976.049 2,0414 40 MERCATOR-H, d.o.o.VELIKA 118.608.187 2,0215 270 AGROPRERADA d.d. 18.620.502 1,73Rank City VA VAIC1 VELIKA GORICA 1.161.383.647 2,272 SAMOBOR 563.870.741 3,133 SVETA NEDELJA 478.422.307 3,374 ZAPREŠIĆ 296.220.262 2,615 STUPNIK 243.347.180 4,156 JASTREBARSKO 157.492.759 2,667 IVANIĆ-GRAD 156.269.025 2,818 SVETI IVAN ZELINA 137.483.244 2,279 BRDOVEC 129.225.730 3,5310 VRBOVEC 117.669.012 1,0211 DUGO SELO 108.557.575 2,4712 DUBRAVA 42.759.427 3,8313 RUGVICA 33.194.074 3,8014 KRIŽ 26.389.557 1,5615 PUŠĆA 25.075.300 3,3316 DUBRAVICA 21.204.808 2,7217 KLINČA SELA 18.743.825 3,5518 GRADEC 16.274.090 1,5319 KLOŠTAR IVANIĆ 15.262.233 3,0120 BISTRA 15.250.402 1,8621 BEDENICA 6.849.420 2,5122 JAKOVLJE 6.738.785 1,9223 MARIJA GORICA 6.271.677 2,8724 PISAROVINA 4.780.972 2,1925 ORLE 3.856.163 2,7426 KRAŠIĆ 3.495.208 1,3627 FARKAŠEVAC 2.707.839 3,0528 LUKA 2.609.699 1,8429 PRESEKA 895.096 3,6230 POKUPSKO 637.478 2,1531 KRAVARSKO 563.743 1,0632 RAKOVEC 387.315 0,9533 ŽUMBERAK 87.070 0,47The county of Zagreb andits economy have always beeneither around or above nationalaverage. This trendcontinued in 2002 as well,since the efficiency remainedon the same level as previousyear, even though there wasno increase. This countymanaged to resist the generaltrend in whole Croatian economy– a slight fall similar tothe County of Istria.3,002,502,001,501,000,500,00Velika Gorica remains thebackbone of value creation inthe region. In 2002 it managed to increasevalue creation by 50 %. Thishuge leap was accompanied with aslight decrease in efficiency, but thisdoes not make it less successful. SvetaNedelja is another example of verysuccessful performance, since it alsohad a rise exceeding 50 %, whichmakes it the record-holder in termsof growth. If this trend continues,Sveta Nedelja will soon leave behindSamobor, which has so far been thesecond centre in terms of value creationin the county of Zagreb. Thefact that value added and efficiencyhave decreased in comparison to previousyear is a clear indication thatSamobor is facing problems. A similartrend occurred in Zaprešić andJastrebarsko. Since these towns togetheraccount for one fifth of totalvalue created in the county, somesteps will have to be taken in orderto stop the negative trend. Finally,we must mention Stupnik, the townthat made a huge leap on the list withenormous growth in value creationand even more rapid growth in efficiency.The similar trend was noticedin Brdovec, the place that has left behindVrbovec in terms of value created.Most of the companies that werehighlighted as most successful previousyear are still on the list. Weshould point out that Strojoprometachieved remarkable efficiency, al-1996. 1997. 1998. 1999. 2000. 2001. 2002.CroatiaCounty of Zagrebthough in 2001 it was not thatsuccessful, and a similar trendoccurred with the company E-plus. The companies Medical,P.Z. Auto, Fliba and Samoborkaremained at the very top ofthe list, although all of themoperated at much lower efficiencythan previous year.28
intellectual capitalCounty of Zadar3,002,502,001,501,000,500,001996. 1997. 1998. 1999. 2000. 2001. 2002.CroatiaCounty of ZadarRank Rev. Company VA VAIC1 48 TANKERSKAPLOVIDBA d.d. 205.477.104 7,562 350 TANKERKOMERC d.d. 42.343.438 3,703 397 INTERMOD d.o.o. 25.027.099 3,534 195 SONIK d.o.o. 16.816.729 2,265 143 ALUFLEXPACK, d.o.o. 39.410.785 1,766 244 ZADRANKA d.d. 18.375.932 1,19Like so many times in analysingperformance, the Zadar economy deviatesfrom the general trend inCroatia: whereas the national economyis declining, the efficiency of Zadarcounty is slightly higher than previousyear. This is the reason why forthe third consecutive year county ofZadar still remains one of the veryfew counties that perform above thenational average. However, keepingsuch a status is a result of extremelyinteresting circumstances.Due to the key company in Zadar,Tankerska plovidba, which is ofcourse closely dependent on globaltrends, value added and efficiencyhawe decreased significantly. As arule, in such cases the whole economyof the region staggers and facesserious difficulties, since one companyalone accounted for about 80% of total regional economy. So, howto explain the fact that the Zadareconomy managed to survive? Toput it simply, the reason for this isappearance of new players that managedto neutralise such a huge loss.The towns Biograd na Moru, Pag,Poličnik, Gračac, Stankovci, Bibinjeand Vir succeeded in achieving a significantincrease in value added andefficiency, which compensated forthe slump in Zadar economy. To illustratethis let us point out thatPoličnik managed to increase valuecreation 10 times in less than a year.There have been no major changesin ranking of the leading companiesin the Zadar area. Tankerska plovidba,in spite of the considerable fall invalue creation, still remains the absoluteleader in local terms. Tankerkomercmanaged to improve its rankingfrom the sixth position last yearto the second position. The only newcompany that managed to enter thelist of the leading companies in theZadar region is Intermod.Rank City VA VAIC1 ZADAR 789.690.788 2,562 BIOGRAD NA MORU 78.784.355 2,473 PAG 44.179.146 2,604 POLIČNIK 43.253.449 1,795 SVETI FILIP I JAKOV 42.046.155 4,896 BENKOVAC 37.476.502 1,837 GRAČAC 22.551.976 6,578 NOVIGRAD 16.926.804 18,329 PAKOŠTANE 15.702.293 1,9510 KALI 15.169.883 1,9611 NIN 15.048.729 2,1712 STANKOVCI 12.270.817 6,1813 BIBINJE 12.020.550 3,5014 PREKO 10.498.089 2,2715 VIR 10.136.056 2,2316 SUKOŠAN 6.912.523 2,4917 POSEDARJE 6.673.445 4,2818 SALI 5.556.516 1,8819 PAŠMAN 3.771.750 2,5120 PRIVLAKA 3.423.585 1,7021 OBROVAC 3.084.839 1,7022 ŠKABRNJE 2.291.439 2,9423 GALOVAC 2.047.124 3,8524 STARIGRAD 1.845.789 2,3525 TKON 1.502.184 2,7326 POLAČA 1.291.692 2,4427 RAŽANAC 957.599 1,4928 KUKLJICA 602.244 1,8529 ZEMUNIK DONJI 552.187 2,4430 JASENICE 215.249 0,0031 LIŠANE OSTROVIČKE 202.837 2,9832 POVLJANA - 0,0029
County of Osijek-Baranja3,002,502,001,501,000,500,001996. 1997. 1998. 1999. 2000. 2001. 2002.CroatiaCounty of Osijek-BaranjaThis county has never been closerto Croatian average due to a continuousgrowth in efficiency ever since1999. Therefore it could be expectedthat this will happen already inthe next analysis. Compared to theRank Rev. Company VA VAICa1 101 NAŠICECEMENT d.d., 228.207.226 6,58NAŠICE2 37 BENETTON 91.351.411 6,23CROATIA d.o.o.3 72 ŽITO d.o.o. 104.274.904 5,594 141 MINACO d.o.o. 27.291.404 5,58NAŠICE5 339 BIJELIĆ CO d.o.o. 7.668.938 4,516 233 DOSEG d.o.o. 18.767.862 4,287 44 ALASTOR d.o.o. 95.830.719 2,968 247 GRADNJA d.o.o. 44.419.778 2,74OSIJEK9 174 OSIJEK-KOTEKS d.d. 47.963.118 2,6810 124 SAPONIA d.d. 99.171.914 2,4611 57 BELIŠĆE d.d. 182.412.559 2,3312 239 ĐAKOVŠTINA d.d. 55.928.908 2,2613 293 INA-OSIJEK 12.361.855 2,20PETROL d.d.14 140 IPK TVORNICA 70.874.130 2,18ŠEĆERA OSIJEK d.o.o.15 322 VODOVOD- 70.205.521 2,17OSIJEK d.o.o.16 377 AUTO KUĆA 5.358.110 2,11LOZIĆ d.o.o.17 241 SLOBODA d.d. 81.796.955 2,0618 304 LIMEX d.o.o. 25.824.345 1,9219 152 BILJEMERKANT d.o.o. 30.914.010 1,8120 154 IPK RATARSTVO 50.909.343 1,59STOČARSTVO21 331 IPK MIA MLJEKAR. 17.472.390 1,41INDUSTRIJA22 61 BELJE d.d. DARDA 130.445.412 1,3423 392 PPK VALPOVO d.d. 15.783.910 1,14previous year it climbed one placeup on the list of most successfulCroatian counties.Such a result has been realizedfirst of all thanks to business performanceof the first five towns in theregion. All of them managed to increaseboth the realized value addedand efficiency, and since they togethercreate more than 85 % of thevalue in the county, it is easyto understand the reasonswhy Osijek-Baranja countyhas improved its position.The leading town amongthose that decreased both invalue added and efficiency isValpovo. However, this hasnot significantly influencedthe total result.Although almost all thecompanies that were listed assuccessful and efficient oneslast year remain on the list,there have been severalchanges of position. Našicecement,with its dynamic increasein efficiency, is rightfullythe leader in economy ofthe region. On the other handBenetton was not as efficientas before (a decrease of morethan 1/3), and is presently onsecond position. Žito swappedposition with Minaco. Itshould be pointed out thatthe well - known companiessuch as Saponia and Belišćeperformed less efficiently in2002, although they are still atthe top.Rank City VA VAIC1 OSIJEK 1.875.751.026 2,272 NAŠICE 383.664.833 3,753 ĐAKOVO 242.781.083 2,044 BELIŠĆE 235.367.135 2,235 DARDA 159.110.848 1,446 VALPOVO 94.418.288 1,547 DONJI MIHOLJAC 92.354.283 1,818 ANTUNOVAC 51.571.875 1,489 BELI MANASTIR 43.217.954 1,4510 BILJE 39.817.492 2,4011 ČEPIN 22.757.157 1,1612 ĐURĐENOVAC 22.075.200 1,4113 SEMELJCI 20.974.118 3,9414 PETRIJEVCI 15.425.237 1,7415 KNEŽEVI VINOGRADI 14.545.685 1,7316 BIZOVAC 12.010.845 0,0017 KOŠKA 11.971.387 3,7418 STRIZIVOJNA 11.132.001 2,5419 PODGORAČ 10.567.342 2,3520 FERIČANCI 9.001.025 1,6221 DRENJE 8.370.987 0,0022 SATNICA ĐAKOVAČKA 7.450.434 2,7423 ERNESTINOVO 6.131.928 1,4724 PETLOVAC 6.051.264 7,8825 MAGADENOVAC 4.920.418 2,2626 MARIJANCI 4.088.801 2,2827 PUNITOVCI 3.813.866 1,2128 ERDUT 2.581.964 0,0029 JAGODNJAK 2.514.439 1,7630 VILJEVO 2.401.496 1,8231 VLADISLAVCI 2.066.224 0,0032 GORJANI 1.865.371 0,0033 ČEMINAC 1.369.050 1,3334 DRAŽ 1.089.035 0,5335 VIŠKOVCI 547.996 0,0036 POPOVAC 480.843 0,2037 ŠODOLOVCI 468.501 2,1038 PODRAV. MOSLAVINA 360.144 1,0539 LEVANJSKA VAROŠ 282.557 0,6240 VUKA 181.376 3,1341 DONJA MOTIČINA 129.524 1,5642 TENJA - 0,0043 TRNAVA - 0,0030
intellectual capitalCounty of Split-DalmatiaEconomy of this countycontinued the positive trend,which has lasted since 1999.In spite of the overall fall inefficiency of Croatian economy,in other words rather unfavourablebusiness environment,this county registeredgrowth, since it creates on average20 lipa more on onekuna invested than previousyear. Potential of the countyis enormous, so it is hopedthat this positive trend of increasein efficiency will notonly continue, but also gatherpace.Much credit goes to thefirst four towns, since theymanaged to increase not onlyvalue added but also efficien-3,002,502,001,501,000,500,00Rank Rev. Company VA VAICa1 264 DRVENIK-TUNA, d.o.o. 10.998.310 20,632 131 MESNA INDUSTRIJA 96.960.530 11,42BRAĆA PIVAC3 236 TEOMIS, d.o.o. 3.523.420 8,774 192 JADROPLOV d.d. 51.498.832 7,215 217 ELEKTROMAGIC d.o.o. 17.092.206 5,606 310 ROBOT 22.829.362 4,67COMMERCE, d.o.o.7 343 GRAĐA d.d. 13.859.023 4,528 355 BRODOSPAS d.d. 49.101.183 4,009 45 DALMACIJA- 271.594.555 3,76CEMENT-RMC GROUP10 258 LAVČEVIĆ d.d. 7.038.529 3,4511 160 STUDENAC, d.o.o. 17.754.521 3,0012 93 TOMMY 41.396.032 2,89COMMERCE d.o.o.13 393 DALMACIJAVINO d.d. 65.912.944 2,6414 78 KERUM d.o.o. 49.254.969 2,6215 371 PEKO-DAL d.o.o. 25.863.847 2,4816 387 PROD. CENTAR 5.032.031 2,47DALMACIJA d.o.o.17 111 AD PLASTIK d.d. 118.893.963 2,4118 301 JADRANSKA 51.024.779 2,39PIVOVARA - SPLIT d.d.19 261 DIK-COMMERCE d.o.o. 3.027.001 2,3420 164 SLOBODNA 32.052.500 2,13DALMACIJA - TRG21 367 MERKUR 5, d.o.o. 8.013.513 2,0722 49 KONSTRUKTOR- 151.633.414 1,88INŽENJERING d.d.23 26 BRODOMERKUR d.d. 95.844.690 1,6624 256 SLOBODNA 74.999.766 1,66DALMACIJA d.d.1996. 1997. 1998. 1999. 2000. 2001. 2002.CroatiaCounty of Split-Dalmatiacy. Record-holder of the region isVrgorac, the town that increased valuecreation by 50 % with much higherefficiency level than before.Therefore this town and anotherone, Marina, are leaders interms of efficiency in thewhole county. Bright spots ofthe region are also Hvar andBol. On the other hand, however,there are some weakpoints in the region, townswhich do not create but destroyvalue – these are Trogirand Omiš with significantlyless value added and muchlower efficiency level thanearlier.The leading two companiesremain the same ones:Drvenik Tuna and Braća Pivaccontinue performing atexceptionally high efficiencylevel, setting the pace in theregion. Two other companiesshould be singled out – Kerumand AD Plastik, whichhave achieved exceptionallyhigh efficiency level for thisbranch of industry.Rank City VA VAIC1 SPLIT 3.245.733.947 2,072 KAŠTELA 461.046.030 2,423 SOLIN 366.729.026 2,514 VRGORAC 136.268.477 4,865 MAKARSKA 121.628.052 1,626 SINJ 108.506.287 1,487 TROGIR 95.749.660 0,008 OMIŠ 82.331.316 1,349 IMOTSKI 75.493.723 1,8710 HVAR 50.304.457 1,9911 SEGET 41.899.662 2,5012 PUČIŠĆA 39.916.021 1,6713 SUPETAR 39.696.937 2,0314 PODSTRANA 37.629.831 2,5015 TUČEPI 36.684.908 2,6816 DUGI RAT 34.264.095 1,4117 POSTIRA 33.738.094 1,9818 BOL 30.243.814 1,7219 BRELA 27.464.301 2,4620 PODGORA 25.819.485 1,4221 BAŠKA VODA 24.717.358 2,2822 JELSA 24.164.639 1,5423 STARI GRAD 21.335.748 1,7124 MARINA 19.955.736 4,4225 KOMIŽA 17.081.012 1,3426 DICMO 12.320.805 3,5827 DUGOPOLJE 11.485.551 2,3028 PODBABLJE 11.465.895 4,1129 SELCA 10.871.731 2,6530 OTOK 8.818.747 2,9131 KLIS 8.092.114 2,3732 CISTA PROVO 8.016.470 3,4633 NEREŽIŠĆA 6.719.134 3,2034 VIS 6.290.587 0,0035 TRILJ 6.100.420 0,0036 PROLOŽAC 6.020.260 2,4137 LOVREĆ 4.589.486 4,6838 GRADAC 4.288.843 1,5239 MILNA 4.054.043 3,3640 ŠESTANOVAC 2.340.658 1,0441 HRVACE 2.099.171 1,7842 VRLIKA 1.954.255 0,0043 ŠOLTA 1.657.001 0,0044 LEĆEVICA 1.623.969 4,2645 ZMIJAVCI 1.435.818 2,7946 SUTIVAN 1.433.048 1,6747 LOKVIČIĆI 1.309.647 2,0248 OKRUG 1.197.277 0,0049 RUNOVIĆI 941.177 1,4650 ZADVARJE 809.077 2,0551 ZAGVOZD 716.717 1,2552 MUĆ 624.779 3,5053 PRIMORSKI DOLAC 401.563 1,6354 SUĆURAJ 397.513 1,1155 PRGOMET 42.406 0,0031
County of VaraždinThis county, which was for a longtime above the national efficiencyaverage, is after three years againaround it. In spite of this, its performancecould be considered successful,since just three counties and theCity of Zagreb are more efficientthan the average. Therefore Countyof Varaždin is presently on fifth position.Bearing in mind the fact that theshare of the city of Varaždin in valuecreation of the whole county is almost70 %, it is obvious that if thecity is performing satisfactorily, thenthe whole county will be performingwell, too. This is exactly what happenedin 2002. Varaždin managed toraise both its efficiency level andvalue creation. The three othertowns on the list also contribute toimprovement of overall efficiency ofthe county, so the total result of thecounty is logical.The leading companies in the regionkept their position from the previousyear, only their rankings areslightly different. Thus the companyTermoplin leaped from the ninthposition to the first, and Termikafrom the sixth to second. Neckermannmanaged to keep the third position,although its efficiency decreasedsignificantly. Vindija movedfrom the fifth to fourth position, al-Rank Rev. Company VA VAIC1 316 TERMOPLIN d.d. 36.794.970 3,592 342 TERMIKA d.o.o. 49.026.800 3,21NOVI MAROF3 373 NECKERMANN d.o.o. 14.549.243 3,194 9 VINDIJA d.d. 131.054.017 2,89VARAŽDIN5 103 MEDIFARM- 27.331.355 2,76VELEBIT d.d.6 323 MAGMA d.o.o. 7.024.035 2,687 321 MIV d.d. 64.836.054 2,518 257 TRGONOM d.o.o. 15.606.667 2,269 156 CESTA-VARAŽDIN d.d. 47.595.565 2,1310 183 ZAGORJE- 59.524.643 1,97TEHNOBETON d.d.11 82 VARTEKS d.d. 217.108.114 1,783,002,502,001,501,000,500,001996. 1997. 1998. 1999. 2000. 2001. 2002.Croatia County of Varaždinthough efficiency of this companydecreased as well. Another companymade a significant progress – Varteks,which was not on the list before.Rank City VA VAIC1 VARAŽDIN 1.775.133.692 2,372 IVANEC 173.719.545 2,183 LUDBREG 147.910.197 1,954 NOVI MAROF 145.485.856 2,525 LEPOGLAVA 82.988.621 2,676 TRNOVEC 44.737.038 2,64BARTOLOVEČKI7 DONJI MARTIJANEC 39.578.006 3,308 PETRIJANEC 35.763.996 2,749 GORNJI KNEGINEC 29.596.044 2,2210 MARUŠEVEC 26.223.099 2,9411 VARAŽDINSKE 24.433.340 2,05TOPLICE12 LJUBEŠĆICA 21.404.033 2,7413 VELIKI BUKOVEC 17.834.347 2,4314 SVETI ILIJA 14.082.120 5,5315 VIDOVEC 13.779.699 1,8316 BEDNJA 11.170.460 1,5717 SRAČINEC 10.687.207 2,4118 JALŽABET 8.836.221 2,3519 BREZNICA 8.826.551 2,4820 CESTICA 8.370.586 1,8921 BREZNIČKI HUM 8.211.679 2,1122 SVETI ĐURĐ 5.742.557 2,4823 VINICA 5.089.297 1,9724 BERETINEC 3.991.754 2,6225 MALI BUKOVEC 3.208.448 2,4726 VISOKO 2.819.151 2,5727 KLENOVNIK 2.158.143 3,6628 DONJA VOĆA 315.120 2,1732
intellectual capitalCounty of Primorje-Gorski KotarRank Rev. Company VA VAICa1 230 MEGGLE ADRIA d.o.o. 12.213.965 5,622 84 EURO PETROL d.o.o. 29.279.997 3,653 383 ADRIA P. A. d.o.o. 6.567.649 3,634 365 JADRANSKI POMORSKI 53.683.658 3,33SERVIS5 188 FINVEST CORP d.d. 55.576.860 2,586 400 ISTRAVINOEXPORT d.d. 30.368.632 2,577 353 NOVI LIST d.d. 62.425.810 2,388 66 JADROLINIJA 197.130.124 2,379 191 JADRANKA d.d. 88.129.232 2,2210 104 PLODINE d.o.o. 27.006.190 2,1611 274 AUTOTRANS d.d. 64.199.252 2,1312 384 JADRAN - 6.164.177 2,11PHARMA d.d.13 307 PREHRAMBENO 52.149.336 2,03INDUSTRIJSKI KOMB.14 130 BRODOKOMERC 36.860.545 1,93NOVA d.o.o.15 75 ELEKTROMA- 43.838.533 1,69TERIJAL d.d.16 227 LIBURNIA RIVIERA 82.372.116 1,63HOTELI d.d.17 225 DUHAN d.d. 14.182.040 1,5018 259 GP KRK d.d. 35.659.087 1,45Following the overall Croatiantrend this county recorded a fall invalue creation efficiency in 2002 too.It is actually deviating from Croatianaverage although there is no valid reasonfor that with regard to the physicaland financial resources at disposal.The problem is evidently with intellectualcapital. With regard to theutilisation of capital employed it is10% more successful than the othercounties, but with regard to intellectualcapital efficiency it is laggingbehind the Croatian average by almost20%. This has determined overallefficiency (VAIC) and its ranking.The main problem of this countyis the economy of the city of Rijekawhich contributes with 60% sharein the created value added. However,low efficiency level nullifies manypositive results achieved by the mostefficient towns in the area like Opatija,Mali Lošinj and Kastav. Thesecenters perform above the county’saverage while efficiency Rijeka’seconomy is lower than a year before(being critical then too). This informationshould therefore be of greatconcern to local government.Another warning is related toOpatija’s economy which isnegatively influenced by thepoor performance of the hotelchain Liburnia Riviera Hotels.LRH creates almost aquarter of total value addedbut at very low efficieny level,thus neutralizing the excellentresults of other companies.According to valuecreation efficiency Čavle isthe leader of the county butCrikvenica and Omišalj,which have managed to increaseefficiency have to bepointed out too.The problem with thiscounty’s ranking list, whichhas changed slightly comparedto the year before, isthat only the six first rankedcompanies perform above3,002,502,001,501,000,500,001996. 1997. 1998. 1999. 2000. 2001. 2002.County County of Primorje-Gorski Kotarthe Croatian average while all theothers stay below. In contrast tothat all 12 leading companies ofcounty of Split perform above thecounty and Croatian average.Rank City VA VAIC1 RIJEKA 2.823.014.990 1,872 OPATIJA 410.787.289 2,243 MALI LOŠINJ 162.154.786 2,174 KASTAV 120.170.674 3,015 KRK 117.398.280 2,026 VIŠKOVO 116.892.359 2,677 MATULJI 111.261.096 2,408 RAB 109.026.290 2,269 CRIKVENICA 102.456.165 1,8010 ČABAR 81.674.933 2,2811 BAKAR 69.165.816 1,6612 OMIŠALJ 62.990.939 2,5413 CRES 54.436.150 1,9614 ČAVLE 46.570.243 3,8815 PUNAT 45.925.598 2,1116 NOVI VINODOLSKI 44.883.315 2,2517 DELNICE 41.886.492 2,3918 FUŽINE 38.022.219 3,5719 BAŠKA 36.751.533 2,5820 KLANA 36.077.614 2,0221 MALINSKA-DUBAŠNICA 31.642.566 1,7322 RAVNA GORA 30.362.791 1,6723 LOVRAN 28.802.448 2,6624 KOSTRENA 21.323.217 2,4225 KRALJEVICA 16.623.768 0,0026 LOKVE 15.921.342 2,2227 VRBOVSKO 13.909.571 0,0028 VRBNIK 9.409.377 2,7229 DOBRINJ 8.337.102 1,6430 JELENJE 7.981.065 2,2631 MRKOPALJ 5.218.499 1,0732 VINODOLSKA OPĆINA 3.662.576 1,9633 MOŠĆENIČKA DRAGA 3.519.091 1,7534 SKRAD 3.461.059 4,2935 BROD MORAVICE 899.270 1,1633
County of Vukovar-SrijemAfter a period of ups and downs finallythe big come back: in 2002 theeconomy of this county finallyreached the efficiency level of theyear 1996. The increase in valueadded by 60% and value creation efficiencyby 20% (creating 32 lipa perinvested kuna in resources) in comparisonto the year before enabledthis county to become one of thethree most successful counties inCroatia (with regard to the ability toimprove performance).The economies of the towns ofVinkovci and Andrijaševci are, the leversof success, increasing both valuecreation and value creation efficiency.Since these towns represent 2/3of the entire economy, it is no wonderthat total results of the countyimproved. Last year’s leading companiesremain more or less the same,some switching places though, whichshows that businesses are stable.Rank City VA VAIC1 VINKOVCI 471.956.340 2,192 VUKOVAR 256.138.813 1,183 ŽUPANJA 195.522.369 2,734 ANDRIJAŠEVCI 193.268.385 2,475 ILOK 41.567.374 2,116 STARI JANKOVCI 11.165.593 2,847 TOVARNIK 9.970.873 1,358 DRENOVCI 9.170.618 2,209 GUNJA 8.089.947 2,0210 IVANKOVO 7.772.166 1,5911 NUŠTAR 7.078.496 1,6312 TRPINJA 6.779.889 2,8113 OTOK (VINKOVCI) 6.576.336 1,3514 CERNA 6.396.773 1,8715 LOVAS 5.115.554 1,6216 JARMINA 4.696.285 1,2617 BOROVO 4.511.029 2,6018 VRBANJA 4.406.974 2,4319 TORDINCI 3.598.544 2,3720 BOŠNJACI 2.926.576 2,1921 PRIVLAKA 2.672.884 2,1122 BABINA GREDA 2.089.823 1,9423 VOĐINCI 1.981.905 1,7424 STARI MIKANOVCI 1.460.927 0,0025 NEGOSLAVCI 1.393.882 1,1626 GRADIŠTE 1.005.001 2,0927 MARKUŠICA 895.326 2,5828 TOMPOJEVCI 520.562 1,7029 BOGDANOVCI 114.638 0,0030 NIJEMCI - 0,00Rank Rev. Company VA VAIC1 146 SLADORANA d.d. 86.836.309 3,692 282 BOSO d.o.o. 18.140.082 3,473 260 PIK-VINKOVCI d.d. 55.865.815 2,274 263 VUPIK d.d. 54.701.848 1,24BOSO fell to rank two due to a fall inefficiency and Sladorana (sugarplant) made it rank one. PIK Vinkovciclimbed one step higher in comparisonto last year as did Vupik.3,002,502,001,501,000,500,001996. 1997. 1998. 1999. 2000. 2001. 2002.Croatia County of Vukovar-SrijemIntellectual Capital a Base forEconomic Activity«Thanks to joint efforts of countygovernment and State Agency forDeposit Insurance and Bank Rehabilitation,positive results have beenachieved with regard to finalisingbankruptcy procedures and creatingprerequisites for economic activityof stumbling companies.Analysing everything that was goingon in our economy during thepast years, we have come to conclusionthat intellectual capital is oneof the key factors that out countylacks. Therefore we have introducedconcrete measures to create strongand productive intellectual capitalin this area. The VAIC analysisrepresents a stimulus for future actionsand valuable feedback whetherwe are on the right way.«Nikola Šafer, prof.Vukovar-Srijem County Executive34
We would like to thank our sponsors:intellectual capitalDržavna agencija zaosiguranje štednihuloga i sanaciju banakaZagrebačka županijaVukovarskosrijemskažupanijaBjelovarskobilogorskažupanijaIstarska županijaOpćina MarinaOpćina Sveta Nedelja®All rights reserved to I.B.E.C, L.L.C.October 2003No part of this publication may be copied, duplicated, reproduced or translated in any form or by any means, electronic,mechanical, photocopying, recording and/or otherwise without the prior permission of the authors.International Business Efficiency Consulting, L.L.C.Founding Memberof the Entovation GroupHeadquarters UK Office Croatian Office15 East North Street Green Suite 140 Ashley Crescent CIK, Mesnička 14Dower, 19901 USA London, SW1150Z, UK 10000 Zagreb, CROTel.:+1 888 4674 704, Fax:+1 888 4675 318 Tel.:+44 207 6813 264, Fax:+44.207.6813.26 Tel.:+385 1 4875 210, Fax:+385 1 4875 211www.vaic-on.netwww.cik-hr.comPublisher: Croatian Chamber of Economy - Intellectual Capital Association, www.hgk.hrDesign: GENS, Zagreb, Print: GIPA, Zagreb35