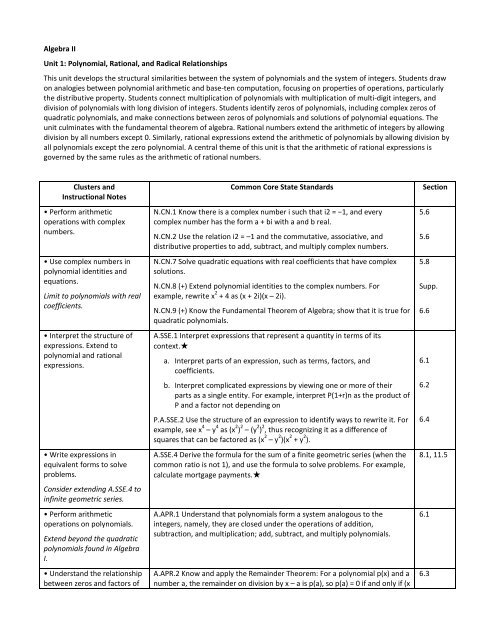
Algebra II Unit 1: Polynomial, Rational, and Radical Relationships ...
Algebra II Unit 1: Polynomial, Rational, and Radical Relationships ...
Algebra II Unit 1: Polynomial, Rational, and Radical Relationships ...

You also want an ePaper? Increase the reach of your titles
YUMPU automatically turns print PDFs into web optimized ePapers that Google loves.
<strong>Algebra</strong> <strong>II</strong><strong>Unit</strong> 1: <strong>Polynomial</strong>, <strong>Rational</strong>, <strong>and</strong> <strong>Radical</strong> <strong>Relationships</strong>This unit develops the structural similarities between the system of polynomials <strong>and</strong> the system of integers. Students drawon analogies between polynomial arithmetic <strong>and</strong> base-ten computation, focusing on properties of operations, particularlythe distributive property. Students connect multiplication of polynomials with multiplication of multi-digit integers, <strong>and</strong>division of polynomials with long division of integers. Students identify zeros of polynomials, including complex zeros ofquadratic polynomials, <strong>and</strong> make connections between zeros of polynomials <strong>and</strong> solutions of polynomial equations. Theunit culminates with the fundamental theorem of algebra. <strong>Rational</strong> numbers extend the arithmetic of integers by allowingdivision by all numbers except 0. Similarly, rational expressions extend the arithmetic of polynomials by allowing division byall polynomials except the zero polynomial. A central theme of this unit is that the arithmetic of rational expressions isgoverned by the same rules as the arithmetic of rational numbers.Clusters <strong>and</strong>Instructional Notes• Perform arithmeticoperations with complexnumbers.• Use complex numbers inpolynomial identities <strong>and</strong>equations.Limit to polynomials with realcoefficients.• Interpret the structure ofexpressions. Extend topolynomial <strong>and</strong> rationalexpressions.• Write expressions inequivalent forms to solveproblems.Consider extending A.SSE.4 toinfinite geometric series.• Perform arithmeticoperations on polynomials.Extend beyond the quadraticpolynomials found in <strong>Algebra</strong>I.• Underst<strong>and</strong> the relationshipbetween zeros <strong>and</strong> factors ofCommon Core State St<strong>and</strong>ardsN.CN.1 Know there is a complex number i such that i2 = −1, <strong>and</strong> everycomplex number has the form a + bi with a <strong>and</strong> b real.N.CN.2 Use the relation i2 = –1 <strong>and</strong> the commutative, associative, <strong>and</strong>distributive properties to add, subtract, <strong>and</strong> multiply complex numbers.N.CN.7 Solve quadratic equations with real coefficients that have complexsolutions.N.CN.8 (+) Extend polynomial identities to the complex numbers. Forexample, rewrite x 2 + 4 as (x + 2i)(x – 2i).N.CN.9 (+) Know the Fundamental Theorem of <strong>Algebra</strong>; show that it is true forquadratic polynomials.A.SSE.1 Interpret expressions that represent a quantity in terms of itscontext.★a. Interpret parts of an expression, such as terms, factors, <strong>and</strong>coefficients.b. Interpret complicated expressions by viewing one or more of theirparts as a single entity. For example, interpret P(1+r)n as the product ofP <strong>and</strong> a factor not depending onP.A.SSE.2 Use the structure of an expression to identify ways to rewrite it. Forexample, see x 4 – y 4 as (x 2 ) 2 – (y 2 ) 2 , thus recognizing it as a difference ofsquares that can be factored as (x 2 – y 2 )(x 2 + y 2 ).A.SSE.4 Derive the formula for the sum of a finite geometric series (when thecommon ratio is not 1), <strong>and</strong> use the formula to solve problems. For example,calculate mortgage payments.★A.APR.1 Underst<strong>and</strong> that polynomials form a system analogous to theintegers, namely, they are closed under the operations of addition,subtraction, <strong>and</strong> multiplication; add, subtract, <strong>and</strong> multiply polynomials.A.APR.2 Know <strong>and</strong> apply the Remainder Theorem: For a polynomial p(x) <strong>and</strong> anumber a, the remainder on division by x – a is p(a), so p(a) = 0 if <strong>and</strong> only if (xSection5.65.65.8Supp.6.66.16.26.48.1, 11.56.16.3
polynomials.• Use polynomial identities tosolve problems.This cluster has manypossibilities for optionalenrichment, such as relatingthe example in A.APR.4 to thesolution of the system u 2 +v 2 =1,v = t(u+1), relating the Pascaltriangle property of binomialcoefficients to (x+y) n+1 =(x+y)(x+y) n , deriving explicitformulas for the coefficients,or proving the binomialtheorem by induction.• Rewrite rational expressionsThe limitations on rationalfunctions apply to the rationalexpressions in A.APR.6.A.APR.7 requires the generaldivision algorithm forpolynomials.• Underst<strong>and</strong> solvingequations as a process ofreasoning <strong>and</strong> explain thereasoning.Extend to simple rational <strong>and</strong>radical equations.• Represent <strong>and</strong> solveequations <strong>and</strong> inequalitiesgraphically.Include combinations of linear,polynomial, rational, radical,absolute value, <strong>and</strong>exponential functions.• Analyze functions usingdifferent representations.Relate F.IF.7c to therelationship between zeros ofquadratic functions <strong>and</strong> theirfactored forms– a) is a factor of p(x).A.APR.3 Identify zeros of polynomials when suitable factorizations areavailable, <strong>and</strong> use the zeros to construct a rough graph of the functiondefined by the polynomial.A.APR.4 Prove polynomial identities <strong>and</strong> use them to describe numericalrelationships. For example, the polynomial identity (x 2 + y 2 ) 2 = (x 2 – y 2 ) 2 +(2xy) 2 can be used to generate Pythagorean triples.A.APR.5 (+) Know <strong>and</strong> apply the Binomial Theorem for the expansion of (x +y)n in powers of x <strong>and</strong> y for a positive integer n, where x <strong>and</strong> y are anynumbers, with coefficients determined for example by Pascal’s Triangle.A.APR.6 Rewrite simple rational expressions in different forms; write a(x)/b(x)in the form q(x) + r(x)/b(x), where a(x), b(x), q(x), <strong>and</strong> r(x) are polynomialswith the degree of r(x) less than the degree of b(x), using inspection, longdivision, or, for the more complicated examples, a computer algebra system.A.APR.7 (+) Underst<strong>and</strong> that rational expressions form a system analogous tothe rational numbers, closed under addition, subtraction, multiplication, <strong>and</strong>division by a nonzero rational expression; add, subtract, multiply, <strong>and</strong> dividerational expressions.A.REI.2 Solve simple rational <strong>and</strong> radical equations in one variable, <strong>and</strong> giveexamples showing how extraneous solutions may arise.A.REI.11 Explain why the x-coordinates of the points where the graphs of theequations y = f(x) <strong>and</strong> y = g(x) intersect are the solutions of the equation f(x) =g(x); find the solutions approximately, e.g., using technology to graph thefunctions, make tables of values, or find successive approximations. Includecases where f(x) <strong>and</strong>/or g(x) are linear, polynomial, rational, absolute value,exponential, <strong>and</strong> logarithmic functions.★F.IF.7 Graph functions expressed symbolically <strong>and</strong> show key features of thegraph, by h<strong>and</strong> in simple cases <strong>and</strong> using technology for more complicatedcases.★c. Graph polynomial functions, identifying zeros when suitablefactorizations are available, <strong>and</strong> showing end behavior.6.46.86.37.5, 9.6Donethroughout6.1 Ext.,6.2
<strong>Unit</strong> 2: Trigonometric FunctionsBuilding on their previous work with functions, <strong>and</strong> on their work with trigonometric ratios <strong>and</strong> circles in Geometry,students now use the coordinate plane to extend trigonometry to model periodic phenomena.Clusters <strong>and</strong>Instructional Notes• Extend the domain oftrigonometric functions usingthe unit circle.• Model periodic phenomenawith trigonometric functions.• Prove <strong>and</strong> applytrigonometric identities.An <strong>Algebra</strong> <strong>II</strong> course with anadditional focus ontrigonometry could include the(+) st<strong>and</strong>ard F.TF.9: Prove theaddition <strong>and</strong> subtractionformulas for sine, cosine, <strong>and</strong>tangent <strong>and</strong> use them to solveproblems. This could belimited to acute angles in<strong>Algebra</strong> <strong>II</strong>.Common Core State St<strong>and</strong>ardsF.TF.1 Underst<strong>and</strong> radian measure of an angle as the length of the arc on theunit circle subtended by the angle.F.TF.2 Explain how the unit circle in the coordinate plane enables theextension of trigonometric functions to all real numbers, interpreted asradian measures of angles traversed counterclockwise around the unit circle.F.TF.5 Choose trigonometric functions to model periodic phenomena withspecified amplitude, frequency, <strong>and</strong> midline.★F.TF.8 Prove the Pythagorean identity sin2(θ) + cos2(θ) = 1 <strong>and</strong> use it to findsin (θ), cos (θ), or tan (θ), given sin (θ), cos (θ), or tan (θ), <strong>and</strong> the quadrant ofthe angle.Section13.2,13.313.2,13.313.4-13.814.1
<strong>Unit</strong> 3: Modeling with FunctionsIn this unit students synthesize <strong>and</strong> generalize what they have learned about a variety of function families. They extendtheir work with exponential functions to include solving exponential equations with logarithms. They explore the effects oftransformations on graphs of diverse functions, including functions arising in an application, in order to abstract the generalprinciple that transformations on a graph always have the same effect regardless of the type of the underlying function.They identify appropriate types of functions to model a situation, they adjust parameters to improve the model, <strong>and</strong> theycompare models by analyzing appropriateness of fit <strong>and</strong> making judgments about the domain over which a model is a goodfit. The description of modeling as “the process of choosing <strong>and</strong> using mathematics <strong>and</strong> statistics to analyze empiricalsituations, to underst<strong>and</strong> them better, <strong>and</strong> to make decisions” is at the heart of this unit. The narrative discussion <strong>and</strong>diagram of the modeling cycle should be considered when knowledge of functions, statistics, <strong>and</strong> geometry is applied in amodeling context.Clusters <strong>and</strong> InstructionalNotes• Create equations thatdescribe numbers orrelationships.For A.CED.1, use all availabletypes of functions to createsuch equations, including rootfunctions, but constrain tosimple cases. While functionsused in A.CED.2, 3, <strong>and</strong> 4 willoften be linear, exponential, orquadratic the types ofproblems should draw frommore complex situations thanthose addressed in <strong>Algebra</strong> I.For example, finding theequation of a line through agiven point perpendicular toanother line allows one to findthe distance from a point to aline. Note that the examplegiven for A.CED.4 applies toearlier instances of thisst<strong>and</strong>ard, not to the currentcourse.• Interpret functions that arisein applications in terms of acontext.Emphasize the selection of amodel function based onbehavior of data <strong>and</strong> context.Common Core State St<strong>and</strong>ardsA.CED.1 Create equations <strong>and</strong> inequalities in one variable <strong>and</strong> use them tosolve problems. Include equations arising from linear <strong>and</strong> quadratic functions,<strong>and</strong> simple rational <strong>and</strong> exponential functions.A.CED.2 Create equations in two or more variables to represent relationshipsbetween quantities; graph equations on coordinate axes with labels <strong>and</strong>scales.A.CED.3 Represent constraints by equations or inequalities, <strong>and</strong> by systems ofequations <strong>and</strong>/or inequalities, <strong>and</strong> interpret solutions as viable or non-viableoptions in a modeling context. For example, represent inequalities describingnutritional <strong>and</strong> cost constraints on combinations of different foods.A.CED.4 Rearrange formulas to highlight a quantity of interest, using the samereasoning as in solving equations. For example, rearrange Ohm’s law V = IR tohighlight resistance R.F.IF.4 For a function that models a relationship between two quantities,interpret key features of graphs <strong>and</strong> tables in terms of the quantities, <strong>and</strong>sketch graphs showing key features given a verbal description of therelationship. Key features include: intercepts; intervals where the function isincreasing, decreasing, positive, or negative; relative maximums <strong>and</strong>minimums; symmetries; end behavior; <strong>and</strong> periodicity.★F.IF.5 Relate the domain of a function to its graph <strong>and</strong>, where applicable, tothe quantitative relationship it describes. For example, if the function h(n)gives the number of person-hours it takes to assemble n engines in a factory,then the positive integers would be an appropriate domain for the function.★F.IF.6 Calculate <strong>and</strong> interpret the average rate of change of a function(presented symbolically or as a table) over a specified interval. Estimate therate of change from a graph.★SectionsCh. 5 toCh. 91.31.42.22.32.4
• Analyze functions usingdifferent representations.Focus on applications <strong>and</strong> howkey features relate tocharacteristics of a situation,making selection of aparticular type of functionmodel appropriate.• Build a function that modelsa relationship between twoquantities.Develop models for morecomplex or sophisticatedsituations than in previouscourses.• Build new functions fromexisting functions.Use transformations offunctions to find models asstudents consider increasinglymore complex situations.For F.BF.3, note the effect ofmultiple transformations on asingle graph <strong>and</strong> the commoneffect of each transformationacross function types.Extend F.BF.4a to simplerational, simple radical, <strong>and</strong>simple exponential functions;connect F.BF.4a to F.LE.4.• Construct <strong>and</strong> comparelinear, quadratic, <strong>and</strong>exponential models <strong>and</strong> solveproblems.Consider extending this unit toinclude the relationshipbetween properties oflogarithms <strong>and</strong> properties ofexponents, such as theconnection between theproperties of exponents <strong>and</strong>the basic logarithm propertythat log xy = log x +log y.F.IF.7 Graph functions expressed symbolically <strong>and</strong> show key features of thegraph, by h<strong>and</strong> in simple cases <strong>and</strong> using technology for more complicatedcases.★b. Graph square root, cube root, <strong>and</strong> piecewise-defined functions,including step functions <strong>and</strong> absolute value functions.e. Graph exponential <strong>and</strong> logarithmic functions, showing intercepts <strong>and</strong>end behavior, <strong>and</strong> trigonometric functions, showing period, midline,<strong>and</strong> amplitude.F.IF.8 Write a function defined by an expression in different but equivalentforms to reveal <strong>and</strong> explain different properties of the function.F.IF.9 Compare properties of two functions each represented in a differentway (algebraically, graphically, numerically in tables, or by verbaldescriptions). For example, given a graph of one quadratic function <strong>and</strong> analgebraic expression for another, say which has the larger maximum.F.BF.1 Write a function that describes a relationship between two quantities.*b. Combine st<strong>and</strong>ard function types using arithmetic operations. Forexample, build a function that models the temperature of a coolingbody by adding a constant function to a decaying exponential, <strong>and</strong>relate these functions to the model..F.BF.3 Identify the effect on the graph of replacing f(x) by f(x) + k, k f(x), f(kx),<strong>and</strong> f(x + k) for specific values of k (both positive <strong>and</strong> negative); find the valueof k given the graphs. Experiment with cases <strong>and</strong> illustrate an explanation ofthe effects on the graph using technology. Include recognizing even <strong>and</strong> oddfunctions from their graphs <strong>and</strong> algebraic expressions for them.F.BF.4 Find inverse functions.a. Solve an equation of the form f(x) = c for a simple function f that has aninverse <strong>and</strong> write an expression for the inverse. For example, f(x) = 2 x 3or f(x) = (x+1)/(x-1) for x ≠ 1.F.LE.4 For exponential models, express as a logarithm the solution to a b ct = dwhere a, c, <strong>and</strong> d are numbers <strong>and</strong> the base b is 2, 10, or e; evaluate thelogarithm using technology.Ch. 5 toCh. 92.2 Ext13.4 to13.6
<strong>Unit</strong> 4: Inferences <strong>and</strong> Conclusions from DataIn this unit, students see how the visual displays <strong>and</strong> summary statistics they learned in earlier grades relate to differenttypes of data <strong>and</strong> to probability distributions. They identify different ways of collecting data—including sample surveys,experiments, <strong>and</strong> simulations—<strong>and</strong> the role that r<strong>and</strong>omness <strong>and</strong> careful design play in the conclusions that can be drawn.Clusters <strong>and</strong> Instructional Notes Common Core State St<strong>and</strong>ards Sections• Summarize, represent, <strong>and</strong> interpret data on asingle count or measurement variable.While students may have heard of the normaldistribution, it is unlikely that they will have priorexperience using it to make specific estimates. Buildon students’ underst<strong>and</strong>ing of data distributions tohelp them see how the normal distribution uses areato make estimates of frequencies (which can beexpressed as probabilities). Emphasize that onlysome data are well described by a normaldistribution.• Underst<strong>and</strong> <strong>and</strong> evaluate r<strong>and</strong>om processesunderlying statistical experiments.For S.IC.2, include comparing theoretical <strong>and</strong>empirical results to evaluate the effectiveness of atreatment.• Make inferences <strong>and</strong> justify conclusions fromsample surveys, experiments, <strong>and</strong> observationalstudies.In earlier grades, students are introduced to differentways of collecting data <strong>and</strong> use graphical displays<strong>and</strong> summary statistics to make comparisons. Theseideas are revisited with a focus on how the way inwhich data is collected determines the scope <strong>and</strong>nature of the conclusions that can be drawn fromthat data. The concept of statistical significance isdeveloped informally through simulation as meaninga result that is unlikely to have occurred solely as aresult of r<strong>and</strong>om selection in sampling or r<strong>and</strong>omassignment in an experiment. For S.IC.4 <strong>and</strong> 5, focuson the variability of results from experiments—thatis, focus on statistics as a way of dealing with, noteliminating, inherent r<strong>and</strong>omness.• Use probability to evaluate outcomes of decisions.Extend to more complex probability models. Includesituations such as those involving quality control, ordiagnostic tests that yield both false positive <strong>and</strong>false negative results.S.ID.4 Use the mean <strong>and</strong> st<strong>and</strong>ard deviation of a dataset to fit it to a normal distribution <strong>and</strong> to estimatepopulation percentages. Recognize that there are datasets for which such a procedure is not appropriate. Usecalculators, spreadsheets, <strong>and</strong> tables to estimate areasunder the normal curve.S.IC.1 Underst<strong>and</strong> statistics as a process for makinginferences about population parameters based on ar<strong>and</strong>om sample from that population.S.IC.2 Decide if a specified model is consistent withresults from a given data-generating process, e.g., usingsimulation. For example, a model says a spinning coinfalls heads up with probability 0.5. Would a result of 5tails in a row cause you to question the model?S.IC.3 Recognize the purposes of <strong>and</strong> differences amongsample surveys, experiments, <strong>and</strong> observationalstudies; explain how r<strong>and</strong>omization relates to each.S.IC.4 Use data from a sample survey to estimate apopulation mean or proportion; develop a margin oferror through the use of simulation models for r<strong>and</strong>omsampling.S.IC.5 Use data from a r<strong>and</strong>omized experiment tocompare two treatments; use simulations to decide ifdifferences between parameters are significant.S.IC.6 Evaluate reports based on data.S.MD.6 (+) Use probabilities to make fair decisions (e.g.,drawing by lots, using a r<strong>and</strong>om number generator).S.MD.7 (+) Analyze decisions <strong>and</strong> strategies usingprobability concepts (e.g., product testing, medicaltesting, pulling a hockey goalie at the end of a game).Ch. 12Ch. 12Supp.