Orient Paper & Industries Ltd
Orient Papers Industries Ltd. - ANS Pvt. Ltd.
Orient Papers Industries Ltd. - ANS Pvt. Ltd.
Create successful ePaper yourself
Turn your PDF publications into a flip-book with our unique Google optimized e-Paper software.
<strong>Orient</strong> <strong>Paper</strong> & <strong>Industries</strong> <strong>Ltd</strong>.13 th September, 2010ANS Research Desk(Research Wing of ANS Pvt <strong>Ltd</strong>)Research By,Bhaskar PatelPranav MehtaAnand Kakkad“ARHAM” Financial CentreHarihar Chowk, RAJKOT (Guj)Speak to: 0281 – 6699401Drop a line to: research@anspl.net
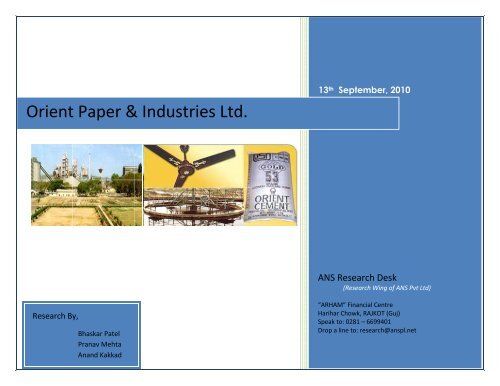
Nifty 18,800Sensex 5,640Script DetailsEquity Capital ` 20.29 CrFace Value ` 1Market Cap ` 1103.1652 Weeks High/Low 66.20/42.606-month avg. volume(BSE) 12,328(NSE) 42,634Shareholding Pattern As On Mar’10 (%)Promoters 33.7%Corporate Bodies & 52%InstitutionsPublic 14.3%14%34%52%PROMOTER CB & INST PUBLICRecommendation: BUY Coverage Initiated on: 7 th Sep, 2010BSE Code: 502420 Bloomberg Code: OPI IN MP as on 7 th Sep: ` 61NSE Code: ORIENTPPR Reuters Code :ORPP.BO CMP: ` 62Overview<strong>Orient</strong> <strong>Paper</strong> & <strong>Industries</strong> (OPIL) was incorporated in 1939 as <strong>Orient</strong> <strong>Paper</strong> Mills. The companyentered into manufacturing of fans in 1954 by setting up Calcutta Electrical ManufacturingCompany, which toady is known as <strong>Orient</strong> Fans.The name was later changed to the present one in the year 1978. Back then the company’s corebusiness was manufacturing of paper.OPIL is part of the C K Birla Group. . Today it has emerged as a multi-product, multi locationcompany.Products<strong>Paper</strong>- The company’s manufacturing facility is located at AMLAI in Madhya Pradesh. This planthas capacity to produces a variety of paper of grades and types. It has also set up facilities toproduce spectrum of soft tissue paper. OPIL paper products are exported to countries likeAfrica, Middle East, Bangladesh, Sri Lanka and Nepal.The company has set up Pan African <strong>Paper</strong> Mills in Kenya in partnership with government ofKenya and International Finance Corporation.Fans- The company manufactures and markets range of fans under the name <strong>Orient</strong> Fans. Itmanufactures ceiling fans, desk fans, wall-mounted fans, pedestal fans, exhaust fans and multi-utility fans. It has production capacity of over 3 million units per annum.The company became first in India to introduce various technologies in order to increase itsproductivity such as die-casting of the rotor and fan body cover in ceiling fans, semi automaticcoil-winding process, Dual assembly line system, automatic coil winding and many more.Cement- The company’s cement unit is located at Devapur in Andhra Pradesh and also atJalgaon, Maharashtra. It has a total production capacity of 5 million tonnes of cement perannum. OPIL produces ordinary portland cement of two grades 43 and 53. It also producesportland cement.
. OutlookThe company is planning to expand it cement business by setting up plants in West Bengal,Orissa, Rajasthan or Karnataka. The project will require an investment of Rs 320 crore.FINANCIAL HIGHLIGHTSSource: ACE EquityPROFIT & LOSS(IN Crore)Particulars 3month Jun 10 3 month Jun 09 Year End Mar 10Gross Sales 494 377.19 1769Other Income 1 0.85 6.42Total Exp. 370 282.60 1312Op. Profit 81 66.12 317.23Interest 10 6.07 34.53PBT 51 51.12 234.10Tax 13 17.57 74.80Profit/Loss after Tax 34.24 33.56 159.31Net Profit 34.24 33.56 159.31Adjusted EPS 1.8 1.74 8.261. Gross sales have increased to ` 494 Cr by 30.96% as compared to the correspondingperiod of the previous year.2. Profit before tax decreased marginally to ` 51 Cr from ` 51.12 Cr in the same quarterprevious year.3. Net profit of the company stood at ` 34.24 Cr against profit of ` 33.56 Cr in the samequarter previous year an increase of 2.02%4. Adjusted EPS of the company is at ` 1.8 against EPS of ` 1.74 in the same quarterprevious year.
Consolidated Segment Wise RevenuePROFIT & LOSS(IN Crore)Particulars 3month Jun 10 3 month Jun 09 Year End Mar 10Segment Revenuea) Cement 284.32 215.49 894.75b) <strong>Paper</strong> & board 21.43 27.93 239.38c) Electrical consumer durables 134.74 101.83 480.84d) Other 1.085 0.853 4.76Total Operating Income 441.59 346.11 1619.752. Segment Resultsa) Cement 77.50 68.11 253.90b) <strong>Paper</strong> & board (23.31) (22.84) (43.12)c) Electrical consumer durables 9.58 15.10 61.74d) Other 0.0915 0.0984 .2617Total 63.86 60.48 272.78Add/(Less)i) Interest (Net) (10.07) (6.07) (34.53)ii) Other Un-allocable items,Investment Income andExceptional Expenditure(2.50) (3.28) (4.15)Total Profit before Tax 51.29 51.12 234.101. Revenue from cement increased by 32%, revenues from paper decreased by 23% and fromelectrical consumer durables it increased by 32% as compared to the same quarter in theprevious year.2. Interest paid by the company increased from `6.07 Cr to `10.07 Cr.3. PBT changed marginally from ` 51.12 Cr to ` 51.29 Cr.Source: Company, ACE Equity, ANS Research
FINANCIAL HIGHLIGHTS2,500.002,000.001,500.001,000.00500.000.00NETSALESP & L COMPARISONEXPEND PAT EPSPROFIT & LOSSParticulars Mar 12 E Mar 11 E Mar 10 Mar 09Net Sales 2082.83 1859.67 1,660.42 1,543.86Other Income 20.82 18.59 14.74 23.42Total Exp. 1668.99 1490.17 1,353.22 1,150.74Op. Profit 434.65 388.087 321.93 416.55Depreciation 57.84 51.6472 55.02 34.73Interest 64.88 57.9 34.53 20.70Tax 99.81 89.12 74.80 110.04PAT/ Net Profit 212.1 189.3 157.58 202.41Adjusted EPS 11.04 9.86 8.17 10.48Div (%) 150.00 150.00 150.00 150.00(IN CRORES)Mar 08 Mar 071,406.29 1,215.4321.17 16.941,062.89 969.32364.57 263.0533.86 32.9031.61 47.85108.35 63.13190.75 119.189.77 7.55120.00 100.002008 2009 2010 2011 (E) 2012 (E)1.2.3.4.*Provided that no equity dilution is done and number of shares remain the same.Net Sales have shown a CAGR of 17.3% over last 5 years. Net sales have increased at a rate of17.3% over last 5 years. In our forecast we have assumed that the company going forwardwould grow at 12%.Other Income: In our forecast we have estimated to be 1% of Net sales of that year.Total Expenditure: : Historically total expenditure was around 74%-89% of net sales and otherincome. We expect total expenditure to be 80.1% of NS and OI.Tax Expense: We have estimated the tax rate to be 32%Source: Company, ACE Equity, ANS Research
BALANCE SHEET8006004002000BALANCE SHEETFUNDS DEBTS BV/SHR CONT. LIA2007 2008 2009 20101.2.3.(IN CRORES)Particulars Mar 10 Mar 09 Mar 08 Mar 07 Mar 06Total Funds 776.61 653.09 579.62 281.90 192.01Total Debts 516.25 465.98 265.00 431.78 549.55Net Block 1,116.29 385.21 598.48 565.48 586.10Cash & Bank 46.72 33.82 27.08 17.78 18.00Net Current Assets 183.00 113.87 130.71 152.91 151.86Contingent Liabilities 230.03 172.02 141.52 113.62 104.31Adjusted Book Value 39.75 33.21 28.90 15.43 9.46The company’s funds have more then quadrupled in last 5 years while its debts is almost thesame as in March 2006.The book value of the company has quadrupled in last 5 years from ` 9.46 to ` 39.75.The latest enterprise value of the company is ` 1662.39 Cr while market cap of the company is`1192.84 Cr and reserve of the company is `756.33 Cr.Source: Company, ACE Equity, ANS Research
CASH FLOW(IN CRORES)Particulars Mar 10 Mar 09 Mar 08 Mar 07 Mar 06300Cash FlowCash From Operations 261.90 263.22Cash From Investments -223.39 -498.56273.56 231.98 98.53-200.45 -62.93 -6.452001000-100Cash From Financing -25.63 242.62Net Cash Inflow/Outflow 12.89 7.28Opening Cash & Cash Equity 33.29 26.01-64.18 -169.43 -92.488.93 -0.38 -0.4017.09 17.47 17.87-200-300Closing Cash & Cash Equiv. 46.70 33.2926.01 17.09 17.47-400-500from operations from investing from financing1.2.3.Cash from operating activities has been positive for all the previous years however it’s currentyear CFO is lower in comparison to the previous two years.CFI has decreased on account of decrease in purchased of fixed assetDue to higher CFI as compared to previous year the net cash inflow in Mar 10 is higher then Mar09.Sources: Ace Equity, Company Annual Reports
Cash Flow RatiosRATIOSParticulars Mar 10 Mar 09 Mar 08 Mar 07 Mar 06Cash Flow Per Share 13.58 13.64 14.07 154.73 61.76Price to Cash Flow Ratio 3.72 1.79 3.20 0.27 0.44Free Cash Flow per share 1.87 -11.25 3.35 71.27 34.48Price to Free Cash Flow 26.98 -2.16 13.44 0.58 0.79Sales to cash flow ratios 6.34 5.85 4.87 4.91 9.55Financial RatiosRATIOSParticulars Mar 10 Mar 09 Mar 08 Mar 07 Mar 06D/E Ratio 0.7 0.61 0.85 2.31 3.65Current Ratio 2.12 1.93 1.73 1.82 1.91Interest Coverage Ratio 7.73 16.09 10.46 4.81 1.53PBIDTM (%) 17.79 24.05 22.62 19.06 10.93PATM (%) 8.71 11.69 11.84 8.64 2ROCE (%) 22.33 34.42 43.53 32.73 12.37ROE (%) 22.41 33.82 47.94 61.87 16.47Net Sales Growth (%) 7.55 9.78 15.7 24.97 16.55EBIT Growth (%) -19.88 0.74 43.69 154.75 53.74PAT Growth (%) -22.15 6.12 60.05 427.77 -739.73Sources: Ace Equity, Company Annual Reports, ANS Research
POSITIVESDiversified portfolioThe company’s business is diversified in to cement, paper and electrical. The products of thecompany are:Cement• ‘Birla A1’ premium blended cement• ‘<strong>Orient</strong> Gold’ – 53 grade cement<strong>Paper</strong>• Tissue papers• Writing and printing papers• ‘<strong>Orient</strong>’ photocopying papers• ‘1st Choice’ notebooksElectricals• ‘<strong>Orient</strong> PSPO’ ceiling, table, pedestal, wall and exhaust fans• ‘OLO’ CFLs and lighting products<strong>Orient</strong>’s businesses – cement, paper and electrical – are core to economic growth and captureevery upturn of a dynamic India.Established brands<strong>Orient</strong> has nurtured and grown popular brands.• ‘<strong>Orient</strong> PSPO’ is a trusted national fan brand with a growing international presence.• ‘Birla A1’ and ‘<strong>Orient</strong> Gold’ are preferred cement brands.• <strong>Orient</strong>’s ‘Diamond Touch’ writing and printing paper is the industry benchmark for notebooks and its ‘1st Choice’ notebooks have created a distinct recall in a short time.
Strong financials• <strong>Orient</strong> has funded its expansions mostly through internally generated resources andcontinues to maintain a healthy debt-equity ratio of 0.7 and debt service coverage ratio(DSCR).Low cost cement productionOPIL is one of India’s lowest cost cement producers trading at $ 71 EV/ tn and currently produces5mpta with 3 mtpa from AP plant and 2 mtpa from Jalgaon plant. The products produced in thisplants are Portland Pozzolana cement (PPC) and Ordinary Portland Cement (OPC) having brandproducts namely Birla A1 premium cement (PPC) and <strong>Orient</strong> Gold Cement (OGC)Advantages for paper industry<strong>Paper</strong> prices dropped 6–10% in 2009-10. However, domestic and international prices started toimprove since March 2010. The domestic demand for paper is expected to receive a boost from thecensus and UID initiatives. The company is one of India’s largest producers of tissue paper andconsidered the industry benchmark for note book paperThe company’s paper portfolio consists of brands such as:• ‘Diamond touch’ (writing and printing papers)• ‘<strong>Orient</strong>’ (photocopying paper)• ‘1st Choice’ (note books and stationeries)
Electrical divisionThe company is the largest manufactures of electrical fans in India and has the largest share inexporting the fans. The company’s brand includes <strong>Orient</strong> PSPO fans and <strong>Orient</strong> CLO (CFL).The company’s electrical portfolio consists of:• Electrical fans• Compact fluorescent lighting (CFL)• Fluorescent tube lamp (FTL)• LuminariesReduce in water consumption in paper productionThe company has been able to reduce its water consumption from 8 million gallons per day to 6million gallons per day through greater recycling. Work is on hand to further reduce this to 5million gallons per day according to the company’s annual reports.Sources: Ace Equity, Company Annual Reports, ANS Research
RISKSOversupply in cement sectorCurrently there is an oversupply in the cement sector due to decrease in demand due to ongoingmonsoon season during which construction activity is at its trough.Days lost due to annual shutdown<strong>Paper</strong> production for the year under review was again disrupted during the year under reviewinitially for plant up gradation and subsequently for water shortage. In all company lost productionfor 76 days during the year.Increase in the price of raw materialsPossible increases in cost of coal, wood and bamboo continue to remain areas of concern whichmay impact profit marginsSources: Ace Equity, Company Annual Reports, ANS Research
RecommendationsAt current market price of ` 62 the company is trading at a trailing PE of 7.6 against industry PE of8.88 and with a beta of 0.6986. We expect FY 11 (E) EPS to be ` 9.86 and FY 12 (E) EPS to be` 11.04. So at CMP of ` 62 OPIL is trading at a one year forward PE of 6.28 and a two yearforward PE of 5.61.Taking an industry PE of 8.88 and the forward earning our target for FY 11 (E) comes out to be` 87.55 with an potential upside of 41% and our target for FY 12 (E) comes out to be ` 98 with anpotential upside of 58%.Sources: Ace Equity, ANS Research
Disclaimer: The information being provided to you is compiled from sources we believe to be reliable. ANS Pvt. <strong>Ltd</strong> cannot and does not take anyguarantees about the accuracy, reliability, validity or timeliness of the information and/or data provided/made available to you in this document.The views are purely indicative. Neither ANSPL nor any of its associates, subsidiaries, affiliates, directors, and/or officials become liable or have anykind of responsibility for any loss or damage that you may incur from any decisions taken by you based on our recommendations. None of theinformation contained herein constitutes a solicitation from ANSPL to Buy and/or Sell securities and/or any Future, Options or Other FinancialContracts. Clients may exercise their own caution and double check or verify the information contained in our recommendations.


