H U M A N S E C U R I T Y B R I E F 2 0 0 6
H U M A N S E C U R I T Y B R I E F 2 0 0 6 - Human Security Report ...
H U M A N S E C U R I T Y B R I E F 2 0 0 6 - Human Security Report ...

Create successful ePaper yourself
Turn your PDF publications into a flip-book with our unique Google optimized e-Paper software.
H U M A N S E C U R I T Y B R I E F 2 0 0 6H U M A N S E C U R I T Y C E N T R ET H E U N I V E R S I T Y O F B R I T I S H C O L U M B I A , C A N A D A
C O N T E N T SOverview ............................................................................................................................ 1Chapter 1 Trends in Armed Conflict .............................................................................. 6Chapter 2 Deadly Assaults on Civilians ........................................................................ 11Chapter 3 How Wars End .............................................................................................. 18The Next Human Security Report ................................................................................... 24L i s t o f f i g u r e sFigure 1.1 Number of State-based Armed Conflicts by Type, 1946-2005 ................................ 7Figure 1.2 Number of State-based Armed Conflicts, 2002-2005 ............................................. 7Figure 1.3 Number of Reported, Codable Deaths from State-basedArmed Conflicts, 2002-2005 ....................................................................................... 8Figure 1.4 Average Number of Battle Deaths per State-basedArmed Conflict, per Year, 1950-2005 .......................................................................... 9Figure 1.5 Number of Non-state Armed Conflicts, 2002-2005 .............................................. 10Figure 1.6 Number of Reported, Codable Deaths from Non-stateArmed Conflicts, 2002-2005 .................................................................................... 10Figure 2.1 Number of Campaigns of One-sided Violence, 1989-2005 ................................... 12Figure 2.2 Number of Campaigns of One-sided Violence by Region, 1989-2005 ................. 12Figure 2.3 Number of Reported, Codable Deaths from One-sided Violenceby Region, 1989-2005 .............................................................................................. 13Figure 2.4 Number of Campaigns of One-sided Violence by Perpetrator, 1989-2005 ........... 14Figure 2.5 Number of Genocides and Politicides, 1956-2005 .................................................. 15Figure 2.6 Number of International Terrorist Incidents, 1968-2005 ....................................... 15Figure 2.7 Number of International Terrorist Incidents in South Asiaand the Middle East and Persian Gulf ..................................................................... 16Figure 3.1 Average Number of Armed Conflict Onsets and Terminations,per Year, 1950-2005 .................................................................................................. 19Figure 3.2 Number of State-based Armed Conflict Terminations, 1946-2005 ....................... 20
Andrew Testa / Panos Pictures. AFGHANISTAN.
But the advocates of “give war a chance” assume thatbelligerents can choose between victory and a negotiated settlement.Often there is no such choice.Conflicts usually become drawn-out affairs preciselybecause neither side can impose a military defeat on the other.And when victory is not an option, negotiation is the only wayto stop the fighting.The choice, in other words, is not between victory and anegotiated settlement, but between negotiation and no settlementat all.Other skeptics have argued that today’s conflicts are moreintractable than those of the recent past—those that were easyto resolve have already been negotiated and settled.This is too pessimistic a view for two reasons. First, manyconflicts that once appeared intractable have in fact beenresolved in the past decade. These include the wars in EastTimor (Timor Leste), Aceh (Indonesia), Nepal, Angola, Liberia,and Sierra Leone.Second, 71% of the conflicts that are currently underwayaround the world have lasted less than 10 years. These canhardly be written off as “intractable.”When victory is not an option,negotiation is the only way to stopthe fighting.On average over the past six years, more conflicts havestopped than started each year. There is no reason to expectthis trend to continue, but nor is there any reason to expect itto be reversed.H U M A N S E C U R I T Y B R I E F 2 0 0 6 5
6050403020Intrastate conflictsInternationalized intrastate conflictsInterstate conflictsExtra-state conflictsFigure 1.1 Number of State-basedArmed Conflicts by Type, 1946-2005The rising share of intrastate conflictsas a percentage of all armed conflictsreveals how the nature of warfarehas changed over the past 60 years.Data source: UCDP/PRIO 15100194619511956196119661971197619811986199119962001Figure 1.2 Number of State-based Armed Conflicts, 2002-2005Region 2002 2003 2004 2005Africa, sub-Saharan 13 7 8 5Americas 2 1 3 2Asia, Central and South 7 10 10 9Asia, East and SE and Oceania 5 5 4 7Europe 1 1 1 1Middle East and north Africa 4 6 6 7Total 32 30 32 31Data source: UCDP/Human Security Centre DatasetThe number of state-based armed conflicts has remained relatively constant over the last four years, thoughthe global figure masks sharp differences in the regional trends.16Figure 1.2 shows that the greatest change has been in sub-Saharan Africa where the number of state-based conflicts hasdropped by more than 60% between 2002 and 2005. There hasalso been a large decline in the number of countries in the regionexperiencing state-based conflicts over this period from 11 tofour. (Note that some countries have more than one conflict.)The year 2005 was also the first year since 1996 in whichsub-Saharan Africa did not experience a war—that is a conflictthat results in more than 1,000 battle deaths in a calendar year. 13Central and South Asia emerged as the region mostaffected by state-based conflicts in 2005. The countries in thisregion suffered both the greatest number of conflicts and thegreatest number of battle deaths. Despite this, the death tollfrom state-based armed conflict in Central and South Asiawas at its lowest point since 1984. 14Although the Middle East and north Africa is home toIraq, the country that suffered the world’s single most deadlyconflict in 2005, the region ranked second in terms of thenumber of state-based conflicts and, according to UCDP,second in terms of deaths from state-based conflicts. 17With seven state-based armed conflicts being wagedin 2005, East and Southeast Asia outranked three otherregions and ranked second in terms of numbers of armedconflicts with the Middle East and north Africa. However,according to UCDP, the total battle-death toll for East andSoutheast Asia was below 1,000, making it the second-leastdeadly region.There was only one state-based armed conflict in Europein 2005—that in Chechnya—but by late 2006 the Chechenrebellion appeared to be coming to an end.H U M A N S E C U R I T Y B R I E F 2 0 0 6 7
Battle-Death Trends in State-basedArmed ConflictUCDP’s data indicate that there were fewer battle deaths in2005 than in any year since 1946. 18 Figure 1.3 shows that justtwo regions—Central and South Asia and the Middle Eastand north Africa—accounted for over 60% of the global toll in2005. And one conflict, that in Iraq, accounted for almost 20%of battle-deaths worldwide.In addition to experiencing a major drop in the number ofconflicts being waged on its soil, sub-Saharan Africa has alsowitnessed a significant drop in battle deaths. In 2005 UCDPestimates that there were just 1,851 deaths from state-basedconflict throughout the region—a decline of some 98% fromthe post-Cold War high in 1999 of nearly 100,000 when particularlydeadly conflicts were being waged in the Great Lakesregion and between Ethiopia and Eritrea.In 2005 the five countries that experienced the most deathsfrom state-based conflict were Iraq, Nepal, India, Afghanistan,and Colombia.Interstate conflicts have been the major drivers of wardeaths during the Cold War years—1950 to 1989. But as Figure1.4 clearly shows, in the post-Cold War period their share ofthe total death toll has shrunk from decade to decade.It is no accident that interstate wars are so much deadlierthan other types of war. Fighting a war with another countryrequires power projection capabilities and heavy weapons—inother words the capacity to create large numbers of casualties.The major interstate wars since 1950—the Korean War, theVietnam War, the Iran-Iraq war, the two US-led invasions ofIraq, and the Ethiopia-Eritrea war—were all fought with largearmies and heavy weapons. And, unlike the mostly low-intensitywars of the past decade and a half, they involved majormilitary engagements. The decline in interstate armed conflictsince the Cold War ended has been a major factor drivingdown the global battle-death toll.It is no accident that interstate warsare so much deadlier than othertypes of war.Intrastate conflicts have been the most prevalent form ofarmed conflict in the period 1950 to 2005 but, as Figure 1.4shows, they account for a relatively small share of total battledeaths in this period. Again this is not surprising. Absentexternal military support, and often fought with small armsand light weapons and relatively few troops, these conflicts—particularlyin recent years—have had relatively lowfatality rates.Since the end of the Cold War internationalized intrastateconflicts have killed more people than any other type ofconflict. The current conflicts in Afghanistan and Iraq are bothin this category, since the US is not fighting the incumbentgovernments but assisting them. If the latter were the casethese would be interstate conflicts.) Foreign military assis-Figure 1.3 Number of Reported, Codable Deaths from State-based Armed Conflicts, 2002-2005*Region 2002 2003 2004 2005Africa, sub-Saharan 4,741 3,427 2,914 1,851Americas 1,200 518 1,478 1,106Asia, Central and South 5,292 3,094 3,924 4,186Asia, East and SE and Oceania 851 1,630 1,236 978Europe 753 480 1,151 668Middle East and north Africa 2,885 11,183 6,231 3,250Total 15,722 20,332 16,934 12,039Data source: UCDP/Human Security Centre DatasetThe number of reported, codable deaths from state-based armed conflicts declined slightly between 2002and 2005. However, given the challenges in counting and coding battle deaths, particularly in Iraq, thesefigures should be treated with caution.*Fatality figures are “best estimates.”8H U M A N S E C U R I T Y B R I E F 2 0 0 6
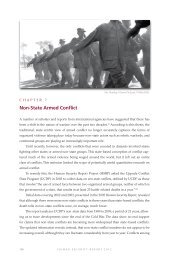
tance increases the killing capacity of the warring parties ininternationalized intrastate wars.Extra-state conflicts are essentially the wars of colonialliberation. They were fought for just three decades followingthe end of World War II. However, at times in the late 1940sand 1950s they accounted for 20% to almost 50% of all statebasedconflicts. Furthermore, from 1954 to 1961 extra-stateconflicts were, on average, the deadliest form of armed conflict.France’s colonial wars in Indochina and Algeria were the mostdeadly in the period 1950 to 2005.Non-state Armed ConflictNon-state conflicts are those fought between militias, rivalguerrilla groups, clans, warlords, or organized communalgroups, without the involvement of a government. 19 Althoughnon-state conflicts are about as prevalent as state-basedconflicts, they are not recorded in the annual war countsthat are published in the Journal of Peace Research nor in theStockholm International Peace Research Institute’s SIPRIYearbook, both of which rely on UCDP data.Figure 1.4 Average Number of Battle Deaths perState-based Armed Conflict, per Year, 1950-2005*non-state conflict was just 82; for state-based conflicts itwas 388.Non-state conflicts also tend to be relatively short induration. Just over a quarter of the 25 non-state armedconflicts in 2005 were also active in 2004. Of these, onlyone—that between the Revolutionary Armed Forces (FARC)and the United Self-Defence Forces (AUC) in Colombia—hasbeen active each year since 2002. Given their low death tollsand short duration, it is not surprising that many non-stateconflicts are so little known outside the countries in whichthey occur. 21Non-state armed conflicts tend to occur in countrieswith weak governments that have little capacity for maintaininginternal security. In 2005, as has been the case in each ofthe four years that data have been collected, over half of theworld’s non-state armed conflicts occurred in sub-SaharanAfrica. The region has nevertheless seen a 42% decrease inthese conflicts over the past four years.Sub–Saharan Africa accounted forthe majority of deaths from non–state conflict in 2005.70(‘000)6050403020100Internationalized intrastateIntrastate conflictsInterstate conflictsExtra-state conflictsTotal1950–59 1960–69 1970–79 1980–89 1990–99 2000–05Data source: UCDP/PRIO and Lacina & Gleditsch 20Interstate wars, though relatively few in number,are by far the deadliest form of conflict.*Fatality figures are “best estimates.”Concerned that this omission created a very incompletepicture of armed conflict around the world, the HumanSecurity Centre commissioned UCDP to collect data onnon-state conflicts for the Human Security Report 2005. Thischapter presents new non-state conflict data for 2004 and2005 that complement the material published in 2005.Non-state conflicts are significantly less deadly thanstate-based conflicts. In 2005 the average death toll for eachFigure 1.5 shows the regional distribution of non-stateconflicts. Both the concentration of these conflicts in Africaand their sharp decline since 2002—from 24 to 14 in 2005—are clearly evident in the table, which also reveals that Europeis the only region in this period to have experienced no nonstateconflicts.Non-state conflicts tend to be concentrated not only inthe sub-Saharan African region, but also within particularAfrican countries. In 2005 five African countries accountedfor 15 of the 25 non-state conflicts: Somalia experienced sixconflicts; Nigeria three; while Ethiopia, the Ivory Coast, andSudan had two each.Battle-death Trends in Non–state ConflictsFigure 1.6 shows that sub-Saharan Africa accounted for themajority of deaths from non-state armed conflict in 2005—and indeed in all four years since data collection began. Butthere has been a dramatic 80% decline in the death toll inthe region since 2002. Central and South Asia experienced aneven greater decline in death toll—dropping some 88%. (Notethat the Sudan/Darfur data are included in the Middle Eastand north Africa region, not sub-Saharan Africa.)H U M A N S E C U R I T Y B R I E F 2 0 0 6 9
Figure 1.5 Number of Non-state Armed Conflicts, 2002-2005Region 2002 2003 2004 2005Africa, sub-Saharan 24 23 17 14Americas 2 2 4 3Asia, Central and South 3 5 3 4Asia, East and SE and Oceania 2 0 1 1Europe 0 0 0 0Middle East and north Africa 3 3 3 3Total 34 33 28 25Data source: UCDP/Human Security Centre DatasetThere was a 26% decline in the number of non-state conflicts between 2002 and 2005. Most of the declinewas in sub-Saharan Africa.Figure 1.6 Number of Reported, Codable Deaths from Non-state Armed Conflict, 2002-2005*Region 2002 2003 2004 2005Africa, sub-Saharan 4,465 3,155 2,942 909Americas 595 129 345 427Asia, Central and South 1,687 298 289 206Asia, East and SE and Oceania 91 0 52 29Europe 0 0 0 0Middle East and north Africa 176 490 240 475Total 7,014 4,072 3,868 2,046Data source: UCDP/Human Security Centre DatasetThere was a 71% decline in the number of reported and codable deaths from non-state conflict between2002 and 2005. However, given the challenges in counting and coding battle deaths, particularly in Iraq,these figures should be treated with caution.*Fatality figures are “best estimates.”Trends versus Absolute NumbersCounting armed conflicts is much more straightforwardthan estimating battle-death tolls. To determine whetheror not there has been a conflict, researchers need only toknow whether there have been 25 or more battle deaths ina calendar year. Determining the exact number of battledeaths is both far more difficult and far more contested—asthe recent controversies about the death tolls in Iraq attest. 22We can be very confident about trends in the numbersof armed conflicts worldwide, but we can have much less faithin battle-death estimates. This is particularly true in the caseof high-intensity conflicts that have very high numbers offatalities. UCDP’s stringent coding rules, together with themany challenges involved in reporting casualties, mean thatmany of the battle-death numbers published here are too low.But since the undercounting bias is relatively consistent, thedata can still determine whether fatality rates are increasingor decreasing. This sort of information, which is criticallyimportant for policy-makers, can only be obtained fromtrend data.10H U M A N S E C U R I T Y B R I E F 2 0 0 6
Martin Adler / Panos Pictures. LIBERIA.C H A P T E R 2Deadly Assaults on CiviliansIt is widely believed—in the media, NGOs, governments, andinternational agencies—that civilians are being targeted, andkilled, in ever-greater numbers by the perpetrators of politicalviolence. There is, however, very little hard evidence to supportsuch a claim.This chapter reviews the latest findings of a datasetcommissioned from the Uppsala Conflict Data Program(UCDP) by the Human Security Centre. The data measure theworldwide incidence of organized violence against civiliansfrom 1989 to 2005. The findings of this dataset are thencompared with those of two others that also measure—albeitvery differently—the global toll of civilians intentionally killedeach year in campaigns of political violence.The Political Instability Task Force’s dataset on genocidesand politicides details programs of mass violence directedprimarily at civilians from 1956 to 2005.The dataset compiled by the Memorial Institute for thePrevention of Terrorism’s Terrorism Knowledge Base tracksthe number of international terrorist incidents from 1968to the present day, and the fatalities associated with theseincidents. It also has data on the number of domestic terroristincidents and fatalities since 1998.Each dataset focuses on the intentional killing of civilians—not on cases of “collateral damage,” where noncombatants arecaught in the crossfire of military engagements, or become theunintended victims of artillery attacks or aerial bombing.None of the datasets count deaths from interpersonalviolence, nor “indirect deaths” from war-exacerbated diseaseand malnutrition. In poor-country wars the latter kill far morecivilians than do bombs and bullets. The extent and drivers ofindirect deaths will be examined in detail in the next HumanSecurity Report.Trends in “One-sided Violence”UCDP describes intentional attacks against civilians as “onesidedviolence”—the term reflecting the fact that the victimscannot fight back. 23The new UCDP dataset counts civilian deaths in violentcampaigns (UCDP uses the term “cases”) perpetrated byeither governments or armed non-state groups each year. Thelatter category includes rebels, militias, warlords, clans, andother organized communal groups. In a few cases violenceby organized criminal gangs is included. To count as a case ofone-sided violence, at least 25 civilians must be killed in thecourse of a calendar year by the same government or nonstatearmed group.What do the new data tell us? First, that while the numberof armed conflicts being waged around the world declinedby more than 40% from 1992 to the present, the number ofviolent campaigns that intentionally target civilians increasedby more than half.Second, that most of these campaigns, and most of thefatalities that result from them, have been concentrated insub-Saharan Africa.H U M A N S E C U R I T Y B R I E F 2 0 0 6 11
Third, that organized violence against civilians isstrongly associated with armed conflicts. The data showthat three quarters of the perpetrators of violent campaignsagainst civilians were also involved in ongoing state-basedFigure 2.1 Number of Campaignsof One-sided Violence, 1989-2005403530252015105019891990199119921993199419951996199719981999200020012002200320042005Data source: UCDP/Human Security Centre DatasetCampaigns of organized violence against civilianshave increased steadily but unevenly since the endof the Cold War.armed conflicts. Civil wars and assaults on civilians arestrongly interrelated. 24Fourth, that in most of the period 1989 to 2005—and withthe obvious exception of the Rwandan genocide—the numberof civilians killed in campaigns of organized violence has beenrelatively small compared with the total number of peoplekilled in armed combat.The trend line in Figure 2.1 shows the number of violentcampaigns against civilians rising unevenly from 18 to 28between 1989 and 2005—a 55% overall increase. This findingfits with the widely held belief that civilians have beenincreasingly targeted by both rebels and governments in thesomewhat chaotic post-Cold War years.It is not clear, however, why there should have been anincrease in campaigns of low-level violence against civilians,especially since the armed conflicts with which such campaignsare so often associated have declined in number.There have been a number of recent attempts to explainwhy governments and rebels intentionally target civilians. 25 Butnone of these studies has sought to account for the post-ColdWar increase in campaigns of organized violence—perhapsbecause few researchers have realized that such a trend exists.Figure 2.2 Number of Campaigns of One-sided Violence by Region, 1989-200514121086420Sub-Saharan AfricaMiddle East and north AfricaCentral and South AsiaAmericasEast and Southeast Asia and Oceania1989 1991 1993 1995 1997 19992001Europe2003 2005Data source: UCDP/Human Security Centre datasetSub–Saharan Africa experienced the highest number of campaigns of one-sided violence between 1989 and2005; Europe experienced the fewest.12H U M A N S E C U R I T Y B R I E F 2 0 0 6
Figure 2.3 Number of Reported, Codable Deaths from One-sided Violence by Region, 1989-2005*RegionReported, codable deathsAfrica, sub-Saharan** 535,890Americas 8,187Asia, Central and South 13,903Asia, East and SE and Oceania 3,678Europe 14,811Middle East and north Africa 12,920Total 589,389Data source: UCDP/Human Security Centre DatasetEven without the huge death toll from the 1994 genocide in Rwanda (included in the above figure), sub-Saharan Africa has still suffered more deaths from one-sided violence than any other region.*Fatality figures are “best estimates.”**Uppsala’s “best” estimate for the death toll from the Rwandan genocide is 500,000, considerably lower than the more commonly cited figure of 800,000 which isalso Uppsala’s “high” estimate.Regional DifferencesSub-Saharan Africa endured 143 campaigns of deadly violenceagainst civilians between 1989 and 2005, more than any otherregion in the world. Fifty-three different actors (governmentsor non-state armed groups) perpetrated violent campaignsagainst civilians in 19 different countries.There were far fewer violent campaigns against civiliansin other regions in the period under review. Central and SouthAsia had 89 campaigns; the Middle East and north Africa 74;the Americas 44; East and Southeast Asia 38; and Europe 24,between 1989 and 2005.In addition to the high number of campaigns of onesidedviolence in sub-Saharan Africa, Figure 2.2 clearly showsthe sharp increase in violent campaigns against civilians in theMiddle East and north Africa that began in the new millennium.A large part of this increase has been associated with theupsurge of violence against civilians in Iraq and in Darfur. 26In East and Southeast Asia there was a marked increasein campaigns directed against civilians starting in 2001, butthere has been no consistent trend in Europe (which includesRussia), nor in the Americas.The difficulty UCDP researchers confront in establishingreliable estimates of death tolls from one-sided violenceis evident in the large variations between their “best” and“high” estimates of death tolls for some countries. In Darfur,for example, where obtaining reliable data is fraught withdifficulty, UCDP’s high estimate is eight times larger than itslow estimate.So the civilian fatality shown in Figure 2.3 shouldbe regarded with considerable caution—and seen as a veryrough guide to differences in the extent of killing betweenregions rather than a true reflection of different regional civiliandeath tolls.Knowing the civilian death tolls from one-sided violencefor each region over a 17-year period tells us little about trendswithin each region. In some cases there are no clear trends,but in sub–Saharan Africa there has been a steep, but veryuneven, decline in civilian deaths since the Rwandan genocidein 1994.In sub-Saharan Africa there has beena steep decline in civilian deathssince the Rwandan genocide in 1994.It is hard to overstate just how extreme and unusualan event the Rwandan genocide was. In just a few monthsmore than five times as many civilians were slaughtered in thisone country as in all other countries in the world from 1989 to2005. In fact the estimated death toll was almost as large as theglobal toll from all state-based conflicts in 1950, the deadliestyear for battle deaths in the entire post-World War II era.In the other regions, Europe had two sharp peaks in civiliandeath tolls—in the early and mid-1990s, with a muchsmaller peak in 1999. All were associated with conflicts in theH U M A N S E C U R I T Y B R I E F 2 0 0 6 13
Balkans. The Americas experienced a relatively stable low levelof one-sided deaths until 2001 and the September 11 attackon New York’s World Trade Center. Central and South Asiasuffered relatively few one-sided deaths, with the exceptionof a sharp peak in 1998 that was largely associated with theviolence in Afghanistan.The one-sided violence death toll in the Middle East andnorth Africa was also relatively low and stable until 2001.Between 2001 and 2004 the estimated number of civiliansintentionally killed increased twentyfold.Even if we exclude the slaughter in Rwanda, UCDP’s datasuggest that there has been a clear, albeit very uneven, globaldecline in the number of deaths resulting from one-sided violencesince 1994. From 1995 to 1999 UCDP recorded a (bestestimate) average of 8,000 civilian deaths per year; from 2000to 2005 the average had dropped to 4,800. But given uncertaintiesabout the death toll in Iraq and given the huge variationbetween the best and high estimates in Darfur, the datareally are not robust enough to make any claims about trendswith confidence.The Worst Perpetrators?Who perpetrates the most violence against civilians—governmentsor non-state armed groups? The answer depends onwhat is being measured.In the 17 years under review (1989 to 2005), non-statearmed groups instigated more violent campaigns against civiliansthan did governments—and they did so with increasingfrequency over the period. Far fewer governments have beenFigure 2.4 Number of Campaigns of One-sidedViolence by Perpetrator, 1989-200530Campaigns perpetrated by non-state armed groups25 Campaigns perpetrated by governments2015105019891990199119921993199419951996199719981999200020012002200320042005Data source: UCDP/Human Security Centre DatasetNon-state armed groups were responsible for mostcampaigns of organized violence against civiliansbetween 1989 and 2005.involved in organized violence against civilians than non-stategroups, but state-perpetrated violence killed more civilians infour out of the 17 years.As Figure 2.4 shows, the incidence of campaigns againstcivilians by non-state armed groups increased over the period,while the incidence of government campaigns changed little.Far fewer governments have been involvedin organized violence againstcivilians than non-state groups.The data, however, almost certainly underestimate theresponsibility of governments for killing civilians. In somecases—the Janjaweed militias in Darfur are an obvious contemporaryexample—non-state groups may be little morethan government surrogates.Genocides and PoliticidesBarbara Harff of the United States Naval Academy, whocompiled the genocide/politicide database used by thePolitical Instability Task Force (PITF), defines genocidesand politicides as campaigns of “political mass murder” thatare directed primarily against civilians and are intended toexterminate “in whole or in part” a communal, political,or politicized ethnic group. 27 (Politicides are similar togenocides except that their victims are targeted because oftheir political convictions rather than their ethnicity andreligion, as is the case with genocide.)While both PITF and UCDP’s one-sided violencedatasets record cases of organized violence against civilians,the PITF dataset is concerned primarily with campaigns ofmass violence.As Figure 2.5, which updates the 1956 to 2001 data presentedin the 2005 Human Security Report, shows, cases ofgenocide and politicide declined by 90% between 1989 and2005. Over the same period UCDP’s one-sided violence datasettracked a 55% increase in campaigns of violence againstcivilians—from 18 to 28.Given that both datasets are tracking organized violenceagainst civilians, how can such contradictory trendsbe explained?In fact there is no necessary contradiction. Professor Harff’sdataset only tracks a relatively small number of campaigns ofmass violence against civilians and almost all of these takeplace in the context of major intrastate armed conflicts. Since14H U M A N S E C U R I T Y B R I E F 2 0 0 6
12108642019561961Figure 2.5 Number of Genocidesand Politicides, 1956-2005196619711976the end of the Cold War the number of major intrastate conflictshas declined by some 80%; with this decline has come acommensurate reduction in genocides/politicides.UCDP, on the other hand, tracks the far more numerousminor campaigns of violence against civilians, in additionto genocides and politicides with their much higherdeath counts. The Harff dataset does not include any of theminor campaigns.Starting in 2001 the downward trendin international terrorism incidentswas reversed.1981Data source: Barbara Harff, 2005 28The number of genocides and politicides plummetedfollowing the end of the Cold War—a trend similarto that of high-intensity civil conflicts.1986199119962001a timely annual basis. MIPT has international terrorism datagoing back to 1968, and domestic terrorism data from 1998. 29MIPT counts many of the same events as UCDP’s onesidedviolence dataset and PITF’s genocide/politicide dataset.But unlike UCDP and PITF it does not count the killing ofcivilians by governments.As Figure 2.6 indicates, MIPT’s trend data reveal a fourfoldincrease in international terrorist incidents from 1968 to1991, followed by an almost fourfold decline by the end ofthe 1990s.Until the beginning of the new millennium, the internationalterrorism data followed a trend line remarkably similarto those of state-based armed conflicts and genocides/politicides—i.e.,a steady increase through the Cold War years followedby a sharp decrease in the 1990s. But over the past fiveyears there has been a dramatic change.Starting in 2001 the downward trend in international terroristincidents was reversed, and by 2004 there was almostfour times as many incidents as in 2001. The global incidenceof domestic terrorism also increased dramatically over the sameperiod. (MIPT only has data on domestic terrorism from 1998.)Figure 2.6 Number of InternationalTerrorist Incidents, 1968-200545040035030025020015010050So it is perfectly possible for mass campaigns against civiliansto decrease, while low-level campaigns increase. As notedearlier, however, there has as yet been no compelling explanationas to why the number of low-level campaigns should haverisen when other forms of political violence were falling.TerrorismTerrorism statistics provide a third measure of deadly threatsto the innocent, but here too obtaining access to reliable andtimely data is challenging.The Memorial Institute for the Prevention of Terrorism(MIPT), which codes and collates terrorism incident data providedby the RAND Corporation, is now the only institutionthat publishes updated international terrorism statistics on019681973197819831988199319982003Data source: MIPT Terrorism Knowledge Base 30The number of international terrorist attacks rosethrough the Cold War years, declined steeply inthe 1990s, but has risen steeply again in the newmillennium.But when the international terrorist incident data are disaggregatedon a regional basis it becomes clear that just tworegions are driving almost all of the post-2000 increase.Figure 2.7 shows the huge reported increase in internationalterrorism incidents in the Middle East and Persian Gulfand in South Asia. Most of the increased terrorist activity hasH U M A N S E C U R I T Y B R I E F 2 0 0 6 15
taken place in the former region where, since 2003, it has beendriven primarily by the violence in Iraq.When terrorist incidents in the Middle East and PersianGulf and in South Asia are removed from the global trenddata, it becomes apparent that the decline in internationalterrorist incidents in the rest of the world that started in 1991has continued to the present day.Figure 2.7 Number of International Terrorist Incidentsin South Asia and the Middle East and Persian Gulf4504003503002502001501005001968197319781983Data source: MIPT Terrorism Knowledge BaseInternational terrorism in the Middle East andPersian Gulf and, to a lesser degree, in South Asia,is responsible for almost all of the increase in thenew millennium.This decline—from just under 300 incidents in 1991 to58 in 2005—has passed almost completely unnoticed by themedia and expert community alike.It is also worth noting that compared with armed conflict,terrorism has, on average, killed relatively few people over thepast 40 years.Terrorism has killed relatively fewpeople on average over the past40 years.MIPT’s data indicate that the global death toll from internationalterrorist attacks has averaged just 385 people a yearsince 1968, while civilian deaths from domestic terrorismhave averaged 2,546 a year since 1998. By contrast, the averageannual death toll from state-based armed conflict from1998 to 2005 was almost 60,000 according to the Lacina andGleditsch dataset. 311988199319982003It is important to note, however, that the ratio of terroristdeaths to battle deaths is changing. Over the past eight yearsthe global death toll from terrorism has been rising, while thatof warfare has been falling.Can We Trust the Data?Each dataset reviewed in this chapter relies, directly orindirectly, on media and other reports for its estimates ofdeaths from one-sided violence. But collecting data can bevery challenging.First, in war zones many deaths go unreported or unrecorded,often because reporters are physically denied access tothe killing zones, or are intimidated from publishing what theyknow. Some are even killed. Neither governments nor rebelgroups want the fact that they kill civilians given any publicity.Second, the greater the overall level of violence the lesslikely individual deaths are to be counted. In Iraq, for example,the level of killing is now so intense that the media tend onlyto report attacks that cause multiple deaths. Keeping an accuraterecord of the number of people killed in low-intensityconflicts is far less difficult.Third, in the many conflicts where insurgents and militiafighters do not wear uniforms, the task of distinguishing civilianfrom combatant bodies is often impossible. This has beena particularly acute problem in Iraq.Each dataset also has its own unique sources of potentialbias. UCDP’s stringent coding rules increase the risk ofundercounting because the perpetrators of one-sided violencemust be identified before the deaths of their victims can berecorded. In conflicts like that in Iraq, where there are a largenumber of militias and insurgent groups, few of whom admitresponsibility for any attacks, the task of identifying the perpetratorsis often impossible. 32MIPT’s dataset, like most other terrorism datasets, doesnot include civilians deliberately killed by their governments.Its data recording practice also appears to undercount civiliandeaths perpetrated by rebel groups in rural insurgencies,which according to its definition should be included. Forexample, although attacks on civilians perpetrated by theJanjaweed militia in Darfur would appear to fit with MIPT’sdefinition of terrorism, the dataset only records 72 terrorismdeaths in all of Sudan from 2002 to the present day. 33 This isdespite the fact that the Janjaweed are widely believed to havekilled thousands of civilians since the latest fighting began.UCDP records a “best estimate” of 7,173 deaths from onesidedviolence in Darfur from the beginning of 2002 to theend of 2005. 3416H U M A N S E C U R I T Y B R I E F 2 0 0 6
The PITF genocide/politicide dataset differs fromboth UCDP and MIPT in that it clearly includes somenonviolent civilian deaths from war-exacerbated disease andmalnutrition in its genocide death counts. 35 For example,the genocide toll in Darfur from 2003 to 2005 is estimatedat 250,000. Since no studies have claimed that violent deathsamount to even half that number over the period in question,it must be assumed that a considerable proportion of theestimated 250,000 deaths are from war-exacerbated diseaseand malnutrition.So we have three datasets, each of which measures deathsfrom one-sided violence, but whose estimates for the civiliandeath toll in Darfur over comparable periods range from 72 to7,173 to 250,000.Because each dataset estimates civilian death tolls differently,the absolute number of deaths and trends they describeare also very different. None offers a complete picture, buteach provides different insights into one of the most pressinghuman security problems of our age.The Need for Better StatisticsThis chapter has stressed our concerns about the reliabilityof data on civilian deaths. This remains a critical issue for allresearchers working in this field. It is also a critical issue forpolicy-makers.It is both extraordinary and troubling that when theSecretary-General of the United Nations reports to theSecurity Council on “The Protection of Civilians in ArmedConflict,” he has no access to reliable data that can informthe council whether deadly threats to civilians—the centralfocus of his report—are increasing or decreasing. 36The need for better data collection is obvious. Not one ofthe three datasets reviewed here can yet provide the sort ofanswers that the UN needs to determine whether or not itspolicies for the protection of civilians are having any impact.There are no simple solutions to many of the data problemsdiscussed in this chapter, but our knowledge could beimmeasurably improved by a modest increase in resources tothe few institutions that work in this field.H U M A N S E C U R I T Y B R I E F 2 0 0 6 17
Jacob Silberberg / Panos Pictures. LIBERIA.C H A P T E R 3How Wars EndDrawing on the findings of a new conflict terminations datasetfrom 1946 to 2005 compiled by the Uppsala Conflict DataProgram (UCDP) and funded by the Human Security Centre,the analysis that follows offers a comprehensive descriptionof how wars end in the modern era.The analysis reveals the dramatic impact that the endingof the Cold War had on the way wars terminate, and that farmore wars are now ending in negotiated settlements thanin military victories. It shows that the number of negotiatedsettlements doubled in the 1990s, but that their failure rateincreased dramatically as well. It also shows that while mostconflicts have been fought over control of territory, mostpeace settlements have been negotiated in conflicts foughtover who should control the government.The final section of the chapter examines some of thepolicy implications of these changes and considers the claimthat today’s conflicts are more intractable than those of thepast and are thus less likely to be resolved.War Termination TrendsThe war trends revealed in the 2005 Human Security Reportstood in stark contrast to the popular view of the 1990s as aperiod of escalating political violence around the world. Theconventional wisdom was partly correct. There was a startlingupturn in the number of new conflicts at the beginning of thedecade, with much of the violence being associated with thebreakup of the former Soviet Union and other instabilitiesassociated with the end of the Cold War.But the 1990s also witnessed an even greater number ofwars ending. The net effect of these changes was that by 2003there were 40% fewer conflicts than in the peak year of 1992.The number of high-intensity conflicts—i.e., those with 1,000or more battle-related deaths a year—declined by 80% overthe same period. 37During the Cold War years more wars started than endedeach decade—which drove the number of conflicts steadilyupwards for some 40 years. But over the past decade and a halfthe global conflict tally has been driven down again becausemore wars ended than started.Far more wars are now ending innegotiated settlements than inmilitary victories.Figure 3.1 shows the changes per decade in the averagenumber of conflict onsets and terminations each year sincethe end of World War II. The huge increase in the number ofconflicts both starting and ending during the 1990s, comparedto previous decades, is very evident.What the bar graph data for the 1990s do not reveal—because they simply show the averages for the decade—isthat more wars started than ended at the beginning of18H U M A N S E C U R I T Y B R I E F 2 0 0 6
14121086420Figure 3.1 Average Number of Armed ConflictOnsets and Terminations, per Year, 1950-2005the decade, but more ended than started during the restof the decade.OnsetsTerminations1950–59 1960–69 1970–79 1980–89 1990–99 2000–05Data source: UCDP/Human Security Centre DatasetThe end of the Cold War was associated withdramatic changes in the number of conflict episodesstarting and ending.Between 2000 and 2005 the average number of conflictsboth starting and ending each year declined sharply from theextraordinarily high rates of the 1990s. 38 More conflicts arenow ending than beginning, continuing the trend started inthe 1990s.In fact, in the first six years of the new millennium therehas been an average net decline of 1.5 conflicts each year. Ifthis rate were to continue for another 10 years, the numberof conflicts currently being fought around the world would behalved. As noted previously, however, there are many reasonswhy such a trend may not continue.Changes in war onset and termination rates have ratherobvious policy implications. A major increase in the onsetof new conflicts suggests that conflict prevention policiesare having little or no effect. A major increase in negotiatedsettlements, on the other hand, suggests that efforts bythe international community to mediate the end of wars maybe succeeding. 39Victories and Negotiated SettlementsSince the end of World War II, the manner in which wars endhas changed radically. Between 1816 and 1945 there wereextraordinarily few negotiated settlements and the overwhelmingmajority of wars were fought until one side orthe other achieved a military victory. 40 But over the past 60years mediated settlements have become far more common;the pursuit of victory much less so. By the 1990s, in a furtherradical shift, more wars were ending in negotiated settlementsthan in victories.UCDP’s new conflict termination dataset, which tracksthese changes, covers the period from 1946 to 2005. It differsfrom other termination datasets in two important ways—it isupdated annually, and it includes low-intensity conflicts inaddition to the high-intensity conflicts, which are the subjectof most other termination datasets. 41The dataset records conflict “episodes” 42 —periods of violentconflict that can be ended by military victory, or by negotiatedsettlement—a category that includes peace agreementsor ceasefires. 43 A third category, labelled “Other” in Figure 3.2,includes conflicts that end when death tolls fall below the 25battle-death-per-calendar-year threshold. 44UCDP’s data show that between 1946 and 2005, 372armed conflict episodes ended. Approximately one third ofthese terminations were military victories and just over aquarter were negotiated settlements (peace agreements andceasefires). Most of the rest either ground to a halt or simmeredalong at a very low level.Since the end of World War II, themanner in which wars end haschanged radically.But the pattern of terminations underwent major shiftsduring the period under review. The biggest changes camein the post-Cold War political turmoil of the 1990s. First, thedecade’s tally of 120 terminations (an average of 12 a year) wasmore than double the average of the previous four decades.Second, an unprecedented 35% of all conflicts ended in someform of negotiated settlement.During the Cold War decades victories had outnumberednegotiated settlements by more than two to one. But in the1990s the reverse was true—42 conflicts ended in negotiatedsettlements; just 23 in victories. Between 2000 and 2005 therewas a further change: there were four times as many negotiatedsettlements (17) as there were victories (4).This increase in negotiated settlements since the endof the Cold War has been associated with a major upsurgein international activism directed towards stopping armedconflicts.As the 2005 Human Security Report pointed out, theUN’s peacemaking efforts increased enormously between1990 and 1999, with similar increases in activity by regionalH U M A N S E C U R I T Y B R I E F 2 0 0 6 19
Figure 3.2 Number of State-based Armed Conflict Terminations, 1946-2005Victories Negotiated settlements* Other Total terminationsTotalNo.Numberrestartedin under%restartedin underTotalNo.Numberrestartedin under%restartedin underTotalNo.Numberrestartedin under%restartedin underTotalNo.Numberrestartedin under%restartedin underYears5 years 5 years5 years 5 years5 years 5 years5 years 5 years1946-49 13 1 7.7 3 0 0.0 7 0 0 23 1 4.31950-59 16 3 18.8 11 0 0.0 13 5 38.5 40 8 20.01960-69 22 2 9.1 11 3 27.3 17 3 17.6 50 8 16.01970-79 22 6 27.3 12 3 25.0 11 0 0 45 9 20.01980-89 20 4 20.0 8 1 12.5 26 15 57.7 54 20 37.01990-99 23 2 8.7 42 18 42.9 55 32 58.2 120 52 43.3Total1946-1999116 18 15.5 87 25 28.7 129 55 42.6 332 98 29.52000-2005** 4 1 25.0 17 2 11.8 19 10 52.6 40 13 32.5Total1946-2005120 104 148 372Data source: UCDP/Human Security Centre DatasetSince the end of the Cold War more conflicts have ended in negotiated settlement than in victory,reversing a 40–year trend. Conflicts that end in negotiated settlements are, however, far more likely torestart than those that end in victory.*Includes peace agreements, ceasefires with conflict-regulatory steps, and ceasefires without conflict-regulatory steps** The number of failed terminations for 2000 to 2005 is at this point unknown. If a conflict restarts within five years, the settlement is recorded as a failure.organizations, individual governments, and NGOs. 45 UN andregional organization peacekeeping missions (now usuallyreferred to as “peace operations”) also increased dramaticallythroughout the decade.Determining whether the increase in efforts to stop warscaused the decline in armed conflicts or were simply associatedwith them is not easy, but a growing body of quantitativeand case study evidence from the research communitydemonstrates that such initiatives can indeed improve theodds of attaining and sustaining peace agreements. 46 The nextHuman Security Report will offer a detailed critical analysis ofthe effectiveness of policies that seek to end wars and preventthem from restarting.Different Stakes, Different SettlementProvisionsWhether or not negotiated settlements succeed depends to aconsiderable degree on the stakes over which the conflict hasbeen fought and the provisions of the settlement agreement.A new UCDP study shows that some types of conflict appearmore difficult to resolve than others. 47UCDP divides armed conflicts into two broad categories:those fought over control of territory—very often secessioniststruggles—and those fought over which party should controla government.A majority of conflicts during the post-Cold War era werefought over control of territory. However, most peace agreementsduring that time (70%) were associated with conflictsfought over who should control a government.Successful negotiation depends in part on the politicalprovisions of agreements. The provisions associated with thesuccessful settlement of territorial conflicts turn out to be quitedifferent from the provisions of settlements that successfullyend conflicts fought over control of the state.When negotiating agreements to end territorial conflictsafter 1989, governments were often willing to agree to provisionsfor greater autonomy, regional government, culturalfreedoms, and regional development. But while provisions forreferenda on the future status of the disputed territory werenot uncommon in these agreements, there has not been asingle case in the post-Cold War period of a government permittinga separatist movement to secede.20H U M A N S E C U R I T Y B R I E F 2 0 0 6
Peace agreements that follow wars over control of a governmenthave very different settlement terms. The UCDPstudy found that there was a provision for elections in 48%of the settlements under review, and in a substantial minorityof cases there were also provisions for creating an interimgovernment, for integrating rebels into the government and/or civil service, and for establishing the right to create politicalparties. 48 While some researchers have stressed the importanceof power-sharing pacts for the successful implementation ofpeace agreements, UCDP found that only 15% of agreementsending conflicts over government control had a provision forpower-sharing.Negotiated settlements are threetimes more likely to fail than victories.The military provisions of peace settlements that seekto end intrastate conflicts were fairly consistent regardlessof whether the fighting was about territory or the control ofgovernment. There were provisions for ceasefires in 60% ofsettlements, disarmament in 44%, integration of rebel forcesinto the national army in 38%, amnesties in 28%, and peacekeepingmissions in 23%.Further research in this area could help determine whichsorts of political and military settlement provisions have beenmost effective in helping implement settlements of differenttypes of conflict. Such findings would be of considerable utilityto the policy community and could help reduce the highfailure rate that has characterized peace settlements since theend of the Cold War.The Downside of Negotiated SettlementsThe big increase in negotiated settlements over the pastdecade and a half suggests that the international community’sgreatly increased efforts to bring wars to an end in this periodhave had a positive effect. But the data also suggest that negotiatedsettlements have two significant downsides comparedto the victories they appear to be replacing.First, wars that end in negotiated settlements last almostthree times longer on average than those that are ended bymilitary victory.Second, negotiated settlements are three times moreprone to failure than are victories.The fact that victories are more stable than negotiatedsettlements is not surprising. When wars end with the militarydefeat of one of the parties, the loser has no capacity tostart fighting again, while the victor has no interest in doingso. But in negotiated settlements, where neither side has beendefeated, the warring parties often retain substantial militarycapabilities well after peace agreements have been signed.Committing to peace in environments characterized by hostilityand lack of trust is extraordinarily difficult. Seeking amore advantageous outcome by returning to war remains anoption—and one that is often pursued.The fact that negotiated settlements are associated withlonger wars and a greater risk of reoccurrence than are victoriesmight suggest that seeking decisive outcomes on the battlefieldwould be preferable to pursuing negotiated peace agreements.But as the short essay “Give War a Chance?” argues, this optionis neither practical nor desirable (see next page).In the 1990s negotiated settlements became much moreunstable. 49 During the decade, 43% of all conflicts that endedin negotiated settlements started again within five years, comparedwith just 9% of conflicts that ended in victories. 50 (Fiveyears without a restart is the standard measure of success fora negotiated settlement.) The average failure rate for peacesettlements in the Cold War years had been just 13%.Many of the negotiated settlements signed in the decadefollowing the end of the Cold War appear to have been inappropriatelydesigned, ineptly implemented, and poorly supported—hencetheir high failure rate. But the sheer number ofnew settlements more than offset the effect of their increasedfailure rate.In the 1990s, 24 of the 42 negotiated settlements succeeded—i.e.,fighting did not restart within five years. Thismeant that—despite the large number of failures—the 24successful settlements during this decade were more thantwice the average of each decade in the Cold War years.The average failure rate for peacesettlements in the Cold War yearswas just 13%.The category of conflict terminations that has the highestprobability of failure are, unsurprisingly, those that end inneither a victory nor a peace agreement, but where the fightingsimply dies down completely or falls below the 25 battledeath-a-yearthreshold. This form of termination lacks boththe military advantages of victory and the political guaranteesthat often accompany negotiated settlements.H U M A N S E C U R I T Y B R I E F 2 0 0 6 21
GIVE WAR A CHANCE?In July 1999 Foreign Affairs published a provocative article by Edward Luttwak entitled, “Give Wara Chance.” It made the case that more lives would be saved in the long term if the internationalcommunity stopped trying to mediate settlements of violent conflicts, but instead allowed them to“burn themselves out.” 51Well-meaning efforts by the UN and NGOs to negotiatepremature ceasefires and peace settlements, Luttwakargued, simply prolong the violence. They provide respitesthat allow the belligerents to reconstitute their forces, rearm,and fight on, thus delaying the decisive victory that isthe one sure way to end the slaughter.The findings of UCDP’s new conflict terminations datasetwould appear to provide strong support for Luttwak’sthesis. Armed conflict episodes that end in negotiated settlementslast almost three times longer on average than thosethat end in victories. And they are nearly twice as likely torelapse into violence within five years. 52So if wars that end in victories are far shorter and lesslikely to restart than those that end in negotiated settlements,should not the international community heed ProfessorLuttwak’s advice and “give war a chance”?The short answer is no.While superficially plausible, Luttwak’s thesis is basedon a number of false assumptions. The first is that if no outsideefforts are made to mediate conflicts, they will swiftlyburn themselves out. But, as Chester Crocker has pointedout, there are many examples of conflicts that have not beensubject to external mediation that have nevertheless persistedfor decades. 53Luttwak concedes that this is true, but argues that this isbecause in civil wars it is often the case that neither side candefeat the other—a concession that fatally undermines hismain argument. 54 Desirable or not, victory is simply not anoption in many civil wars. When victory is impossible, negotiationsmay be the only way to end the killing. 55 Indeed,warring parties often turn to negotiations aided by externalmediators precisely because they are unable to prevailon the battlefield.Wars that cannot be stopped by victory, especiallythose where the parties are trapped in a “mutually hurtingstalemate,” can be—and often are—stopped by negotiatedpeace settlements. 56Second, consider Luttwak’s claim that external interventionsin civil wars—typically UN efforts to mediateceasefires and bring about peace settlements—simply prolongwars by giving the belligerents time to regroup, rearm,and thus continue fighting. His message is clear—mediationis dangerous.In fact, external mediation plays a crucial role in stoppingwars because it is so difficult for the warring parties ontheir own to commit to a negotiated settlement—particularlyin those wars that neither side perceives it can win atacceptable cost. Such situations are typically characterizedby a huge level of mutual distrust and fears that enemieswill exploit negotiated ceasefires for all the reasons thatProfessor Luttwak suggests.External intervention matters because third parties canprovide security guarantees that the warring parties on theirown obviously cannot. As Barbara Walter has pointed out ina major study of civil war settlements, external mediationdramatically increases the chances of bringing conflictssuccessfully to an end. In her study of 23 civil wars, she foundthat in the 12 cases where third-party security guaranteeswere offered, 11 of the signed agreements were implemented.In the 11 settlements where there were no third-partysecurity assurances, nine failed to be implemented. 57Third, Luttwak suggests that in stalemated wars, victorymay still be possible if external actors intervene to help tipthe military balance.External military and economic assistance can indeedhelp a warring party win victory more swiftly on occasion.But such cases appear to be the exception, not the rule. AsPatrick M. Regan and Aysegul Aydin point out in a recentstudy of the impact of external interventions on 153 armedconflicts, “the weight of the evidence suggests that outsidemilitary and economic interventions increase the durationand hostility levels and make the termination of civil conflictsless likely.” 58It is true that the findings of the new UCDP dataset onconflict terminations appear to support Professor Luttwak’sprovocative suggestion that pursuing victory on the battlefieldis preferable to seeking peace settlements. But, as this shortreview of the evidence suggests, the prescriptions of “GiveWar a Chance” would in practice most likely lead to longer,not shorter, armed conflicts—and to greater death tolls.22H U M A N S E C U R I T Y B R I E F 2 0 0 6
It is too early to make any definitive statements about thestability of the settlements signed since 2000—five years haveto elapse without a recurrence of fighting before a settlementcan be labelled a success. But early indications suggest thatnegotiated settlements may be becoming more stable.In the six years from the beginning of 2000 to the endof 2005 only two out of 17 negotiated settlements failed. Thenegotiated settlements for this period include 10 peace agreements—bythe end of 2005 not one of these had failed.Are Today’s Conflicts More Intractable?While the finding that the number of armed conflicts hasdeclined since the end of the Cold War is slowly becomingmore accepted, there remains considerable skepticism that thepositive trend of the past dozen years can continue.Some researchers believe that all the “low-hanging fruit”have now been gathered and the conflicts that remain will befar tougher to bring to an end. Fen Hampson, Chester Crocker,and Pamela Aall, for example, have argued that “The 21st centuryhas been left with fewer but more intractable conflicts.Many are stalemated as antagonists display an undiminishedappetite for continuing with their struggle in the hopes ofeventual military victory.” 59If today’s remaining conflicts are indeed more intractable,the implication is clear and sobering—we can expect fewerconflicts to end, and the decline in political violence the worldhas experienced since the end of the Cold War may have cometo an end.It is certainly true that a number of very long-lastingconflicts—those in Israel/Palestine, Colombia, Sri Lanka, andBurma, for example—still appear to be far from resolution.But in the last decade other major conflicts that once seemedhopelessly intractable have ended. These include the warsin East Timor, Acheh (Indonesia), Angola, Liberia, SierraLeone, and, most recently, Nepal. Still other conflicts, suchas that in Algeria, have seen a great reduction in the levelof violence or—like Burundi, northern Uganda, and possiblyeven Chechnya—appear to be moving towards some sortof termination.Moreover, UCDP’s new terminations dataset provides littlestatistical evidence to support claims that wars are becomingintractable. Of the 31 conflicts being waged in 2005, only29% had been underway for 10 or more years and really meritedthe label “intractable.” A further 29% had been ongoingfor less than a year, while 42% had lasted one to 10 years.The fact that 71% of today’s ongoing conflicts have lastedless than 10 years suggests that “intractability” is not a majorbarrier to further progress.There is no reason to expect thenumber of conflicts to continueto trend downwards.There is, of course, no reason to expect the number ofconflicts to continue to trend downwards—the future holdstoo many unknowables for any prediction to be made withconfidence. But there is nothing in the data that providesgrounds for pessimism either.H U M A N S E C U R I T Y B R I E F 2 0 0 6 23
Mikkel Ostergaard / Panos Pictures. DEMOCRATIC REPUBLIC OF THE CONGO.The Next Human Security ReportIn addition to updating the major conflict datasets, the nextHuman Security Report will focus on two thematic issues: “TheHidden Costs of War” and “The Causes of Peace.”The Hidden Costs of WarWhile the number of armed conflicts and mass slaughters ofcivilians around the world has declined quite remarkably overthe past 15 years, warfare still exacts a terrible—and largelyunrecognized—toll.In many of the world’s conflict zones, 10 or more peoplesuccumb to war-exacerbated disease and malnutrition forevery combat death. In extreme cases the ratio can be evenhigher. The International Rescue Committee, for example,estimates that for every violent death in the DemocraticRepublic of the Congo, there are currently some 50 “indirect”or “excess” deaths. 60Indirect deaths are rarely the subject of much politicalattention and are often only evident in changes in mortalitystatistics for diseases that are already major killers in poorcountries. Such shifts can only be determined by epidemiologicalsurveys—which are too rarely undertaken. As a consequence,indirect deaths remain mostly unseen, uncounted,and unnoticed.The reality is that despite some improvements in data collectionand a huge expansion of humanitarian activity sincethe end of the Cold War, we still know extraordinarily littleabout the true extent of the human costs of war. We know thatthe indirect death toll is driven by a number of factors—theintensity and scope of the conflict, the numbers of peopledisplaced, the health of the population, and access to basichealth services. We also know that humanitarian assistancecan achieve dramatic and timely reductions in indirect deathsat a remarkably low cost.The provision of humanitarian services—food, sanitation,shelter, and health services—can reduce mortality rates fromwar-exacerbated disease and malnutrition to pre-war levels orbetter within four to six months.Indirect deaths are rarely the subjectof much political attention.The critical intervening variable that impacts indirectdeath rates is the extent and effectiveness of humanitarianinterventions. Drawing on the wealth of extant research, plusnew data, the Report will analyse the multitude of (mostlypolitical) factors that determine the effectiveness of humanitarianaction today.The aim is to produce the most comprehensive overview,thus far published, of the hidden human costs of war. Wewill review what is known about the extent of indirect deathsworldwide and the major diseases that cause them; we willanalyse the drivers of those diseases and examine some of24H U M A N S E C U R I T Y B R I E F 2 0 0 6
the key dilemmas and constraints that confront humanitarianand local actors as they seek to help reduce conflictinducedsuffering.The Causes of PeaceThe “Causes of Peace” section will offer a more in-depth analysisof the arguments made briefly in Part V of the 2005 HumanSecurity Report. It will provide an accessible account of what isknown about the drivers of peace in today’s most numerousand deadly conflicts—civil wars in poor countries.This section will critically review key findings aboutthe causes of peace from the conflict research literature,commissioning new research where necessary. It will compareexplanations that stress structural factors (“root causes”) andevents data with those that focus on policies that seek toreduce the risk and incidence of war. The latter include whatthe UN calls “peacemaking” and “peacebuilding,” but alsopolicies that seek to stop existing wars and deter new ones bycoercive means.It will also include detailed analyses of the many innovativesecurity initiatives that have become standard security practicesince the early 1990s—from the proliferation of “Friends”groups to the entrenchment of disarmament, demobilization,and reintegration programs in peace operations.Explanations for declining political violence that stressthe importance of security policies stand in sharp contrast tothe academic research that sees the drivers of peace as theinverse of the causes of war. In the latter case researchers usemultiple regression analysis to determine whether, and towhat extent, “structural” factors—such as income per capita,“youth bulges,” trade openness, “horizontal inequality,” anddependence on primary commodities—affect the risk andincidence of armed conflict.The assumption that flows naturally from this work is thatthe drivers of peace are the antithesis of the drivers of war.There is in fact considerable evidence to support this assumption.For example, as incomes (and thus state capacity) riseand as economies diversify, state capacity increases, politicalinstability decreases, group inequalities are attenuated, andthe risk of civil war declines. Where the reverse is true, the riskof war increases. These sorts of structural changes helped drivethe decline in armed conflicts in East and Southeast Asia thatbegan in the 1970s as local economies boomed and democratizationspread across the region. This decline has continuedto the present day.However, as the 2005 Human Security Report argued, thedramatic worldwide downturn in political violence that hasoccurred since the early 1990s cannot be explained by changesin structural factors like income per capita or rates of economicgrowth. Structural change simply has not been significant orwidespread enough to explain the steepness of the decline inarmed conflicts.The case of sub-Saharan Africa is instructive here.Between 2003 and 2005 the number of low-income countriesunder stress had increased from 11 to 14. 61 Over the sameperiod the number of armed conflicts (including intercommunalconflicts) had declined by an extraordinary 37%—from 30to 19. Here the most compelling explanation for the declineappears to lie with the greatly expanded conflict prevention,peacemaking, and peacebuilding policies pursued by theinternational community during this period.Drawing on a range of recent empirical research, we willalso analyse the effectiveness of a range of coercive policiesthat have been employed by the international community inpursuit of security goals. These include sanctions, economicconditionality instruments, and military interventions. An initialreview of the literature suggests that, with some exceptions,the success rate of coercive approaches is very low.The section will contain an accessible guide to thestrengths and weaknesses of different approaches to explainingthe causes of peace—from macroquantitative econometricanalysis to case studies.Unpacking the reasons why wars come to an end—or insome countries never start—is a complex and often contestedtask. In addressing it, the next Report is responding to theincreasing insistence by donor governments, agencies, andmajor NGOs that humanitarian, peacebuilding, and conflictprevention policies be evidence-based.H U M A N S E C U R I T Y B R I E F 2 0 0 6 25
ENDNOTES1. The conflicts in question in these figures include previously uncounted wars being waged between non-state groups wherea government is not one of the warring parties. These are not counted in other conflict datasets.2. See UCDP/Human Security Centre dataset.3. Barbara Harff, “Assessing the Risks of Genocide and Politicide,” in Peace and Conflict, 2005, Monty G. Marshall and TedRobert Gurr, ed. (University of Maryland: Center for International Development and Conflict Management, 2005) 57-61.See http://www.cidcm.umd.edu/inscr/PC05print.pdf (accessed 14 December 2006).4. The number of refugees (displaced persons who have crossed an international boundary) declined 12.5%—from 9.6 millionin 2003 to 8.4 million in 2005. The number of internally displaced persons (IDPs) declined by 3.7% from 24.6 million to 23.7million. See the United Nations High Commissioner for Refugees website (http://www.unhcr.ch/, accessed 15 December2006) and the website of the Internal Displacement Monitoring Centre (http://www.internal-displacement.org, accessed 15December 2006).5. Data provided by the Heidelberg Institute for International Conflict Research, University of Heidelberg, Heidelberg, 2005.6. Note that Sudan is counted as part of the Middle East and north Africa region and therefore does not figure in the sub-Saharan African total.7. Deaths from the genocide in Rwanda, which did not involve fighting but rather the slaughter of unarmed civilians, are notcounted in most conflict battle-death datasets. They are, however, counted in UCDP’s recently created “one-sided violence”dataset that is reviewed in Chapter 2. While there have been a number of reports suggesting that the war death toll inDarfur is well in excess of 100,000, most of these deaths are attributable to war-exacerbated disease and malnutrition, andare not directly caused by violence.8. First, governments and non-state armed groups rarely claim responsibility for killing civilians, and UCDP’s coding rulespreclude it from recording deaths committed by unknown perpetrators. In Iraq thousands of civilian deaths have likelygone unrecorded by UCDP for this reason. Second, when members of non-state armed groups do not wear uniforms it isoften impossible to distinguish between civilians and combatants. Insurgent deaths may be counted as civilian deaths as aconsequence.9. Edward Luttwak, “Give War a Chance,” Foreign Affairs, 78, no.4 (July/August 1999): 36-44.10. UCDP, Uppsala University; Centre for the Study of Civil War, International Peace Research Institute, Oslo; Bethany Lacinaand Nils Petter Gleditsch, “Monitoring Trends in Global Combat: A New Dataset of Battle Deaths,” European Journal ofPopulation 21, no. 2-3 (June 2005): 145-166.11. A list of all 31 conflicts, including the names of the warring parties, is available on the Human Security Brief 2006 websiteat http://www.humansecuritybrief.info. New conflicts involve two parties that have not previously fought each other andwhich result in at least 25 battle deaths in a calendar year. Restarted conflicts are those where, after a period of at least oneyear of inactivity (i.e., fewer than 25 battle deaths), renewed fighting between two parties that have previously fought eachother again results in at least 25 battle deaths in a calendar year. Ongoing conflicts are those where fighting between twoparties, which were in conflict in the preceding year, results in at least 25 battle deaths in a calendar year.12. Ten state-based armed conflicts that were active in 2004 were not active in 2005: Georgia vs. the breakaway republic SouthOssetia; Uzbekistan vs. the Jihad Islamic Group; India vs. the National Democratic Front of Bodoland; India vs. separatistsin Tripura; Haiti vs. rebels; Ivory Coast vs. Forces Nouvelles; Angola vs. Front for the Liberation of the Enclave of Cabinda;Nigeria vs. Ahlul Sunnah Jamaa in northern Nigeria; Nigeria vs. Niger Delta People’s Volunteer Force; and Sudan vs. SudanPeople’s Liberation Movement/Army.13. The five wars recorded by UCDP in 2005 were as follows: Colombia: government vs. FARC-EP and ELN; Afghanistan:government and allied countries vs. Taliban; India (Kashmir): government vs. Kashmir insurgents; Nepal: government vs.Maoists; Iraq: government and allied countries vs. insurgents.26H U M A N S E C U R I T Y B R I E F 2 0 0 6
14. Note that fatality estimates are always subject to error. The UCDP/Human Security Centre dataset records “best,”“low,” and“high” estimates for each category of political violence each year. The “best estimate” is the figure that UCDP regards as beingmost credible, based on the most authoritative available information. Although only “best estimates” are published in theBrief, “low” and “high” estimates are available on the Human Security Brief website at http://www.humansecuritybrief.info.15. UCDP, Uppsala University; Centre for the Study of Civil War, International Peace Research Institute, Oslo.16. UCDP, Uppsala University; Human Security Centre, Liu Institute for Global Issues, University of British Columbia.17. The figures for the Middle East and north Africa considerably underestimate the death toll in this region. As noted elsewhere,UCDP’s stringent coding rules, together with the nature of the Iraq conflict with its unusually large number of activemilitia and insurgent groups, who rarely wear uniforms and who almost never take responsibility for the deaths thatthey cause, makes coding many of the violent deaths in that country simply impossible. For a discussion of the controversysurrounding efforts to assess the death toll in Iraq see Human Security Research, “In Focus: Conflict Related-Mortality,”November 2006, http://www.humansecuritycentre.org. The Middle East and north Africa region also includes Sudan andthus the conflict in Darfur. Most of the violent deaths in Darfur are the result of intentional attacks on unarmed civilians,not armed combat. UCDP codes these deaths as deaths from one-sided violence as opposed to battle deaths. One-sidedviolence is discussed at length elsewhere in this Brief.18. The conflict in Iraq poses particular problems in terms of the coding and counting of battle deaths. It should also be notedthat battle-death counts do not include the very large number of people who die from war-exacerbated disease and malnutrition.In poor countries these deaths can greatly exceed battle deaths. Currently “indirect death” tolls are only measuredin a handful of countries.19. See the UCDP codebook at http://www.pcr.uu.se/research/UCDP/our_data1.htm (accessed 14 December 2006).20. Bethany Lacina and Nils Petter Gleditsch, “Monitoring Trends in Global Combat: A New Dataset of Battle Deaths 2005,”European Journal of Population, 21, no. 2-3 (June 2005): 145-166.21. Examples of little-known non-state conflicts in 2005 include Izzi tribe vs. Ukele tribe (Nigeria) Garre subclan of Irir-Hawiyeclan vs. Murule clan (Somalia); LTTE vs. LTTE-Karuna faction (Sri Lanka); and Mara Salvatrucha vs. Mara 18 (Guatemala).22. Estimates of the numbers killed since the US-led invasion in 2003 vary wildly and are the subject of increasingly bitter contestation.UCDP and the much-cited NGO Iraq Body Count have war-death estimates in the tens of thousands, but a 2006population survey, whose findings were published in the UK journal, The Lancet, in October 2006, claimed that over 600,000people had been killed. The accuracy of the Lancet estimate remains the subject of intense—and unresolved—controversyamong Iraq experts, epidemiologists, and statisticians. But although the different counting methodologies create radicallydifferent death counts, the trends revealed in all the estimates are identical—each reveals a steady and significant increasein the rate of killing. Gilbert Burnham, Riyadh Lafta, Shannon Doocy, and Les Roberts, “Mortality After the 2003 Invasionof Iraq: a Cross-Sectional Cluster Sample Survey,” The Lancet (11 October 2006), http://www.thelancet.com/webfiles/images/journals/lancet/s0140673606694919.pdf (accessed 14 December 2006).23. See the UCDP codebook at http://www.pcr.uu.se/research/UCDP/our_data1.htm (accessed 14 December 2006).24. The overwhelming majority of campaigns against civilians in this period (1989 to 2005) took place in the context of intrastateconflicts.25. See Jean-Paul Azam and Anke Hoeffler, “Violence Against Civilians in Civil Wars: Looting or Terror,” Journal of Peace Research39, no. 4 (2002): 461-485; and Stathis N. Kalyvas, The Logic of Violence in Civil War (Cambridge: Cambridge University Press,2006).26. Sudan is included in UCDP’s Middle East and north Africa region.27. Harff, “Genocide and Politicide.”28. Harff, “Genocide and Politicide.”H U M A N S E C U R I T Y B R I E F 2 0 0 6 27
29. MIPT, Terrorism Knowledge Base, http://www.tkb.org/ChartModule.jsp (accessed 14 December 2006). All subsequent referencesto MIPT terrorism data are drawn from the Terrorism Knowledge Base.30. Ibid.31. UCDP, Uppsala University; Centre for the Study of Civil War, International Peace Research Institute, Oslo; Bethany Lacinaand Nils Petter Gleditsch, “Monitoring Trends in Global Combat: A New Dataset of Battle Deaths,” European Journal ofPopulation 21, no. 2-3 (June 2005): 145-166.32. The case of Iraq also clearly shows how different definitions and coding rules can lead to very different fatality estimates.For the years 2002 to 2005, UCDP’s researchers recorded just 768 one-sided violence deaths in Iraq that had been perpetratedby non-state armed groups. Without being able to identify the perpetrators, UCDP cannot code the deaths. Therewere 11,409 reported deaths in this period that went uncoded because the perpetrators were unknown. There is no doubtthat a sizeable number of these latter fatalities were civilians. MIPT does not have the same stringent coding rules as UCDP,so we would expect that its dataset would record more intentionally perpetrated civilian deaths. This is in fact the case. Forthe years 2002 to 2005, MIPT recorded 9,259 civilian deaths from domestic and international terror attacks in Iraq.33. See http://www.tkb.org/Glossary.jsp for MIPT’s definition of terrorism.34. UCDP records a “high estimate” of nearly 56,000 deaths for Darfur in this period—a figure that could not be confirmed.35. Knowingly forcing people into situations where they would die from disease and malnutrition is quite consistent withProfessor Harff’s definition of genocide/politicide.36. See Security Council, Report of the Secretary-General on the Protection of Civilians in Armed Conflict (New York: Security Council,United Nations, November 28, 2005), http://ochaonline.un.org/webpage.asp?Page_779 (accessed 14 December 2006).37. UCDP calls these high-intensity conflicts “wars.”38. Given the sharp reduction in the overall number of conflicts being fought in the new millennium compared with the 1990s,it is not surprising that there should be a commensurate decline in the numbers of conflicts starting and ending each yearas well. As a percentage of all conflicts, the number of conflicts starting and ending each year did not change very muchfrom the 1990s to the 2000 to 2005 period.39. It is possible that conflict prevention policies may be effective even when conflict numbers rise—i.e., it is possible thatthere would have been even more conflicts had there been no prevention policies. It is also possible, though unlikely, thatconflicts that ended in negotiated settlements would have ended absent external help. Barbara Walter’s Committing to Peace:The Successful Settlement of Civil Wars (Princeton: Princeton University Press, 2002), offers a compelling analysis of whyexternal mediation is so often a necessary condition for peace agreements to be successfully negotiated.40. Virginia Page Fortna, Peace Time: Cease-Fire Agreements and the Durability of Peace (Princeton: Princeton University Press,2004), 87.41. Low-intensity conflicts are those with 25 or more, but less than 1,000, battle deaths a year.42. Conflict episodes are not necessarily the same as conflicts. If a single conflict episode comes to an end and does not restart,it constitutes a conflict. But if a conflict episode stops then starts again, with the same actors and over the same basic issue,the entire period becomes a single conflict with two separate conflict episodes.43. For detailed descriptions of UCDP’s definitions, see UCDP, Armed Conflict Termination Dataset Codebook, http://www.pcr.uu.se/publications/UCDP_pub/UCDP%20Conflict%20Termination%20Dataset%20Codebook.pdf (accessed 14 December2006).44. Some 20 of the 372 terminations could not be coded in any of the major categories.28H U M A N S E C U R I T Y B R I E F 2 0 0 6
45. See Human Security Centre, Human Security Report 2005 (New York: Oxford University Press, 2005). The ending of quitea number of conflicts in this period had little or nothing to do with diplomatic interventions; some ended in victory, and alarger number petered out without any assistance from the outside at all.46. Walter, Committing to Peace; Virginia Page Fortna, “Does Peacekeeping Keep Peace? International Intervention and theDuration of Peace after Civil War,” International Studies Quarterly 48, no. 2 (June 2004): 269-292; Michael W. Doyle andNicholas Sambanis, Making War and Building Peace: United Nations Peace Operations (Princeton: Princeton UniversityPress, 2006); and Stephen John Stedman, Donald S. Rothchild, and Elizabeth M. Cousens, ed., Ending Civil Wars: TheImplementation of Peace Agreements (Boulder: Lynne Rienner, 2002).47. This section draws heavily on Lotta Harbom, Stina Högbladh, and Peter Wallensteen, “Armed Conflict and Peace Agreements,”Journal of Peace Research 43 (September 2006): 617-631.48. Ibid.49. UCDP’s category of “negotiated settlements” includes both peace agreements and ceasefires. In the 1990s, perhaps surprisingly,peace agreements—which are often preceded by ceasefires and which include de facto ceasefire provisions—had aslightly higher failure rate (45%) than ceasefires that were signed without a formal peace agreement (41%).50. Evaluating the impact of negotiated settlements is a highly complicated process. UCDP’s coding rules can both overestimateand underestimate the positive impact of peace settlements. In the fall of 2005 the Human Security Centre commissioneda review of the UCDP conflict terminations dataset from Stanford University’s Bethany Lacina. The review noted thatUCDP’s definition of a negotiated settlement did not count settlements unless they were signed in the year that thefighting stopped, or the calendar year that followed. So settlements that took two or more years to negotiate after thefighting stopped did not appear in the dataset. Recoding the data from 1989 to 2005 to include the missing settlements,Lacina found that the probability of negotiated settlements failing was actually 56%, not the 47% indicated by UCDP’scoding rules. But she also pointed out that UCDP’s strict definition of agreements meant that settlements that dramaticallyreduce overall levels of violence between the parties, but still incur 25 fatalities in any postsettlement year, will be countedas failures. For detailed descriptions of UCDP’s definitions, see UCDP, Armed Conflict Termination Dataset Codebook, http://www.pcr.uu.se/publications/UCDP_pub/UCDP%20Conflict%20Termination%20Dataset%20Codebook.pdf.51. Luttwak, “Give War a Chance,” 36-44.52. To be more precise, conflicts that end in victories have a 15.5% chance of reoccurring within five years; those that end innegotiations have a 28.7% of reoccurring within five years. Stanford University’s Bethany Lacina (background note commissionedby the Human Security Centre), using data from 1989 to 2005, has argued that negotiated settlements that failin the first year should also be included in UCDP’s conflict terminations dataset—UCDP excludes them. Using this moreexpansive definition of a peace agreement, over a five-year period fully 56% of negotiated settlements fail, compared withjust 15.5% of wars that end in victory.53. Chester Crocker, “A Poor Case for Quitting, ”Foreign Affairs 79, no. 1 (January/February 2000): 183-186.54. Edward Luttwak, “Stay Home,” Foreign Affairs 79, no. 2 (March/April 2000): 36-44.55. Some wars may simply peter out with neither a victory nor a peace agreement.56. For an explanation of the term “mutually hurting stalemate,” see William Zartman, Ripe for Resolution (New York: OxfordUniversity Press, 1989).57. Walter, Committing to Peace, 85.58. Patrick M. Regan and Aysegul Aydin, “Diplomacy and Other Forms of Intervention in Civil Wars,” Journal of Conflict Resolution50, no. 5 (October 2006): 736-756.H U M A N S E C U R I T Y B R I E F 2 0 0 6 29
59. Fen Osler Hampson, Chester A. Crocker, and Pamela Aall, “If the World’s Getting More Peaceful, Why Are We Still inDanger?” Globe and Mail, 20 October 2005, A25. The authors were responding to the findings of the 2005 Human SecurityReport. The claim that today’s wars are more intractable than those of earlier years is supported by the findings of a 2004study of the duration of 122 civil wars between 1945 and 1999 by James Fearon. Fearon found that the average length ofongoing wars had increased from some two years in 1946 to 15 years in 1999—suggesting that they were indeed becomingmore intractable. See James Fearon, “Why Do Some Civil Wars Last So Much Longer Than Others?” Journal of Peace Research41, no. 3 (2004): 275-301. Note that Professor Fearon’s dataset only covers civil wars, not the minor armed conflicts thatUCDP includes, and that it only extends to 1999, not 2005.60. “Excess” here refers to death rates that exceed the “normal” death rate prior to the outbreak of conflict. See InternationalRescue Committee, “The Lancet Publishes IRC Mortality Study from DR Congo; 3.9 Million Have Died: 38,000 Die perMonth,” 6 January 2006, http://www.theirc.org/news/page.jsp?itemID=27819067 (accessed 28 November 2006).61. This is based on data from the Independent Evaluation Group, Engaging With Fragile States: World Bank Support to Low-Income Countries Under Stress (Washington, DC: IBRD/WB, 2006).30H U M A N S E C U R I T Y B R I E F 2 0 0 6
WHAT IS HUMAN SECURITY?Human security is a relatively new concept, but one that is now widely used to describe the complexof interrelated threats associated with civil war, genocide, and the displacement of populations. Thedistinction between human security and national security is a basic but important one.While national security focuses on the defence ofthe state from external attack, human security is aboutprotecting individuals and communities from any form ofpolitical violence.Human security and national security should be—andoften are—mutually reinforcing. But secure states do notautomatically mean secure peoples. Protecting citizens fromforeign attack may be a necessary condition for the securityof individuals, but it is not a sufficient one. Indeed, duringthe last 100 years far more people have been killed by theirown governments than by foreign armies.All proponents of human security agree that itsprimary goal is the protection of individuals. But consensusbreaks down over what threats individuals should beprotected from. Proponents of the “narrow” concept ofhuman security, which underpins the Human Security Report,focus on violent threats to individuals, while recognizing thatthese threats are strongly associated with poverty, lack ofstate capacity and various forms of socio-economic andpolitical inequity.Proponents of the “broad” concept of human securityarticulated in the UN Development Programme’s 1994,Human Development Report, and the Commission on HumanSecurity’s 2003 report, Human Security Now, argue that thethreat agenda should be broadened to include hunger,disease, and natural disasters because these kill far morepeople than war, genocide, and terrorism combined.Although still subject to lively debate within theresearch community, the two approaches to human securityare complementary rather than contradictory.
ABOUT THE HUMAN SECURITY CENTREThe Human Security Centre, which is based at the Liu Institute for Global Issues at the University of BritishColumbia, was established in 2002 by the Honourable Lloyd Axworthy, former Canadian minister for foreignaffairs and then head of the Liu Institute. The centre’s director, Andrew Mack, joined in 2002 after a year atHarvard’s Program on Humanitarian Policy and Conflict Research and three years as director of the StrategicPlanning Unit in Kofi Annan’s Executive Office at the United Nations.The Human Security Centre’s mission is to make human security-related research more accessible topolicy and research communities, the media, educators, and the public. In pursuit of this mission, the centredraws on a network of collaborators in research institutions around the world, as well as pursuing its ownindependent research.The first issue of the Human Security Report, the Human Security Centre’s flagship publication, was publishedin October 2005 and received an extraordinary amount of attention from the media, policy-makers, and fromwithin the research community. (The Report can be accessed online at www.humansecurityreport.info.)The Human Security Report is complemented by the Human Security Gateway, an online database of humansecurity resources, and two online bulletins, Human Security Research and Human Security News.• Human Security Gateway (www.humansecuritygateway.info)The gateway is a rapidly expanding searchable online database of human security-related resources,including reports, journal articles, news items, and fact sheets. The gateway was developed incollaboration with the Canadian Consortium on Human Security.• Human Security Research (www.humansecuritycentre.org)Human Security Research is an online monthly compilation of new human security-related researchpublished by university research institutes, think-tanks, governments, IGOs, and NGOs.• Human Security News (www.humansecuritycentre.org)Human Security News Daily is an online daily round-up of the latest human security-related newsstories from around the world.Human Security News Weekly highlights 10 of the most significant news stories of the week.All of these e-resources are available free of charge.The centre is funded by the governments of Canada, Norway, Sweden, Switzerland, and theUnited Kingdom.LIU INSTITUTE FOR GLOBAL ISSUES,THE UNIVERSITY OF BRITISH COLUMBIALIU INSTITUTE FOR GLOBAL ISSUES,THE UNIVERSITY OF BRITISH COLUMBIA6476 NW Marine DriveVancouver BC Canada V6T 1Z2www.humansecurityreport.info6476 NW Marine DriveVancouver BC Canada V6T 1Z2www.humansecuritybrief.info