Sampling and Reconstruction of Analog Signals
Sampling and Reconstruction of Analog Signals
Sampling and Reconstruction of Analog Signals

Create successful ePaper yourself
Turn your PDF publications into a flip-book with our unique Google optimized e-Paper software.
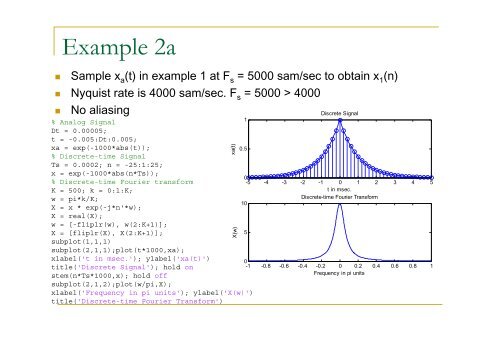
Example 2a<br />
• Sample x a (t) in example 1 at F s = 5000 sam/sec to obtain x 1 (n)<br />
• Nyquist rate is 4000 sam/sec. F s = 5000 > 4000<br />
• No aliasing<br />
% <strong>Analog</strong> Signal<br />
Dt = 0.00005;<br />
t = -0.005:Dt:0.005;<br />
xa = exp(-1000*abs(t));<br />
% Discrete-time Signal<br />
Ts = 0.0002; n = -25:1:25;<br />
x = exp(-1000*abs(n*Ts));<br />
% Discrete-time Fourier transform<br />
K = 500; k = 0:1:K;<br />
w = pi*k/K;<br />
X = x * exp(-j*n'*w);<br />
X = real(X);<br />
w = [-fliplr(w), w(2:K+1)];<br />
X = [fliplr(X), X(2:K+1)];<br />
subplot(1,1,1)<br />
subplot(2,1,1);plot(t*1000,xa);<br />
xlabel('t in msec.'); ylabel('xa(t)')<br />
title('Discrete Signal'); hold on<br />
stem(n*Ts*1000,x); hold <strong>of</strong>f<br />
subplot(2,1,2);plot(w/pi,X);<br />
xlabel('Frequency in pi units'); ylabel('X(w)')<br />
title('Discrete-time Fourier Transform')<br />
xa(t)<br />
X(w)<br />
1<br />
0.5<br />
Discrete Signal<br />
0<br />
-5 -4 -3 -2 -1 0 1 2 3 4 5<br />
t in msec.<br />
Discrete-time Fourier Transform<br />
10<br />
5<br />
0<br />
-1 -0.8 -0.6 -0.4 -0.2 0 0.2 0.4 0.6 0.8 1<br />
Frequency in pi units