Is My Tap Water Safe to Drink?
Is My Tap Water Safe to Drink? - Riverkeeper
Is My Tap Water Safe to Drink? - Riverkeeper
- No tags were found...

You also want an ePaper? Increase the reach of your titles
YUMPU automatically turns print PDFs into web optimized ePapers that Google loves.
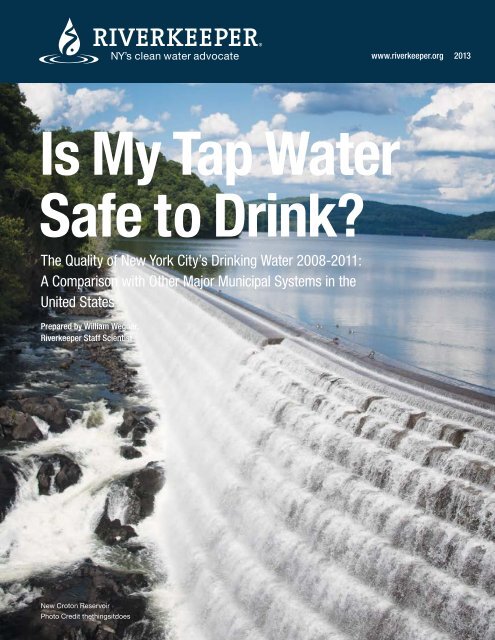
www.riverkeeper.org 2013<br />
<strong>Is</strong> <strong>My</strong> <strong>Tap</strong> <strong>Water</strong><br />
<strong>Safe</strong> <strong>to</strong> <strong>Drink</strong>?<br />
The Quality of New York City’s <strong>Drink</strong>ing <strong>Water</strong> 2008-2011:<br />
A Comparison with Other Major Municipal Systems in the<br />
United States<br />
Prepared by William Wegner,<br />
Riverkeeper Staff Scientist<br />
New Cro<strong>to</strong>n Reservoir<br />
Pho<strong>to</strong> Credit thethingsitdoes<br />
1
Table of Contents<br />
Executive Summary................................................................................................................................3<br />
<strong>Is</strong> <strong>My</strong> <strong>Tap</strong> <strong>Water</strong> <strong>Safe</strong> <strong>to</strong> <strong>Drink</strong>?.........................................................................................................5<br />
Where Does New York City’s <strong>Tap</strong> <strong>Water</strong> Come From?........................................................6<br />
How Does New York City Provide <strong>Safe</strong> <strong>Drink</strong>ing <strong>Water</strong>?....................................................6<br />
Riverkeeper’s <strong>Drink</strong>ing <strong>Water</strong> Quality Survey:<br />
Methods Used ..........................................................................................................................................8<br />
What Contaminants Do Cities Test For?......................................................................................8<br />
How Does New York’s <strong>Drink</strong>ing <strong>Water</strong> Compare<br />
<strong>to</strong> Other Large Cities? ........................................................................................................................10<br />
Present and Future Risks <strong>to</strong> New York City’s<br />
<strong>Drink</strong>ing <strong>Water</strong> Supply.........................................................................................................................16<br />
Conclusions and Recommendations...........................................................................................17<br />
Appendix A<br />
Statutes, Regulations, Agency Acronyms,<br />
Studies Referenced, and Glossary...........................................................................................19<br />
Appendix B<br />
<strong>Drink</strong>ing <strong>Water</strong> Quality Data........................................................................................................ 20<br />
2
Executive Summary<br />
Residents of New York City (NYC or the City) and the Hudson Valley who depend on the City’s drinking water supply<br />
want <strong>to</strong> know whether their tap water is safe <strong>to</strong> drink. Riverkeeper’s <strong>Water</strong>shed Team has undertaken a multi-year<br />
study, in terms of both present and future water quality, in order <strong>to</strong> answer that question.<br />
Study Approach<br />
The <strong>Safe</strong> <strong>Drink</strong>ing <strong>Water</strong> Act requires all opera<strong>to</strong>rs of municipal drinking water supplies <strong>to</strong> inven<strong>to</strong>ry contaminants<br />
and report the results <strong>to</strong> the public annually. Using data provided in these annual reports from 2008 through 2011,<br />
Riverkeeper examined and compared the drinking water quality of the ten largest U.S. cities, including New York, the<br />
largest by population and the only city among the ten largest that has an unfiltered drinking water supply. The City’s<br />
drinking water quality was also compared <strong>to</strong> that of four other large cities with unfiltered water supplies.<br />
Report Findings<br />
Whether drinking water is consumed from the tap or from bottles, some impurities are always present. The key<br />
question is: do these impurities pose health risks—are they present in concentrations that exceed state and federal<br />
safety standards? Riverkeeper’s survey revealed that, between 2008 and 2011, New York City’s drinking water met<br />
state and federal water quality standards in most areas, but exceeded limits for lead at the tap and turbidity in source<br />
waters. Key findings of the study:<br />
1. New York City’s testing program is robust and comprehensive. In all four years reviewed, the City tested drinking<br />
water for more contaminants than any of the ten largest U.S. cities surveyed (an average of 266 over the study<br />
period), with the exception of San Francisco in 2008 (249 vs. 231 for New York).<br />
2. With the exception of lead in New York and Bos<strong>to</strong>n, which is caused by lead-soldered plumbing in older buildings,<br />
all cities reviewed had very few exceedances, indicating that overall drinking water quality in the cities surveyed is<br />
very high. New York City’s lead exceedances represented 7.5% of the households tested in 2008. The same data<br />
were not reported as a percentage for 2009 or 2010, but were reported numerically in 2010 (with 30 lead exceedances<br />
<strong>to</strong>tal). Beginning in November of 2010, the New York City Department of Environmental Protection (NYC<br />
DEP), the agency responsible for maintaining the drinking water supply, implemented a public awareness program<br />
<strong>to</strong> educate consumers about lead in drinking water and began replacing all City-owned lead service lines. In 2011,<br />
there were 20 reported lead exceedances. On average over the four-year study period, New York reported the<br />
highest number of lead exceedances—14.8 per year—with Bos<strong>to</strong>n reporting 11.5 and the remaining surveyed cities<br />
ranging lower: 0.0 (San Jose, Chicago, San Francisco) <strong>to</strong> 4.7 (Philadelphia).<br />
3. New York City reported detection of waterborne pathogens in approximately 80% of the water samples tested.<br />
Two pathogens of concern <strong>to</strong> human health are the microscopic pro<strong>to</strong>zoa Giardia and Cryp<strong>to</strong>sporidium. The<br />
number of positive Giardia samples detected ranged from 111 in 2008 <strong>to</strong> 40 in 2011; positive Cryp<strong>to</strong>sporidium<br />
samples detected ranged from 9 in 2010 <strong>to</strong> 84 in 2011. The City’s testing methods do not allow it <strong>to</strong> determine<br />
whether detected organisms were alive or capable of causing disease. However, DEP follow-up studies showed<br />
that the Cryp<strong>to</strong>sporidium found were from wildlife sources and that most were not infectious <strong>to</strong> humans. Although<br />
the City concluded that low numbers of Giardia and Cryp<strong>to</strong>sporidium required no action on the part of the<br />
NYCDEP, it elected <strong>to</strong> construct the Cat/Del UV disinfection facility, which came on line in December 2012,<br />
<strong>to</strong> address these and other pathogens. Although no waterborne disease outbreaks were attributed <strong>to</strong> these<br />
pathogens, the presence of any potentially disease-causing organisms in drinking water supplies is of concern.<br />
All cities surveyed reported detecting waterborne pathogens, but only a few exceeded health standards: one each<br />
for San Francisco and Bos<strong>to</strong>n and two each for Los Angeles and Philadelphia during the four-year study.<br />
4. Turbidity in drinking water supplies can mask the presence of pathogens and inhibit chlorine disinfection.<br />
Because of this, there are both federal and state standards for turbidity in drinking water supplies. The federal<br />
<strong>Safe</strong> <strong>Drink</strong>ing <strong>Water</strong> Act and NYS Department of Health (NYSDOH) regulations limit turbidity in public drinking<br />
water distribution systems <strong>to</strong> 5 nephelometric turbidity units (NTU) in the terminal reservoirs that directly feed the<br />
drinking water distribution system. Turbidity levels in upstream reservoirs that feed the terminal reservoir in the<br />
Cat/Del system (the Kensico) exceeded this standard on a number of occasions during the years surveyed,<br />
3
causing DEP <strong>to</strong> minimize flow from the Catskill Aqueduct <strong>to</strong> the Kensico. If source water turbidity is not adequately<br />
mitigated in the near future, s<strong>to</strong>rm-driven increases in reservoir turbidity could require filtration of New York City<br />
drinking water.<br />
5. Pharmaceuticals and personal care products (PPCPs) in water supplies are contaminants of emerging concern due<br />
<strong>to</strong> their possible impacts on human health and aquatic ecosystems. Virtually all PPCPs are contaminants for which<br />
no state or federal drinking water standards have been established. The adverse effects of some hormones and<br />
endocrine disrup<strong>to</strong>rs on aquatic organisms are well documented; however, the health effects of long-term exposure<br />
<strong>to</strong> these compounds on humans are unknown and require further study. Widespread testing for these contaminants<br />
in municipal drinking water has only recently been implemented in some cities. Of the 14 filtered and unfiltered cities<br />
surveyed, only Seattle, WA and Portland, OR reported testing drinking water for PPCPs in 2008. In 2009 and 2010,<br />
New York, Chicago, and Bos<strong>to</strong>n also began testing for these contaminants. In 2010, New York conducted a follow<br />
up <strong>to</strong> its 2009 pilot study, which confirmed that some PPCPs are present in the City’s surface water supplies,<br />
though only in trace concentrations. New York was the only one of the five that did not continue <strong>to</strong> test for PPCPs<br />
in 2011, because NYC and the NYSDOH concluded that such low concentrations in the City’s water supply did not<br />
present public health concerns.<br />
Conclusions<br />
In summary, except for the presence of lead as a result of some antiquated plumbing fixtures, New York City’s drinking<br />
water consistently meets federal and state regula<strong>to</strong>ry safety standards. The number of lead exceedances in New<br />
York declined from 30 in 2010 <strong>to</strong> 20 in 2011. The prevalence of lead-soldered plumbing fixtures in New York City’s<br />
older buildings, still poses a risk of lead exceedances in the future. In addition, although high turbidity in the distribution<br />
system has been in decline over the study period since 2009, turbidity in Catskill waters has increased during the<br />
same period. While we are encouraged that the quality of New York City’s drinking water reservoirs remains high,<br />
in order <strong>to</strong> maintain this precious, high-quality municipal resource, DEP must continue <strong>to</strong> address threats <strong>to</strong> water<br />
quality that could pose risks <strong>to</strong> the City’s water supply and its consumers now and in<strong>to</strong> the future. These threats<br />
include turbidity in the Catskill <strong>Water</strong>shed and the occurrence of pathogens and PPCPs in all source waters.<br />
Based on the report findings, Riverkeeper recommends that NYCDEP take the following actions <strong>to</strong> address<br />
these threats.<br />
Recommendations<br />
1. Resume its PPCP testing program <strong>to</strong> moni<strong>to</strong>r the presence of and changes in the concentrations of these<br />
compounds as other cities continue <strong>to</strong> do. In addition, we urge NYSDOH and the U.S. Environmental Protection<br />
Agency (EPA) <strong>to</strong> develop regula<strong>to</strong>ry standards for these contaminants in municipal drinking water supplies.<br />
2. Require retrofitting of lead-soldered plumbing in households reporting lead exceedances <strong>to</strong> reduce or eliminate<br />
exceedances of lead at the tap.<br />
3. In order <strong>to</strong> continue <strong>to</strong> manage the presence of waterborne pathogens in terminal and upstream reservoirs, DEP<br />
should identify the sources of those pathogens and maintain and if necessary, enhance source controls, such as<br />
the Whole Farm Program and the <strong>Water</strong>fowl Management Program, <strong>to</strong> address those causes.<br />
4. Implement sound turbidity control measures <strong>to</strong> protect New York City’s reservoirs, delivery system and consumers<br />
from inadequately detected and disinfected pathogens and, potentially, a filtration mandate that could result from<br />
increased turbidity associated with climate change and land use practices. These measures include but<br />
are not limited <strong>to</strong>: expanding DEP’s Stream Management Plan <strong>to</strong> remediate more impaired Catskill stream<br />
reaches; re-evaluating and implementing structural control practices such as a multi-level intake in the Schoharie<br />
Reservoir; and/or a clarification facility downstream of the Ashokan Reservoir.<br />
4
<strong>Is</strong> <strong>My</strong> <strong>Tap</strong> <strong>Water</strong> <strong>Safe</strong> <strong>to</strong> <strong>Drink</strong>?<br />
This question is often on the minds of the nine million New York City and Hudson Valley residents who rely<br />
on New York City’s reservoir system for the water that comes out of their taps every day. Based on the<br />
multi-year study undertaken by Riverkeeper’s <strong>Water</strong>shed Team, the answer is a “conditional” yes.<br />
The following discussion of the study undertaken and its findings expands on that answer and the reasons<br />
underlying it. This report:<br />
• Describes where New York City’s tap water comes from.<br />
• Explains New York City’s water protection measures and why they were established.<br />
• Analyzes the results of New York City’s drinking water quality reports from 2008-2011.<br />
• Compares New York City’s results <strong>to</strong> the drinking water quality of the 10 largest<br />
U.S. cities, all of which except New York have filtered drinking water supplies, and<br />
<strong>to</strong> four other large cities with unfiltered water supplies .<br />
• Discusses present and future risks <strong>to</strong> New York City’s drinking water supply.<br />
• Provides recommendations based on the findings highlighted.<br />
5
Where Does New York City’s <strong>Tap</strong> <strong>Water</strong> Come From?<br />
Three upstate New York City watersheds, the Catskill, Delaware and Cro<strong>to</strong>n <strong>Water</strong>sheds, supply nine million consumers<br />
with 1.2 billion gallons of high quality, unfiltered drinking water daily. The Catskill and Delaware <strong>Water</strong>sheds, which lie<br />
in the Catskill Mountains, supply 90% of that 1.2 billion gallons <strong>to</strong> New York City and more than 60 upstate municipalities.<br />
The New York City Department of Environmental Protection (NYCDEP) is the agency responsible for the<br />
operation of the City’s drinking water supply system. In order <strong>to</strong> avoid the high cost of filtering this water, NYCDEP<br />
has put in place watershed protection programs <strong>to</strong> ensure that the drinking water supplied by this system meets state<br />
and federal drinking water quality criteria. However, the Cro<strong>to</strong>n <strong>Water</strong>shed has been offline since 2009 and is under a<br />
filtration order from EPA due <strong>to</strong> the potential for exceedance of standards governing chemical byproducts produced<br />
during the disinfection process (see discussion on page 9). If a filtration plant were ever required for the Catskill/<br />
Delaware <strong>Water</strong>sheds, it would cost New York City and upstate water ratepayers over $10 billion in capital costs<br />
and half a billion dollars a year for operation and maintenance.<br />
How Does New York City Provide <strong>Safe</strong><br />
<strong>Drink</strong>ing <strong>Water</strong>?<br />
The federal <strong>Safe</strong> <strong>Drink</strong>ing <strong>Water</strong> Act’s Surface <strong>Water</strong> Treatment Rule requires municipal drinking water suppliers<br />
<strong>to</strong> filter drinking water from surface water supplies unless good water quality can be maintained and watershed<br />
protection programs are implemented <strong>to</strong> minimize contamination of the source water. In 1997, New York City, the<br />
EPA, watershed <strong>to</strong>wns, villages and counties, as well as environmental organizations (including Riverkeeper), forged<br />
the New York City <strong>Water</strong>shed Memorandum of Agreement (MOA), which established stringent regulations and watershed<br />
protection programs <strong>to</strong> protect the surface waters that provide unfiltered drinking water <strong>to</strong> the City and upstate<br />
consumers. The protection programs include land acquisition <strong>to</strong> protect buffer areas around streams and reservoirs,<br />
a strategy <strong>to</strong> reduce turbidity in the Catskill system, protective agricultural practices, and a stream management<br />
program <strong>to</strong> prevent the transport of sediment <strong>to</strong> reservoirs by res<strong>to</strong>ring eroded watershed stream channels. The MOA<br />
allowed New York City <strong>to</strong> receive a Filtration Avoidance Determination (FAD) from EPA, which in turn allowed the City<br />
<strong>to</strong> continue providing unfiltered drinking water <strong>to</strong> consumers and avoid the costs of constructing and operating a<br />
multi-billion-dollar filtration plant.<br />
With the MOA in place, EPA issued a five-year FAD in 1997. Based on NYCDEP’s December 2001 Long-Term <strong>Water</strong>shed<br />
Protection Program, EPA issued another five-year FAD in November 2002, which included significant enhancements<br />
<strong>to</strong> the overall watershed protection program. In addition, the 2002 FAD highlighted two major themes in the<br />
City’s program: a long-term commitment <strong>to</strong> watershed protection programs, and a reliance on watershed partners<br />
(such as the Catskill <strong>Water</strong>shed Corporation and the <strong>Water</strong>shed Agricultural Council) <strong>to</strong> enhance program acceptance<br />
and implementation.<br />
In accordance with the provisions of the 2002 FAD, the 2007 FAD development process was initiated by the City’s<br />
submittal of a report entitled “2006 <strong>Water</strong>shed Protection Program Summary and Assessment” in March 2006. In<br />
August 2006, EPA and NYSDOH completed an evaluation entitled Report on the City of New York’s Progress<br />
in Implementing the <strong>Water</strong>shed Protection Program, and Complying with the Filtration Avoidance Determination.<br />
This report found that the City had successfully satisfied the obligations specified in the 2002 FAD. Highlighted<br />
strengths included the land acquisition and small farm programs, while certain delays were noted in the wastewater<br />
and stream management programs. 1<br />
Based on this report and NYCDEP’s 2006 Long Term <strong>Water</strong>shed Program, in 2007, EPA approved a 10-year FAD<br />
for New York City’s Catskill/Delaware <strong>Water</strong> Supply, with a mid-term review scheduled <strong>to</strong> occur in 2012. That review<br />
is currently ongoing. New York is one of the few large cities that continue <strong>to</strong> receive a FAD as a result of their<br />
ability <strong>to</strong> meet state and federal drinking water standards with unfiltered water supplies.<br />
1<br />
USEPA, Filtration Avoidance, available at: http://www.epa.gov/region2/water/nycshed/filtad.htm.<br />
6
Figure 1:<br />
Map of Catskill/Delaware <strong>Water</strong>sheds<br />
The Catskill and Delaware <strong>Water</strong>sheds<br />
encompass 1,600 square miles of the<br />
Catskill Mountains west of the Hudson<br />
River. This system supplies unfiltered<br />
drinking water <strong>to</strong> nearly half of New York<br />
State’s population.<br />
Figure 2:<br />
Map of Cro<strong>to</strong>n <strong>Water</strong>shed<br />
East of the Hudson River, the 375-squaremile<br />
Cro<strong>to</strong>n <strong>Water</strong>shed typically supplies<br />
10% of the City’s daily water supply from<br />
sources in Westchester, Putnam and<br />
Dutchess Counties. The Cro<strong>to</strong>n system<br />
remains unfiltered and offline as of the<br />
release of this report, although a filtration<br />
plant for that system is currently under<br />
construction and scheduled <strong>to</strong> go on-line<br />
in August 2013.<br />
7
Riverkeeper’s <strong>Drink</strong>ing <strong>Water</strong> Quality Survey:<br />
Methods Used<br />
Riverkeeper compared the drinking water quality of the ten largest U.S. cities, in descending order of population<br />
size: (1) New York, (2) Los Angeles, (3) Chicago, (4) Hous<strong>to</strong>n, (5) Phoenix, (6) Philadelphia, (7) San An<strong>to</strong>nio, (8) Dallas,<br />
(9) San Diego, and (10) San Jose. Among these 10 cities, New York is the only city with an unfiltered drinking water<br />
supply. In addition, we compared the drinking water quality of New York with that of four other large cities that rely on<br />
unfiltered drinking water supplies: Bos<strong>to</strong>n, Seattle, San Francisco, and Portland, Oregon.<br />
To keep consumers informed about the quality of their drinking water, the <strong>Safe</strong> <strong>Drink</strong>ing <strong>Water</strong> Act requires all opera<strong>to</strong>rs<br />
of municipal drinking water supplies, including New York City, <strong>to</strong> report the results of their water testing <strong>to</strong> the public.<br />
The annual water quality reports for all surveyed cities are available on their respective websites, although posted<br />
annual reports may contain only partial data or only report the contaminants the municipality detected rather than all<br />
that were tested for. For example, Seattle’s 2008 website report lists only 11 detected contaminants, but noted that<br />
the city tested for “more than 179” others that were not detected. To enhance this data set, Riverkeeper directly<br />
contacted the drinking water utilities of all targeted cities <strong>to</strong> request comprehensive listings of each city’s water<br />
quality testing and results.<br />
Riverkeeper compiled data from the annual reports of the 14 selected municipalities from 2008 through 2011 and<br />
compared it <strong>to</strong> the six water quality categories that NYCDEP presents in its annual reports: conventional physical and<br />
chemical properties, organic contaminants, disinfection byproducts (DBPs), pathogens, radionuclides, and metals<br />
(which include lead and copper). We then analyzed these categories for each surveyed city <strong>to</strong> determine: (1) the number<br />
of contaminants tested for in each class; (2) the number detected in each class; and (3) the number that exceeded<br />
a state or federal standard in each class. In addition, we examined all available testing data related <strong>to</strong> pharmaceuticals<br />
and personal care products (PPCPs).<br />
For the most part, utilities were cooperative in providing more comprehensive water quality data than what was<br />
reported on their websites. Any gaps in our reported data result from the failure of certain cities we surveyed <strong>to</strong> report<br />
the data on their websites and <strong>to</strong> provide missing data <strong>to</strong> us when we requested. To compensate for data gaps, the<br />
following graphs represent the average numbers reported in each of the above three categories. The complete data<br />
set we compiled, including gaps, is presented in Appendix B <strong>to</strong> this report.<br />
What Contaminants Do Cities Test For?<br />
Pure water—meaning H2O—does not occur in nature. All natural surface and groundwater supplies contain dissolved<br />
minerals, many of which are essential <strong>to</strong> support plant and animal life. Even harmful impurities, such as arsenic<br />
and radioactive minerals, can be present in natural water supplies, depending on the geology of any given region.<br />
Across the United States, people are exposed on a daily basis <strong>to</strong> a wide array of contaminants in the food we eat, the<br />
air we breathe and the water we drink. Some of these contaminants are present in concentrations that pose human<br />
health hazards; others are present in trace amounts <strong>to</strong> which people can be exposed on a daily basis over their lifetime<br />
with no ill effects. Some contaminants that are present in municipal drinking water supplies are the unavoidable<br />
result of the natural geology underlying surface water supplies. For example, iron and other minerals, sodium, sulfur,<br />
and even radioactive minerals can leach from rocks and soils in<strong>to</strong> streams, reservoirs and groundwater aquifers.<br />
The presence of other contaminants in drinking water supply watersheds results from intensified land use such as<br />
urban development. Concentrations of organic carbon, pathogens, hydrocarbons, and nutrients such as phosphorus<br />
and nitrogen increase in water supplies as watershed lands become more heavily developed. Still other contaminants,<br />
known as disinfection byproducts (DBPs), are present as the result of the interaction of chlorine at drinking water<br />
treatment plants with organic carbon in the water being treated.<br />
8
Based on health effects studies of specific contaminants, EPA sets a maximum contaminant level (MCL) which<br />
is the estimated amount of the chemical that will not pose health risks <strong>to</strong> people exposed <strong>to</strong> it on a daily basis. For<br />
certain contaminants, NYSDOH also establishes MCLs that may be more stringent than EPA standards for the<br />
same contaminants.<br />
Municipal drinking water suppliers are required <strong>to</strong> test drinking water for the six specific water contaminant categories<br />
examined in this survey. These are the contaminants for which EPA and/or NYSDOH have established an MCL. Beyond<br />
what EPA and individual states require, water suppliers routinely test for a wide variety of unregulated physical,<br />
chemical and organic contaminants as a proactive approach <strong>to</strong> moni<strong>to</strong>ring drinking water supplies for potential health<br />
risks. State and federal water quality regulations allow various combinations of regulated contaminants <strong>to</strong> be present<br />
in municipal drinking water supplies, but only at trace levels that have not been associated with health risks. Only<br />
recently have some municipal water suppliers begun testing for a variety of unregulated PPCPs in drinking water. The<br />
Riverkeeper survey focused on the following contaminants:<br />
1. Physical and Chemical Contaminants - Physical and chemical contaminants are impurities that include solids,<br />
such as minerals, as well as physical characteristics of the water, such as temperature, turbidity, and pH. These are<br />
present in watershed streams and reservoirs as a result of the natural geology and environment, or are transported<br />
in s<strong>to</strong>rmwater runoff from various land use practices, such as phosphorus from fertilizer application. Many of these<br />
impurities are naturally occurring and present in all drinking water supplies.<br />
2. Organic Contaminants - This category includes a wide variety of carbon-based compounds including landscaping<br />
products such as pesticides and herbicides, the hydrocarbons present in solvents and vehicle emissions, industrial<br />
byproducts, DBPs, and carbon from decomposing organic matter. Except for the DBPs, which are created during<br />
the water treatment process, the remaining organic contaminants enter watershed streams and reservoirs in highest<br />
concentrations from areas of intensive urban and agricultural land uses.<br />
3. Disinfection Byproducts - When surface waters receive excessive phosphorus in s<strong>to</strong>rmwater runoff from fertilized<br />
landscapes such as farms and lawns, the increased phosphorus causes algae <strong>to</strong> grow and multiply. When the<br />
algae die off at the end of their life cycle, they release carbon in<strong>to</strong> the water. At drinking water treatment plants,<br />
the carbon reacts with chlorine during the disinfection process <strong>to</strong> form DBPs, some of which are carcinogenic in<br />
high concentrations.<br />
4. Pathogens - Pathogens are microscopic organisms, primarily bacteria and pro<strong>to</strong>zoa that shed from domestic<br />
lives<strong>to</strong>ck and wildlife in<strong>to</strong> s<strong>to</strong>rmwater runoff and enter watershed streams and reservoirs. They can remain active<br />
for more than a month without a host organism, which poses human health risks if they escape detection and enter<br />
the distribution system of drinking water supplies. Two pro<strong>to</strong>zoa of special concern are Cryp<strong>to</strong>sporidium and<br />
Giardia, which can cause intestinal waterborne disease outbreaks when introduced in<strong>to</strong> a drinking water supply.<br />
EPA requires disinfection of drinking water <strong>to</strong> inactivate pathogens both at the point of entry <strong>to</strong> the system from<br />
source waters and within the distribution system. Disinfection may be accomplished with chlorination, UV or ozone<br />
disinfection, or a combination of these. Travel time from source waters <strong>to</strong> the distribution system in NYC also may<br />
render pathogenic organisms inactive.<br />
5. Radionuclides - Radioactive minerals are naturally occurring elements that can leach from rocks and soils<br />
in<strong>to</strong> surface and groundwater supplies. EPA requires testing of water for radiation levels <strong>to</strong> minimize exposure<br />
<strong>to</strong> consumers.<br />
6. Lead and Copper - Lead impairs metabolic processes and is <strong>to</strong>xic <strong>to</strong> the human heart, kidneys, bones, reproductive<br />
organs and central nervous system, especially in children. Although NYCDEP has implemented a public awareness<br />
program <strong>to</strong> inform consumers how <strong>to</strong> properly flush their plumbing systems, the presence and <strong>to</strong>xicity of lead is not<br />
mitigated for consumers who have lead in their plumbing and are unaware of its presence or the flushing procedure.<br />
Chronic exposure <strong>to</strong> copper has been associated with liver, kidney, and intestinal disease. As with lead, copper can<br />
leach from plumbing in<strong>to</strong> tap water. Also as with lead, copper may be flushed from household plumbing by running<br />
cold water before use.<br />
9
7. Pharmaceuticals and Personal Care Products - Discarded prescription and over-the-counter medications,<br />
steroids and antibiotics administered <strong>to</strong> lives<strong>to</strong>ck, and excreted pharmaceuticals that enter wastewater treatment<br />
plants through sanitary sewers or are released by failing septic systems contribute PPCPs <strong>to</strong> surface water supplies.<br />
Virtually all PPCPs are unregulated contaminants for which no federal MCL has been established. Most wastewater<br />
treatment plants are not equipped <strong>to</strong> remove these compounds, so they enter receiving waters after treatment.<br />
PPCPs have recently garnered attention as contaminants of emerging concern due <strong>to</strong> potential health effects and<br />
documented impacts <strong>to</strong> aquatic organisms. It is also well documented that low-level introduction of antibiotics in<strong>to</strong><br />
the environment creates antibiotic-resistant genes in bacteria, which requires the development of new antibiotics <strong>to</strong><br />
treat diseases caused by the resistant bacteria strains.<br />
More about PPCPs<br />
A 2000 United States Geological Survey(USGS) report on PPCPs in U.S. streams included 11 sampling sites<br />
in the Cro<strong>to</strong>n watershed. All 11 streams contained detectable levels of 10 selected human pharmaceutical<br />
compounds, including hormones and pain relievers. Although not currently required by law, cities have begun<br />
<strong>to</strong> test for PPCPs due <strong>to</strong> increasing concern about the potential health and environmental issues associated<br />
with these compounds.<br />
How Does New York’s <strong>Drink</strong>ing <strong>Water</strong> Compare<br />
<strong>to</strong> Other Large Cities?<br />
Summary of Findings<br />
Riverkeeper’s comparison of New York City’s drinking water <strong>to</strong> the filtered and unfiltered water supplies of other cities<br />
surveyed revealed the following:<br />
1. Overall, New York City’s drinking water met state and federal water quality standards in most areas, but fell short<br />
in some others.<br />
2. <strong>Drink</strong>ing water quality data from all 14 cities surveyed showed variability in the number of contaminants tested for<br />
and detected. Despite this variability, a consistent finding among the cities surveyed was the extremely low number<br />
of exceedances reported. Raw and treated water can and does contain numerous impurities. Even bottled water<br />
contains trace concentrations of a variety of contaminants. However, the low number of exceedances reported is<br />
based on state and federal drinking water quality standards, which reflect determinations by regula<strong>to</strong>rs that the<br />
levels of contaminants found in drinking water supplies are in concentrations that do not pose health risks<br />
<strong>to</strong> consumers.<br />
3. One exception <strong>to</strong> the low exceedance rates reported is the exceedance of lead concentrations at the end of the<br />
distribution systems of older cities. This does not indicate contamination of underlying surface water supplies, but<br />
can be a cause for concern at the tap if lead-soldered plumbing systems are not flushed prior <strong>to</strong> use.<br />
10
Table 1: Selected Filtered and Unfiltered Cities Surveyed, Listed by Population Size (2010 census)<br />
Filtered<br />
Los Angeles Chicago Hous<strong>to</strong>n Philadelphia Phoenix San An<strong>to</strong>nio San Diego Dallas San Jose<br />
3,792,621 2,695,598 2,099,451 1,526,006 1,445,632 1,327,407 1,307,402 1,197,816 967,942<br />
Unfiltered<br />
New York San Francisco Bos<strong>to</strong>n Seattle Portland, OR<br />
8,175,133 805,235 617,594 608,660 583,776<br />
<strong>Is</strong> Bottled <strong>Water</strong> Better?<br />
Until recently there has been little evidence <strong>to</strong> refute the claims of superior purity by the bottled water industry.<br />
However, an Oc<strong>to</strong>ber 2008 study by the Environmental Working Group (EWG), a non-profit environmental<br />
organization dedicated <strong>to</strong> disseminating public information <strong>to</strong> protect public health and the environment,<br />
published a survey identifying 38 pollutants in 10 major brands of bottled water. Those pollutants included DBPs<br />
and fluoride – chemical signatures of the chlorine disinfection used by opera<strong>to</strong>rs of municipal water supplies.<br />
Pharmaceuticals, heavy metals, arsenic, organic contaminants, bacteria, and radionuclides also were detected.<br />
EWG’s report noted that all municipal drinking water supplies are tested by certified labs under the authority of<br />
state and federal regula<strong>to</strong>ry agencies, whereas the bottled water industry conducts unregulated, in-house water<br />
quality testing that can vary significantly in standards and quality control. For all of these reasons, EWG recommended<br />
that consumers drink filtered tap water rather than bottled water.<br />
Specific Study Findings: Contaminants Tested for and Detected<br />
1. Testing and Detection Totals—Comparing New York <strong>to</strong> both filtered and unfiltered cities, NYCDEP’s testing and<br />
detection numbers were at the high end of the range. In all four years surveyed, New York tested drinking water for<br />
more contaminants than any other city surveyed (average 266), with the exception of San Francisco in 2008. The<br />
data also suggest that more robust testing programs such as New York’s result in a higher level of reported<br />
detections than less aggressive programs.<br />
Detection Limits and Trace Concentrations<br />
EPA periodically develops new testing methods that have more sensitive detection limits, some as low as concentrations<br />
of nanograms per liter. One nanogram per liter is equivalent <strong>to</strong> one part per trillion (ppt). A common<br />
analogy used <strong>to</strong> demonstrate the relative concentration of one ppt is the concentration of one drop of water<br />
added <strong>to</strong> a volume of water needed <strong>to</strong> fill 26 Olympic-size swimming pools. As technology develops analytical<br />
methods capable of increasingly lower detection limits, it is likely that trace amounts of more compounds will be<br />
detected in drinking water supplies in the future.<br />
11
Figure 3: Average Number of Contaminants Tested for 2008-2011 in Filtered Cities<br />
Figure 4: Average Number of Contaminants Tested For 2008-2011 in Unfiltered Cities<br />
12
Figure 5: Average Number of Contaminants Detected 2008-2011 in Filtered Cities<br />
Figure 6: Average Number of Contaminants Detected 2008-2011 in Unfiltered Cities<br />
13
2. Pathogens Detected—In New York, the number of samples that tested positive for Giardia and Cryp<strong>to</strong>sporidium<br />
fluctuated between the reporting years, with Giardia detected at higher frequencies in both reservoir systems in all<br />
years surveyed. A positive test indicating the presence of these pathogens does not indicate whether they are<br />
alive or potentially infectious, but neither does it indicate that the pathogens are not alive. The data also indicated<br />
that E. coli, which has in the past occurred in very small numbers in the City’s drinking water supply, more<br />
recently has not been detected at all in thousands of samples. NYCDEP’s 2010 and 2011 reports also note that<br />
the Cat/Del UV disinfection facility is due <strong>to</strong> come online in 2013. This facility, located in Westchester County,<br />
did come on line in December 2012 and will add an additional barrier for waters from the Catskill and Delaware<br />
watersheds <strong>to</strong> inactivate these and other pathogens by exposing the water <strong>to</strong> UV radiation in addition <strong>to</strong> chlorine.<br />
Table 2: Cryp<strong>to</strong>sporidium and Giardia in the Cro<strong>to</strong>n and Cat/Del Systems 2008-2011<br />
Pathogen 2008 2009 2010 2011<br />
Cryp<strong>to</strong>sporidium<br />
Cro<strong>to</strong>n<br />
8<br />
4<br />
5<br />
5<br />
4<br />
1<br />
3<br />
Cat/Del<br />
11<br />
Giardia<br />
Cro<strong>to</strong>n<br />
Cat/Del<br />
26<br />
85<br />
22<br />
82<br />
30<br />
68<br />
39<br />
81<br />
3. Organics Detected—NYCDEP detected DBPs in both the Cro<strong>to</strong>n and Cat/Del system water; however,<br />
concentrations were consistently below the allowable MCL. In addition, of the other 200+ organic compounds<br />
NYCDEP tested for annually, only one pesticide, one herbicide, and one solvent were detected, all at concentrations<br />
well below the regulated MCL.<br />
Specific Study Findings: Exceedances<br />
Discounting exceedances for lead, which occurred locally at the end of the distribution system and not in the source<br />
water, New York City’s average number of exceedances dropped from 15 <strong>to</strong> 1.5 during the four-year sampling period.<br />
Figures 7 and 8 indicate that other cities’ exceedances dropped significantly as well when lead is discounted. It is<br />
noteworthy that except for lead at the tap, New York reported exceedances for only two parameters, both aesthetic—<br />
color and turbidity—which by themselves pose no direct health risks <strong>to</strong> consumers.<br />
1. Turbidity— Although turbidity in drinking water supplies is primarily an aesthetic concern, suspended solids in<br />
turbid water may mask the presence of waterborne pathogens such as Cryp<strong>to</strong>sporidium and Giardia. Although the<br />
testing methods were not capable of determining whether these pathogens were alive or infectious and no<br />
waterborne disease outbreaks were attributed <strong>to</strong> the City’s drinking water supplies, the presence of any potentially<br />
disease-causing organisms in drinking water supplies is of concern.<br />
In fact, EPA considers turbidity <strong>to</strong> be the greatest threat <strong>to</strong> New York City’s FAD due <strong>to</strong> the potential health<br />
risks associated with pathogens in drinking water reservoirs that may be masked by elevated levels of turbidity.<br />
The Catskill <strong>Water</strong>shed has clay soils that scour from streambanks and streambeds during heavy rains. The<br />
suspended clay particles are carried downstream and deposited in reservoirs, where it may take weeks or months<br />
<strong>to</strong> settle before the water is clear enough <strong>to</strong> divert <strong>to</strong> the Catskill Aqueduct and send <strong>to</strong> consumers. In addition<br />
<strong>to</strong> turbidity in upstream reservoirs, turbidity in the distribution system, caused by localized disturbances such as<br />
water main breaks or construction, ranged, during the study period, from as high as 19.2 NTU in 2008, 22.5 NTU<br />
in 2009, 18.4 NTU in 2010 <strong>to</strong> a low of 7.4 NTU in 2011. The federal <strong>Safe</strong> <strong>Drink</strong>ing <strong>Water</strong> Act limits turbidity in public<br />
drinking water distribution systems <strong>to</strong> 5 nephelometric turbidity units (NTU).<br />
14
Figure 7: Average Number of Exceedances Reported 2008-2011 in Filtered Cities<br />
Figure 8: Average Number of Exceedances Reported 2008-2011 in Unfiltered Cities<br />
15
2. Lead Exceedances—Because the use of lead-solder joints in domestic plumbing was not banned until the <strong>Safe</strong><br />
<strong>Drink</strong>ing <strong>Water</strong> Act <strong>to</strong>ok effect in 1986, any plumbing installed prior <strong>to</strong> that date has the potential <strong>to</strong> leach lead in<strong>to</strong><br />
tap water. Running tap water for 30 seconds effectively flushes lead from household plumbing. Lead can also be<br />
removed by a variety of counter<strong>to</strong>p filter systems. However, some consumers may be unaware of these procedures<br />
and, as a result, may be ingesting lead at levels above federally regulated health thresholds. New York City’s lead<br />
exceedances represented 7.5% of the households tested in 2008; the same data was not reported as a percentage<br />
for 2009 or 2010, although 30 lead exceedances were reported in 2010. In November of 2010, NYCDEP implemented<br />
a public awareness program <strong>to</strong> educate consumers about lead in drinking water. In addition, as a result of the lead<br />
exceedances in 2010, NYCDEP began replacing all City-owned lead service lines. In 2011, there were 20 reported<br />
lead exceedances.<br />
Present and Future Risks <strong>to</strong> New York City<br />
<strong>Drink</strong>ing <strong>Water</strong> Supply<br />
Turbidity<br />
As discussed above, turbidity in the Catskill <strong>Water</strong>shed poses a risk <strong>to</strong> New York City’s drinking water supply if it<br />
cannot be reduced through structural and non-structural management practices. State and federal standards for<br />
turbidity were periodically exceeded in upstream reservoirs, including the Ashokan, during the years surveyed,<br />
requiring DEP <strong>to</strong> minimize the use of Catskill waters <strong>to</strong> supply NYC drinking water. In addition <strong>to</strong> turbidity in<br />
upstream reservoirs, 2008, 2009 and 2010, turbidity in the Ashokan Reservoir was periodically <strong>to</strong>o high <strong>to</strong> allow<br />
diversion of water <strong>to</strong> the Kensico Reservoir. In an attempt <strong>to</strong> address this persistent problem, in 2008, the City’s<br />
consultants evaluated 26 operational alternatives designed <strong>to</strong> control turbidity in the Catskill reservoir system. Those<br />
alternatives included constructing diversion walls, additional reservoir outlets, and improvements <strong>to</strong> the Catskill<br />
Aqueduct, among others. In addition, NYCDEP’s Catskill Turbidity Control Study evaluated a multi-level intake at<br />
the Schoharie Reservoir <strong>to</strong> allow opera<strong>to</strong>rs <strong>to</strong> select the least turbid water from the water column. The City selected<br />
four alternatives: the repair of s<strong>to</strong>p shutters in the Catskill Aqueduct, the construction of an interconnection between<br />
the Catskill and Delaware Aqueducts, the diversion of turbid Catskill system water <strong>to</strong> a waste channel and the use of<br />
modeling <strong>to</strong> balance water levels in the Catskill reservoirs. To date, the City has implemented only two alternatives<br />
evaluated from the study: a waste channel diverts turbid water from the Ashokan Reservoir <strong>to</strong> the Lower Esopus<br />
Creek and an Operations Support Tool (OST) uses computer modeling <strong>to</strong> balance the level of water in the Catskill<br />
reservoirs. All of these practices have drawbacks. The turbid waste channel releases have impacted the ecology of<br />
the Lower Esopus Creek and diminished the economic and recreational values the creek provides <strong>to</strong> local communities.<br />
The OST modeling predicts the probability of filling City reservoirs based on his<strong>to</strong>ric rainfall data, but cannot<br />
currently forecast future rain events that should be fac<strong>to</strong>red in<strong>to</strong> those predictions. This is significant considering<br />
the increasing frequency of severe s<strong>to</strong>rm events that may be associated with climate change. As the Catskill Region<br />
experiences more frequent and intense rains<strong>to</strong>rms in<strong>to</strong> the future, computer models driven by his<strong>to</strong>rical data from the<br />
last century become less reliable.<br />
In addition, the New York City MOA required NYCDEP <strong>to</strong> develop a Stream Management Program <strong>to</strong> protect and<br />
enhance the integrity of the watershed stream systems. Although NYCDEP prioritizes problem areas and has res<strong>to</strong>red<br />
some impacted reaches in the vast Catskill <strong>Water</strong>shed stream system, res<strong>to</strong>ration of all existing and future impaired<br />
streams is not practical or sustainable as a regional solution. NYCDEP has reviewed other measures <strong>to</strong> reduce<br />
Catskill turbidity, but <strong>to</strong> date has implemented only the OST, the waste channel, and some in-reservoir practices <strong>to</strong><br />
repair and/or upgrade infrastructure.<br />
In spite of implementing these turbidity management practices, NYCDEP has been unable <strong>to</strong> deliver water that meets<br />
turbidity standards from the Catskill system for periods of days or weeks following significant s<strong>to</strong>rm events during the<br />
last several years without the use of alum treatment at the Kensico Reservoir, a practice that EPA, DOH and DEC<br />
have sought <strong>to</strong> limit. Additional measures will almost certainly be required <strong>to</strong> protect the Catskill reservoirs from<br />
sediment loading (turbidity) and thereby maintain the City’s FAD in<strong>to</strong> the future.<br />
16
Natural Gas Extraction using High Volume Hydraulic Fracturing<br />
The prospect of high-volume hydraulic fracturing (fracking) for natural gas in New York State also poses a potential<br />
future threat <strong>to</strong> the New York City drinking water supply. Although presently there is no proposal <strong>to</strong> allow surface<br />
drilling <strong>to</strong> enable fracking within the boundaries of the New York City <strong>Water</strong>shed, fracking activity outside of the<br />
watershed, in particular, horizontal drilling under the City’s aqueducts and other infrastructure—if New York State<br />
approves fracking—may compromise the integrity of that infrastructure, which was not designed <strong>to</strong> withstand the<br />
physical stresses of subsurface activity associated with fracking.<br />
Conclusions and Recommendations<br />
Conclusions<br />
In almost every respect, New York City’s municipal drinking water currently meets regula<strong>to</strong>ry safety standards. New<br />
York’s testing program is robust and more comprehensive than other large U.S. cities. In response <strong>to</strong> recognition by<br />
the scientific community that trace concentrations of PPCPs pose potential risks <strong>to</strong> aquatic life and human health,<br />
New York, Portland, Seattle, Bos<strong>to</strong>n and Chicago have adopted a more responsible and proactive testing approach<br />
than that of the other cities surveyed, although New York suspended testing for PPCPs in 2011.<br />
Examination of New York City’s annual reports on drinking water quality from 2008–2011 reveal several concerns.<br />
First, while the source waters for New York City’s drinking water meet all state and federal water quality standards<br />
except for turbidity, it is concerning that at the endpoint of the distribution system, drinking water from the tap<br />
for some households contains lead concentrations that exceed regula<strong>to</strong>ry health standards due <strong>to</strong> leaching from<br />
aging plumbing systems. Also of concern is the intermittent incidence of Cryp<strong>to</strong>sporidium and Giardia detection in<br />
New York City’s drinking water supplies. Finally, although only trace amounts of PPCPs are currently found in public<br />
drinking water supplies, it is unclear whether health impacts may be associated with long-term exposure <strong>to</strong> trace<br />
concentrations of PPCPs.<br />
In addition, there are a number of potential future threats <strong>to</strong> the quality of New York City’s drinking water. Continued<br />
urbanization and its associated s<strong>to</strong>rmwater impacts, forest clearing for agriculture and other changes in land use can,<br />
in the future, degrade water quality in receiving waters and ultimately contribute <strong>to</strong> impaired drinking water quality in<br />
New York City’s 19 reservoirs. The prospect of continued or increased turbidity in Catskill source waters also threatens<br />
the long-term protection of drinking water quality and the ability of the City <strong>to</strong> avoid filtering the Catskill system. Finally,<br />
fracking in close proximity <strong>to</strong> the Catskill and Delaware <strong>Water</strong>sheds would pose a significant threat <strong>to</strong> the City’s drinking<br />
water supply infrastructure.<br />
The high quality of NYC’s unfiltered drinking water supply constitutes a precious and irreplaceable resource, particularly<br />
in light of the substantial cost that filtration would impose on the City’s water users should that quality be allowed<br />
<strong>to</strong> deteriorate. Consequently, New York City’s drinking water supply warrants heightened protection measures <strong>to</strong><br />
safeguard its high quality from degradation. While it is encouraging that overall the City’s drinking water quality<br />
remains high, NYCDEP should address threats <strong>to</strong> water quality that could pose health risks <strong>to</strong> consumers now and in<br />
the future.<br />
Recommendations<br />
Riverkeeper offers the following recommendations <strong>to</strong> ensure the continued availability of high-quality drinking water<br />
for New York City and Hudson Valley residents:<br />
1. The issue of turbidity in the Catskill <strong>Water</strong>shed should be addressed swiftly and decisively. As s<strong>to</strong>rm frequency and<br />
intensity apparently are increasing in the Northeast, it is critical that turbidity control measures are enhanced <strong>to</strong><br />
address increased s<strong>to</strong>rm flows in the Catskills. NYCDEP should reconsider alternative turbidity control measures<br />
it has rejected in the past and implement the most effective measures possible <strong>to</strong> protect Catskill reservoirs from<br />
excessive sediment loading in order <strong>to</strong> protect drinking water quality and preserve New York City’s FAD.<br />
17
2. Pathogen moni<strong>to</strong>ring in the New York City <strong>Water</strong>shed should be enhanced <strong>to</strong> trace and eliminate sources of<br />
Cryp<strong>to</strong>sporidium, Giardia, and Coliform bacteria in drinking water supplies. The inability of testing pro<strong>to</strong>cols <strong>to</strong><br />
determine whether some pathogens are alive and the resistance of some <strong>to</strong> chlorine disinfection increases the risk<br />
of waterborne disease outbreaks among New York City and upstate residents. Although the City’s UV disinfection<br />
plant will add another layer of protection against waterborne pathogens when it comes online, hundreds of<br />
thousands of consumers in Westchester County and other upstream communities will draw drinking water from<br />
the Cat/Del system that has not been treated by DEP’s UV plant. Effective control of Coliform bacteria and<br />
Cryp<strong>to</strong>sporidium in source water supplies <strong>to</strong> protect upstate consumers should continue <strong>to</strong> be an integral<br />
component of NYCDEP’s watershed protection programs, including the farm management practices implemented<br />
pursuant <strong>to</strong> its <strong>Water</strong>shed Agricultural Program. In addition, if it becomes necessary <strong>to</strong> effectively control pathogen<br />
levels in the future, DEP should make efforts <strong>to</strong> increase the number of farms enrolled in the Whole Farm Program<br />
and expand the City’s <strong>Water</strong>fowl Management Program <strong>to</strong> other Cat/Del system reservoirs where needed.<br />
3. NYCDEP should resume moni<strong>to</strong>ring source and distribution waters for PPCPs <strong>to</strong> determine whether concentrations<br />
are stable or increasing. Pharmaceuticals, which are designed <strong>to</strong> alter human physiology, persist in surface waters<br />
through human excretion and wastewater disposal. Some breakdown products of these compounds are highly<br />
<strong>to</strong>xic <strong>to</strong> human cells and cause DNA damage. Physiological impacts <strong>to</strong> aquatic organisms from exposure <strong>to</strong><br />
excreted PPCPs are also well-documented. 2 Although PPCPs are present in New York City drinking water<br />
reservoirs only in trace amounts and NYCDEP and NYSDOH do not consider these amounts sufficient <strong>to</strong> present a<br />
potential health concern as a result of long-term exposure, that conclusion is not supported by any long-term<br />
medical studies. Until such information becomes available, NYCDEP should be proactive and resume moni<strong>to</strong>ring of<br />
PPCPs. In addition, NYCDEP should implement a public information program <strong>to</strong> educate consumers on the proper<br />
disposal of medical wastes, prescription and non-prescription medications, and personal care products. Finally,<br />
we urge NYSDOH and the U.S. Environmental Protection Agency (EPA) <strong>to</strong> develop regula<strong>to</strong>ry standards for these<br />
contaminants in municipal drinking water supplies.<br />
4. NYCDEP should continue and enhance its public education program <strong>to</strong> inform consumers of potential lead<br />
contamination from older household plumbing fixtures. In addition, if lead exceedances continue <strong>to</strong> be detected<br />
in the future, NYCDEP should implement more retrofitting of aging lead-and-copper plumbing systems in affected<br />
areas. New York City and/or NYSDOH should subsidize or at least require the retrofitting of lead-soldered plumbing<br />
with lead-free solder in households where lead levels are detected.<br />
Acknowledgements<br />
This report was prepared with the invaluable assistance of Riverkeeper interns Zachary Livings<strong>to</strong>n, Liza Gordon,<br />
Hilary Atkin, Jennifer McAleese, Jeannine Cahill, and Meaghan Colligan.<br />
2<br />
NYSDEC, Drugs in New York’s <strong>Water</strong>s, available at: http://www.dec.ny.gov/chemical/45083.html.<br />
18
Appendix A<br />
Statutes, Regulations, Agency Acronyms, Studies Referenced, and Glossary<br />
Statutes and Regulations<br />
<strong>Safe</strong> <strong>Drink</strong>ing <strong>Water</strong> Act (SDWA) 42 U.S.C. §300f et seq (1974)<br />
Agency Acronyms<br />
(NYCDEP) ..........................................................................New York City Department of Environmental Protection<br />
(NYSDOH) ...................................................................................................New York State Department of Health<br />
(EPA) U.S. .......................................................................................................... Environmental Protection Agency<br />
Studies Referenced<br />
United States Geological Survey (USGS): Heisig, P.M. Effects of Residential and Agricultural Land Uses on the<br />
Chemical Quality of Baseflow of Small Streams in the Cro<strong>to</strong>n <strong>Water</strong>shed, Southeastern New York. U.S. Geological<br />
Survey (USGS) <strong>Water</strong>-Resources Investigations Report 99-4173. (2000), available at<br />
http://ny.water.usgs.gov/pubs/wri/wri994173/WRIR99-4173.pdf.<br />
Environmental Working Group (EWG): Bottled <strong>Water</strong> Quality Investigation: 10 Major Brands, 38 Pollutants (2008),<br />
available at http://www.ewg.org/reports/Bottled<strong>Water</strong>/Bottled-<strong>Water</strong>-Quality-Investigation.<br />
Glossary<br />
Cryp<strong>to</strong>sporidium – a waterborne microorganism that causes intestinal disease and enters water supplies primarily<br />
from contact with infected wildlife.<br />
Disinfection byproducts (DBPs) – secondary chemical compounds formed when chlorine used in disinfection<br />
reacts with organic carbon in the water.<br />
Giardia – a waterborne microorganism that causes intestinal disease and enters water supplies primarily from<br />
contact with infected wildlife.<br />
Groundwater – water held underground in the soil or bedrock.<br />
Hydrocarbon – a chemical compound containing hydrogen and carbon, and often other elements.<br />
Maximum Contaminant Level (MCL) – the maximum permissible concentration of a contaminant in water that is<br />
delivered <strong>to</strong> any user of a public water system.<br />
Organic carbon – carbon available as a food source for aquatic food webs.<br />
Pathogens – bacteria, viruses, or other microorganisms that can cause disease.<br />
Radionuclides – Any man-made or natural element that emits radioactivity.<br />
Turbidity – cloudiness created by sediment particles suspended in water.<br />
19
Appendix B<br />
<strong>Drink</strong>ing <strong>Water</strong> Quality Data<br />
<strong>Drink</strong>ing <strong>Water</strong> Quality of Selected Filtered Cities 2008-2011<br />
20
<strong>Drink</strong>ing <strong>Water</strong> Quality of Selected Unfiltered Cities 2008-2011<br />
21