Lab assignment Class 1: weighting worksheet Let's say you ... - Users
Lab assignment Class 1: weighting worksheet Let's say you ... - Users
Lab assignment Class 1: weighting worksheet Let's say you ... - Users
- No tags were found...
Create successful ePaper yourself
Turn your PDF publications into a flip-book with our unique Google optimized e-Paper software.
<strong>Lab</strong> <strong>assignment</strong><br />
<strong>Class</strong> 1: <strong>weighting</strong> <strong>worksheet</strong><br />
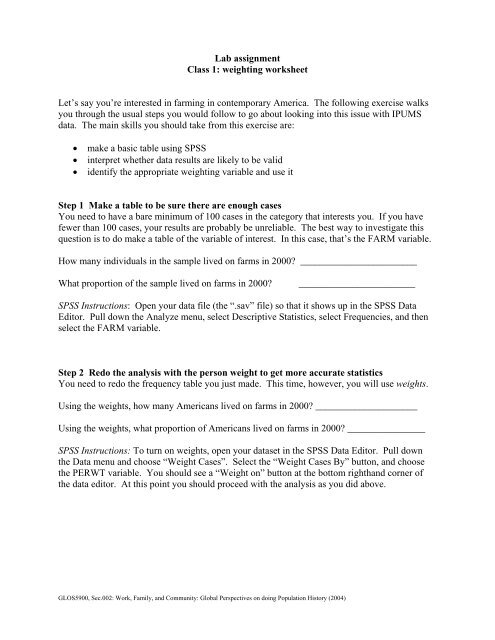
Let’s <strong>say</strong> <strong>you</strong>’re interested in farming in contemporary America. The following exercise walks<br />
<strong>you</strong> through the usual steps <strong>you</strong> would follow to go about looking into this issue with IPUMS<br />
data. The main skills <strong>you</strong> should take from this exercise are:<br />
• make a basic table using SPSS<br />
• interpret whether data results are likely to be valid<br />
• identify the appropriate <strong>weighting</strong> variable and use it<br />
Step 1 Make a table to be sure there are enough cases<br />
You need to have a bare minimum of 100 cases in the category that interests <strong>you</strong>. If <strong>you</strong> have<br />
fewer than 100 cases, <strong>you</strong>r results are probably be unreliable. The best way to investigate this<br />
question is to do make a table of the variable of interest. In this case, that’s the FARM variable.<br />
How many individuals in the sample lived on farms in 2000? ________________________<br />
What proportion of the sample lived on farms in 2000?<br />
________________________<br />
SPSS Instructions: Open <strong>you</strong>r data file (the “.sav” file) so that it shows up in the SPSS Data<br />
Editor. Pull down the Analyze menu, select Descriptive Statistics, select Frequencies, and then<br />
select the FARM variable.<br />
Step 2 Redo the analysis with the person weight to get more accurate statistics<br />
You need to redo the frequency table <strong>you</strong> just made. This time, however, <strong>you</strong> will use weights.<br />
Using the weights, how many Americans lived on farms in 2000? _____________________<br />
Using the weights, what proportion of Americans lived on farms in 2000? ________________<br />
SPSS Instructions: To turn on weights, open <strong>you</strong>r dataset in the SPSS Data Editor. Pull down<br />
the Data menu and choose “Weight Cases”. Select the “Weight Cases By” button, and choose<br />
the PERWT variable. You should see a “Weight on” button at the bottom righthand corner of<br />
the data editor. At this point <strong>you</strong> should proceed with the analysis as <strong>you</strong> did above.<br />
GLOS5900, Sec.002: Work, Family, and Community: Global Perspectives on doing Population History (2004)
Step 3 Using the household weights<br />
Suppose <strong>you</strong> were interested not in the number of people living on farms, but in the number of<br />
American households that were on farms. In other words, <strong>you</strong> want a count of farms, not people.<br />
To get this statistic <strong>you</strong> would need to use the household weight<br />
In order to use household weight, <strong>you</strong> should be careful to select only one person from each<br />
household to represent that household’s characteristics. Use SPSS to select the first person from<br />
each household (cases where PERNUM=1).<br />
SPSS Instructions: In the Data Editor, pull down the Data menu and choose “Select Cases”. In<br />
the window that pops up, select the second button, labeled “If condition is satisfied”. Click the<br />
“If” button, and type “pernum=1” in the upper right-hand corner of the window that pops up.<br />
Press “Continue” and “OK”. All cases where pernum is not equal to 1 should now have a slash<br />
by them in the Data Editor.<br />
As <strong>you</strong> did in Step 1 above, <strong>you</strong> first need to confirm that there are enough farm households to<br />
get reliable results. Produce a frequency table of the farm variable<br />
How many households in the sample were on farms?<br />
_______________<br />
As <strong>you</strong> did in Step 2 above, <strong>you</strong> need to apply the household weight variable (HHWT) to get<br />
fully reliable statistics.<br />
Using the household weights, how many American households lived on farms in 2000?<br />
________________<br />
GLOS5900, Sec.002: Work, Family, and Community: Global Perspectives on doing Population History (2004)


