Chapter 7: Aggregate Demand and Aggregate Demand and ...
Chapter 7: Aggregate Demand and Aggregate Demand and ...
Chapter 7: Aggregate Demand and Aggregate Demand and ...
- No tags were found...

Create successful ePaper yourself
Turn your PDF publications into a flip-book with our unique Google optimized e-Paper software.
<strong>Chapter</strong> 7:<br />
<strong>Aggregate</strong><br />
<strong>Dem<strong>and</strong></strong> <strong>and</strong><br />
<strong>Aggregate</strong> Supply<br />
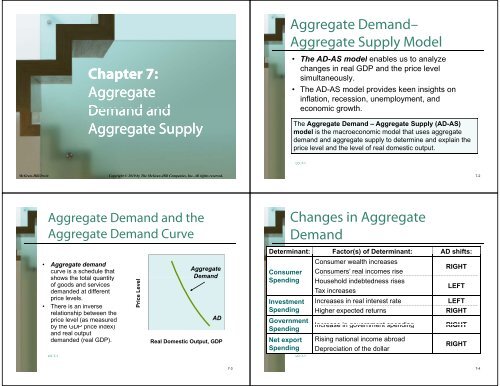
<strong>Aggregate</strong> <strong>Dem<strong>and</strong></strong>–<br />
<strong>Aggregate</strong> Supply Model<br />
• The AD-ASAS model enables us to analyze<br />
changes in real GDP <strong>and</strong> the price level<br />
simultaneously.<br />
• The AD-AS model provides keen insights on<br />
inflation, recession, unemployment, <strong>and</strong><br />
economic growth.<br />
The <strong>Aggregate</strong> <strong>Dem<strong>and</strong></strong> – <strong>Aggregate</strong> Supply (AD-AS)<br />
model is the macroeconomic model that uses aggregate<br />
dem<strong>and</strong> <strong>and</strong> aggregate supply to determine <strong>and</strong> explain the<br />
price level <strong>and</strong> the level of real domestic output.<br />
LO: 7-1<br />
McGraw-Hill/Irwin<br />
Copyright © 2010 by The McGraw-Hill Companies, Inc. All rights reserved.<br />
7-2<br />
<strong>Aggregate</strong> <strong>Dem<strong>and</strong></strong> <strong>and</strong> the<br />
<strong>Aggregate</strong> <strong>Dem<strong>and</strong></strong> Curve<br />
• <strong>Aggregate</strong> dem<strong>and</strong><br />
curve is a schedule that<br />
shows the total quantity<br />
of goods <strong>and</strong> services<br />
dem<strong>and</strong>ed at different<br />
price levels.<br />
• There is an inverse<br />
relationship between the<br />
price level (as measured<br />
by the GDP price index)<br />
<strong>and</strong> real output<br />
dem<strong>and</strong>ed (real GDP).<br />
LO: 7-1<br />
ice Level<br />
Pri<br />
<strong>Aggregate</strong><br />
<strong>Dem<strong>and</strong></strong><br />
AD<br />
Real Domestic Output, GDP<br />
Changes in <strong>Aggregate</strong><br />
<strong>Dem<strong>and</strong></strong><br />
Determinant: Factor(s) of Determinant: AD shifts:<br />
Consumer wealth increases<br />
Consumer Consumers’ real incomes rise<br />
RIGHT<br />
Spending Household indebtedness rises<br />
Tax increases<br />
LEFT<br />
Investment<br />
Increases in real interest rate<br />
LEFT<br />
Spending Higher expected returns<br />
RIGHT<br />
Government<br />
Spending<br />
Increase in government spending<br />
RIGHT<br />
Net export Rising national income abroad<br />
Spending<br />
Depreciation of the dollar<br />
RIGHT<br />
LO: 7-1<br />
7-3<br />
7-4
Shifts in the <strong>Aggregate</strong><br />
<strong>Dem<strong>and</strong></strong> dCurve<br />
LO: 7-1<br />
ce Level<br />
Pric<br />
Decrease in<br />
<strong>Aggregate</strong><br />
<strong>Dem<strong>and</strong></strong><br />
Increase in<br />
<strong>Aggregate</strong><br />
<strong>Dem<strong>and</strong></strong><br />
AD 3<br />
Real Domestic Output, GDP<br />
AD 1<br />
AD 2<br />
7-5<br />
<strong>Aggregate</strong> Supply<br />
• <strong>Aggregate</strong> supply curve is a schedule that shows the<br />
total quantity of goods <strong>and</strong> services supplied at different<br />
price levels.<br />
• The aggregate supply curve in the short run <strong>and</strong> in the<br />
long run vary by the degree of wage adjustment<br />
• In the immediate short run, output <strong>and</strong> input prices are<br />
fixed, <strong>and</strong> the AS curve is horizontal<br />
• In the short run output prices are flexible while input prices<br />
are sticky, thus the AS curve is positively sloped<br />
• In the long run all prices are flexible, economy is at full<br />
employment (output is equal to potential), <strong>and</strong> the AS curve<br />
is vertical<br />
LO: 7-2<br />
7-6<br />
Immediate Short Run<br />
<strong>Aggregate</strong> Supply<br />
Short Run<br />
<strong>Aggregate</strong> Supply<br />
Pric ce Level<br />
AS ISR<br />
Price Leve el<br />
<strong>Aggregate</strong> Supply<br />
(Short Run)<br />
Immediate Short Run<br />
<strong>Aggregate</strong> Supply<br />
0<br />
Q f<br />
7-8<br />
Real Domestic Output, GDP<br />
LO: 7-2<br />
Real Domestic Output, GDP<br />
LO: 7-2<br />
7-7
Long Run<br />
<strong>Aggregate</strong> Supply<br />
Changes in <strong>Aggregate</strong> Supply<br />
ce Level<br />
Pric<br />
Long Run<br />
<strong>Aggregate</strong><br />
Supply<br />
AS LR<br />
Determinant: Factor(s) of Determinant: AS<br />
shifts:<br />
Input Prices Domestic resource prices rise<br />
Prices of imported resources rise<br />
Increased market power<br />
LEFT<br />
Productivity Increases in productivity RIGHT<br />
Legal-<br />
Institutional<br />
Environment<br />
Higher business taxes<br />
More government regulation<br />
LEFT<br />
LO: 7-2<br />
Real Domestic Output, GDP<br />
7-9<br />
LO: 7-2<br />
7-10<br />
Shifts in the <strong>Aggregate</strong><br />
Supply Curve<br />
LO: 7-2<br />
Pric ce Level<br />
Decrease in<br />
<strong>Aggregate</strong><br />
Supply<br />
AS 3<br />
AS1<br />
Real Domestic Output, GDP<br />
AS 2<br />
Increase in<br />
<strong>Aggregate</strong><br />
Supply<br />
Equilibrium Price Level <strong>and</strong><br />
Real GDP<br />
• Equilibrium occurs at the price level that<br />
equalizes the amount of real output<br />
dem<strong>and</strong>ed <strong>and</strong> supplied.<br />
• The equilibrium point is the intersection<br />
of the aggregate dem<strong>and</strong> curve <strong>and</strong><br />
aggregate supply curve.<br />
• This intersection determines the<br />
equilibrium price level <strong>and</strong> equilibrium<br />
real output.<br />
LO: 7-3<br />
7-11<br />
7-12
Equilibrium<br />
Equilibrium<br />
Real Output<br />
t Real Output<br />
t<br />
<strong>Dem<strong>and</strong></strong>ed<br />
Price Level<br />
Supplied<br />
(Billions)<br />
(Index Number) (Billions)<br />
AS<br />
$506 108<br />
$513<br />
508 104 512<br />
510 100 510<br />
Price Level<br />
100<br />
Equilibrium<br />
LO: 7-3<br />
512 96 507<br />
514 92 502<br />
Equilibrium Price Level <strong>and</strong><br />
Equilibrium Real GDP<br />
LO: 7-3<br />
AD<br />
510<br />
Real Domestic Output, GDP (Billions of Dollars)<br />
7-13<br />
7-14<br />
Using the AD-AS Model to Explain<br />
Inflation <strong>and</strong> Recession<br />
• When aggregate supply <strong>and</strong> aggregate dem<strong>and</strong><br />
change, inflation <strong>and</strong> recession can occur in the<br />
short run.<br />
• <strong>Dem<strong>and</strong></strong>-pull inflation occurs when aggregate<br />
dem<strong>and</strong> increases (AD curve shifts to the right).<br />
• Cost-push inflation occurs when the costs of<br />
production rise (AS curve shifts to the left).<br />
• Recession occurs when aggregate dem<strong>and</strong> falls<br />
(AD curve shifts to the left) <strong>and</strong> prices are sticky<br />
downwards.<br />
LO: 7-4<br />
7-15<br />
<strong>Dem<strong>and</strong></strong>-Pull Inflation<br />
LO: 7-4<br />
Price<br />
Level<br />
P 2<br />
P 1<br />
Increase in <strong>Aggregate</strong> g <strong>Dem<strong>and</strong></strong><br />
<strong>Dem<strong>and</strong></strong>-Pull<br />
Inflation<br />
Q f Q 1<br />
Real Domestic Output, GDP<br />
AS<br />
AD<br />
AD 1<br />
7-16
Cost-Push Inflation<br />
Recession<br />
Decrease in <strong>Aggregate</strong> g Supply<br />
AS 1<br />
AS<br />
Decrease in <strong>Aggregate</strong> g <strong>Dem<strong>and</strong></strong><br />
AS<br />
Level<br />
Price<br />
P 2<br />
P 1<br />
Cost-Push<br />
Inflation<br />
b<br />
a<br />
e Level<br />
Price<br />
P 1<br />
b<br />
a<br />
LO: 7-4<br />
Q 1 Q f<br />
Real Domestic Output, GDP<br />
AD<br />
7-17<br />
LO: 7-4<br />
Q 2 Q f<br />
Creates a<br />
Recession<br />
AD 1<br />
AD 2<br />
Real Domestic Output, GDP<br />
7-18