NUTRITIVE VALUE OF RICE POLISH - Journal
NUTRITIVE VALUE OF RICE POLISH - Journal
NUTRITIVE VALUE OF RICE POLISH - Journal

Create successful ePaper yourself
Turn your PDF publications into a flip-book with our unique Google optimized e-Paper software.
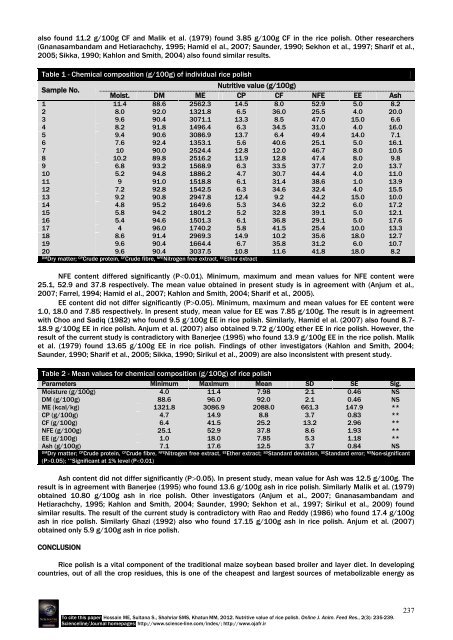
also found 11.2 g/100g CF and Malik et al. (1979) found 3.85 g/100g CF in the rice polish. Other researchers<br />
(Gnanasambandam and Hetiarachchy, 1995; Hamid el al., 2007; Saunder, 1990; Sekhon et al., 1997; Sharif et al.,<br />
2005; Sikka, 1990; Kahlon and Smith, 2004) also found similar results.<br />
Table 1 - Chemical composition (g/100g) of individual rice polish<br />
Sample No.<br />
Moist. DM ME<br />
Nutritive value (g/100g)<br />
CP CF NFE EE Ash<br />
1 11.4 88.6 2562.3 14.5 8.0 52.9 5.0 8.2<br />
2 8.0 92.0 1321.8 6.5 36.0 25.5 4.0 20.0<br />
3 9.6 90.4 3071.1 13.3 8.5 47.0 15.0 6.6<br />
4 8.2 91.8 1496.4 6.3 34.5 31.0 4.0 16.0<br />
5 9.4 90.6 3086.9 13.7 6.4 49.4 14.0 7.1<br />
6 7.6 92.4 1353.1 5.6 40.6 25.1 5.0 16.1<br />
7 10 90.0 2524.4 12.8 12.0 46.7 8.0 10.5<br />
8 10.2 89.8 2516.2 11.9 12.8 47.4 8.0 9.8<br />
9 6.8 93.2 1568.9 6.3 33.5 37.7 2.0 13.7<br />
10 5.2 94.8 1886.2 4.7 30.7 44.4 4.0 11.0<br />
11 9 91.0 1518.8 6.1 31.4 38.6 1.0 13.9<br />
12 7.2 92.8 1542.5 6.3 34.6 32.4 4.0 15.5<br />
13 9.2 90.8 2947.8 12.4 9.2 44.2 15.0 10.0<br />
14 4.8 95.2 1649.6 5.3 34.6 32.2 6.0 17.2<br />
15 5.8 94.2 1801.2 5.2 32.8 39.1 5.0 12.1<br />
16 5.4 94.6 1501.3 6.1 36.8 29.1 5.0 17.6<br />
17 4 96.0 1740.2 5.8 41.5 25.4 10.0 13.3<br />
18 8.6 91.4 2969.3 14.9 10.2 35.6 18.0 12.7<br />
19 9.6 90.4 1664.4 6.7 35.8 31.2 6.0 10.7<br />
20 9.6 90.4 3037.5 10.8 11.6 41.8 18.0 8.2<br />
DMDry matter; CPCrude protein, CFCrude fibre, NFENitrogen free extract, EEEther extract<br />
NFE content differed significantly (P�0.01). Minimum, maximum and mean values for NFE content were<br />
25.1, 52.9 and 37.8 respectively. The mean value obtained in present study is in agreement with (Anjum et al.,<br />
2007; Farrel, 1994; Hamid el al., 2007; Kahlon and Smith, 2004; Sharif et al., 2005).<br />
EE content did not differ significantly (P�0.05). Minimum, maximum and mean values for EE content were<br />
1.0, 18.0 and 7.85 respectively. In present study, mean value for EE was 7.85 g/100g. The result is in agreement<br />
with Choo and Sadiq (1982) who found 9.5 g/100g EE in rice polish. Similarly, Hamid el al. (2007) also found 8.7-<br />
18.9 g/100g EE in rice polish. Anjum et al. (2007) also obtained 9.72 g/100g ether EE in rice polish. However, the<br />
result of the current study is contradictory with Banerjee (1995) who found 13.9 g/100g EE in the rice polish. Malik<br />
et al. (1979) found 13.65 g/100g EE in rice polish. Findings of other investigators (Kahlon and Smith, 2004;<br />
Saunder, 1990; Sharif et al., 2005; Sikka, 1990; Sirikul et al., 2009) are also inconsistent with present study.<br />
Table 2 - Mean values for chemical composition (g/100g) of rice polish<br />
Parameters Minimum Maximum Mean SD SE Sig.<br />
Moisture (g/100g) 4.0 11.4 7.98 2.1 0.46 NS<br />
DM (g/100g) 88.6 96.0 92.0 2.1 0.46 NS<br />
ME (kcal/kg) 1321.8 3086.9 2088.0 661.3 147.9 **<br />
CP (g/100g) 4.7 14.9 8.8 3.7 0.83 **<br />
CF (g/100g) 6.4 41.5 25.2 13.2 2.96 **<br />
NFE (g/100g) 25.1 52.9 37.8 8.6 1.93 **<br />
EE (g/100g) 1.0 18.0 7.85 5.3 1.18 **<br />
Ash (g/100g) 7.1 17.6 12.5 3.7 0.84 NS<br />
DM Dry matter; CP Crude protein, CF Crude fibre, NFE Nitrogen free extract, EE Ether extract; SD Standard deviation, SE Standard error; NS Non-significant<br />
(P�0.05); ** Significant at 1% level (P�0.01)<br />
Ash content did not differ significantly (P�0.05). In present study, mean value for Ash was 12.5 g/100g. The<br />
result is in agreement with Banerjee (1995) who found 13.6 g/100g ash in rice polish. Similarly Malik et al. (1979)<br />
obtained 10.80 g/100g ash in rice polish. Other investigators (Anjum et al., 2007; Gnanasambandam and<br />
Hetiarachchy, 1995; Kahlon and Smith, 2004; Saunder, 1990; Sekhon et al., 1997; Sirikul et al., 2009) found<br />
similar results. The result of the current study is contradictory with Rao and Reddy (1986) who found 17.4 g/100g<br />
ash in rice polish. Similarly Ghazi (1992) also who found 17.15 g/100g ash in rice polish. Anjum et al. (2007)<br />
obtained only 5.9 g/100g ash in rice polish.<br />
CONCLUSION<br />
Rice polish is a vital component of the traditional maize soybean based broiler and layer diet. In developing<br />
countries, out of all the crop residues, this is one of the cheapest and largest sources of metabolizable energy as<br />
To cite this paper: Hossain ME, Sultana S., Shahriar SMS, Khatun MM, 2012. Nutritive value of rice polish. Online J. Anim. Feed Res., 2(3): 235-239.<br />
Scienceline/<strong>Journal</strong> homepages: http://www.science-line.com/index/; http://www.ojafr.ir<br />
237