Lesson downloads > IELTS Academic Module ... - Take IELTS
Lesson downloads > IELTS Academic Module ... - Take IELTS
Lesson downloads > IELTS Academic Module ... - Take IELTS
- No tags were found...

Create successful ePaper yourself
Turn your PDF publications into a flip-book with our unique Google optimized e-Paper software.
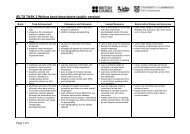
<strong>IELTS</strong> WRITING TASK 1: TABLES<br />
Activity 2 > Understanding Tables > 10 minutes<br />
In <strong>IELTS</strong> Writing Task 1 you may be asked to describe data given in a table. Before you begin<br />
writing, take a few minutes to ‘read’ and understand the table. Think about the following:<br />
• Read the instructions carefully these will tell you what the table shows.<br />
• Does the table have a title? If it does, read it carefully so that you know what the table is<br />
about.<br />
• Is the table static or dynamic? Static tables show data at one point in time; dynamic tables<br />
show how data changes over time. This will affect the language you use in your description.<br />
• What do the columns and rows represent?<br />
• What unit of measurement does each cell represent? Kilometres, euros, litres…??<br />
• Be clear about what the table does not show!<br />
Read this <strong>IELTS</strong> task and then decide whether the statements which follow are true or false or if it is<br />
impossible to tell from the data. Choose T / F or Im<br />
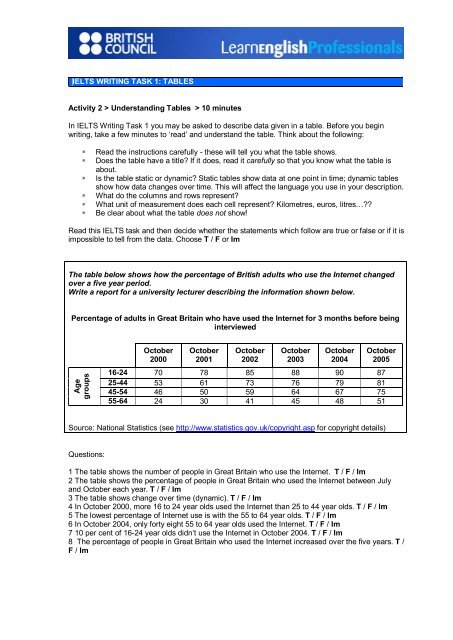
The table below shows how the percentage of British adults who use the Internet changed<br />
over a five year period.<br />
Write a report for a university lecturer describing the information shown below.<br />
Percentage of adults in Great Britain who have used the Internet for 3 months before being<br />
interviewed<br />
Age<br />
groups<br />
October<br />
2000<br />
October<br />
2001<br />
October<br />
2002<br />
October<br />
2003<br />
October<br />
2004<br />
October<br />
2005<br />
1624 70 78 85 88 90 87<br />
2544 53 61 73 76 79 81<br />
4554 46 50 59 64 67 75<br />
5564 24 30 41 45 48 51<br />
Source: National Statistics (see http://www.statistics.gov.uk/copyright.asp for copyright details)<br />
Questions:<br />
1 The table shows the number of people in Great Britain who use the Internet. T / F / Im<br />
2 The table shows the percentage of people in Great Britain who used the Internet between July<br />
and October each year. T / F / Im<br />
3 The table shows change over time (dynamic). T / F / Im<br />
4 In October 2000, more 16 to 24 year olds used the Internet than 25 to 44 year olds. T / F / Im<br />
5 The lowest percentage of Internet use is with the 55 to 64 year olds. T / F / Im<br />
6 In October 2004, only forty eight 55 to 64 year olds used the Internet. T / F / Im<br />
7 10 per cent of 1624 year olds didn’t use the Internet in October 2004. T / F / Im<br />
8 The percentage of people in Great Britain who used the Internet increased over the five years. T /<br />
F / Im