IELTS Writing
Which graph? – Writing Task 1 - Take IELTS - British Council
Which graph? – Writing Task 1 - Take IELTS - British Council
- No tags were found...

You also want an ePaper? Increase the reach of your titles
YUMPU automatically turns print PDFs into web optimized ePapers that Google loves.
<strong>IELTS</strong> <strong>Writing</strong><br />
Which graph? – <strong>Writing</strong> Task 1<br />
Teacher’s notes<br />
Aim: Better able to meet Task Achievement Assessment Criteria (Academic) by selecting<br />
appropriate information from a diagram in order to present an overview which highlights<br />
main trends / key features.<br />
Instructions<br />
1. Hand out graphs 1 – 5 to groups of students (it’s fine if they all have different graphs).<br />
Ask Ss what the graph shows (= percentage of the population of 4 different countries<br />
who travelled abroad from 2002 to 2012. Also elicit that the numbers are in<br />
percentages rather than 15 people or 15 million people).<br />
2. Ss stick their graphs around the walls. Tell Ss there are 5 different graphs and they should<br />
match candidates’ notes about the general trends of the graphs to the actual graphs.<br />
Hand out the worksheet. Ss in pairs go around the room matching the notes to the graphs<br />
(exercise 1). Feed back.<br />
3. Tell Ss they will read an ‘overview’ based on one set of notes. Elicit / explain what an<br />
overview* is in relation to <strong>IELTS</strong> <strong>Writing</strong> Task 1.<br />
Ss read the overview and match to the notes (exercise 2). Feed back.<br />
4. Pairs answer questions about the overview (exercise 3). This will help Ss understand what<br />
kind of information should be included in an overview. Feed back.<br />
5. Ask Ss to turn over their worksheets so they can’t see the notes at exercise 1 and give<br />
them one of the graphs (except graph 1). They should:<br />
Identify key trends from their graph<br />
Write an overview based on what they’ve learnt / read<br />
6. When Ss have finished, they can refer back to the notes (exercise 1) to see if they identified<br />
the same main trends (others are acceptable, but make sure it is a main trend and not a<br />
detail e.g. only 12% of French people took the least holidays abroad in 2006) and check<br />
that they followed the advice in exercise 3.<br />
7. To round up, pairs could swap graphs and overviews and give each other feedback about<br />
how successful they think the overview is.<br />
Alternative suggestion<br />
*At stage 2, if there’s no space to move around the classroom, you could hand one graph to<br />
each group and after 30 - 60 seconds each group passes their graph clockwise to the next<br />
group.<br />
For further practice identifying main trends, give Ss a range of <strong>IELTS</strong> <strong>Writing</strong> Task 1 papers<br />
and ask them to note down the main trends. Feed back as a group to see if everyone identified<br />
similar trends.<br />
*An overview is a summary of the main points / general trends of a diagram. Ss should always include an<br />
overview at the beginning or end of an Academic <strong>Writing</strong> Task 1 answer.<br />
© British Council 2013<br />
www.chinaielts.org
<strong>IELTS</strong> <strong>Writing</strong><br />
ANSWER KEY - Worksheet – Which graph?<br />
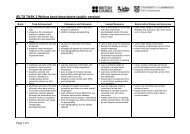
Exercise 1<br />
A = graph 5<br />
B = graph 1<br />
C = graph 2<br />
D = graph 4<br />
E = graph 3<br />
Exercise 2<br />
The overview matches graph 1 (notes B)<br />
Exercise 3<br />
1. Which words / phrases show that these are general trends (instead of details)?<br />
Overall, generally<br />
2. Can you think of any other words / phrases like this?<br />
In general, From an overall perspective<br />
3. Does the candidate give any specific percentages in the overview?<br />
No. The information in the overview should be general. They will write other<br />
paragraphs with more specific details. Numbers or other data should be mentioned<br />
in these.<br />
4. Which words / phrases does the candidate use to refer to ‘(percentage of the population)<br />
who travelled abroad’?<br />
Exercise 4<br />
Foreign travellers, travel(led) abroad, trips abroad. Explain to Ss that they should try<br />
not to repeat phrases from the rubric over and over again in their answer.<br />
Suggested overviews<br />
Graph 2 - Overall, the number of foreign holidays remained fairly stable, except for in Germany<br />
where there was a significant increase over the years. Germans also took far more trips abroad<br />
than any of the other Europeans.<br />
Graph 3 - There was an overall increase in the number of foreign travellers from 2002 to 2012.<br />
Foreign holidays were most popular with citizens of Spain and the UK. French people took the<br />
fewest vacations to other countries over the years.<br />
Graph 4 - From an overall perspective, overseas holidays became less popular from 2002 to 2012,<br />
except for in the UK where there was an increase in foreign holidays. Holidays in other countries<br />
were far less popular with Spanish people than any of the other European countries.<br />
Graph 5 - In general, the number of people who went abroad on holiday increased over the period,<br />
except for in 2006 when all countries took the lowest number of vacations in other countries. The<br />
highest percentage of foreign holidays was taken by Germans.<br />
© British Council 2013<br />
www.chinaielts.org
<strong>IELTS</strong> <strong>Writing</strong><br />
Which graph? – <strong>Writing</strong> Task Part 1<br />
Graph 1<br />
Percentage (%) of population who travelled<br />
abroad on holiday<br />
60<br />
50<br />
40<br />
30<br />
20<br />
10<br />
0<br />
2002 2004 2006 2008 2010 2012<br />
Years<br />
France<br />
Germany<br />
Spain<br />
UK<br />
Graph 2<br />
Percentage (%) of population who travelled<br />
abroad on holiday<br />
70<br />
60<br />
50<br />
40<br />
30<br />
20<br />
10<br />
0<br />
2002 2004 2006 2008 2010 2012<br />
Years<br />
France<br />
Germany<br />
Spain<br />
UK<br />
© British Council 2013<br />
www.chinaielts.org
<strong>IELTS</strong> <strong>Writing</strong><br />
Graph 3<br />
Percentage (%) of population who travelled<br />
abroad on holiday<br />
60<br />
50<br />
40<br />
30<br />
20<br />
10<br />
0<br />
2002 2004 2006 2008 2010 2012<br />
Years<br />
France<br />
Germany<br />
Spain<br />
UK<br />
Graph 4<br />
Percentage (%) of population who travelled<br />
abroad on holiday<br />
70<br />
60<br />
50<br />
40<br />
30<br />
20<br />
10<br />
0<br />
2002 2004 2006 2008 2010 2012<br />
Years<br />
France<br />
Germany<br />
Spain<br />
UK<br />
© British Council 2013<br />
www.chinaielts.org
<strong>IELTS</strong> <strong>Writing</strong><br />
Graph 5<br />
70<br />
Percentage (%) of population who travelled<br />
abroad on holiday<br />
60<br />
50<br />
40<br />
30<br />
20<br />
10<br />
0<br />
2002 2004 2006 2008 2010 2012<br />
France<br />
Germany<br />
Spain<br />
UK<br />
Years<br />
© British Council 2013<br />
www.chinaielts.org
<strong>IELTS</strong> <strong>Writing</strong><br />
Worksheet – Which graph? – <strong>Writing</strong> Task Part 1<br />
1 Below are notes which candidates made about the general trends in graphs 1 – 5.<br />
Match the notes with the graphs.<br />
A<br />
general increase<br />
2006 lowest number in all countries<br />
Germany = highest %<br />
Graph _____<br />
B overall increase from 2002<br />
slight decrease after 2010<br />
similar % from each country in each year (e.g. 2002 all<br />
between 18 and 20%), 2006 biggest differences<br />
Graph _____<br />
C<br />
generally stable<br />
except Germany = big increase<br />
Germans – foreign travel most popular<br />
Graph _____<br />
D general decrease 2002 – 2012<br />
except UK = increase<br />
Spain = small number of hols abroad<br />
E overall increase 2002 – 2012<br />
Spain and UK = hols abroad popular<br />
France least popular<br />
Graph _____<br />
Graph _____<br />
2 A candidate has expanded their notes into an ‘overview’ below. Match the<br />
overview to one of the sets of notes (A – E above).<br />
There was an overall increase in the number of foreign vacations from 2002.<br />
However, trips abroad decreased slightly after 2010. Generally, in each year, a<br />
similar percentage of people from each country took overseas holidays, except for<br />
in 2006 when there was a big difference between France and the UK.<br />
3 Answer the questions about the overview.<br />
1. Which words / phrases show that these are general trends (instead of details)?<br />
………………………………………………………………………………………………………..<br />
2. Can you think of any other words / phrases like this?<br />
………………………………………………………………………………………………………..<br />
3. Does the candidate give any specific percentages in the overview?<br />
………………………………………………………………………………………………………..<br />
4. Which words / phrases does the candidate use to refer to ‘(percentage of the population)<br />
who travelled abroad’?<br />
………………………………………………………………………………………………………..<br />
4 Now turn over this paper and write an overview for a different graph.<br />
© British Council 2013<br />
www.chinaielts.org