Notes to the Consolidated Financial Statements - FirstCaribbean ...
Notes to the Consolidated Financial Statements - FirstCaribbean ...
Notes to the Consolidated Financial Statements - FirstCaribbean ...

Create successful ePaper yourself
Turn your PDF publications into a flip-book with our unique Google optimized e-Paper software.
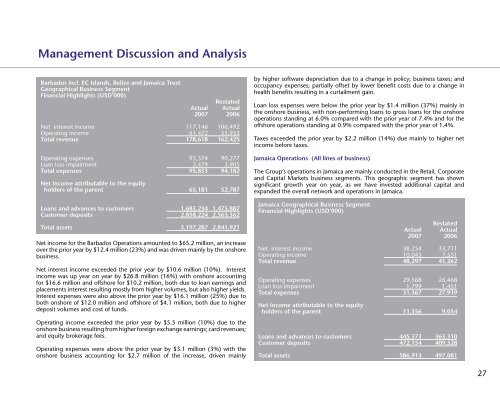
Management Discussion and Analysis<br />
Barbados incl. EC Islands, Belize and Jamaica Trust<br />
Geographical Business Segment<br />
<strong>Financial</strong> Highlights (USD’000)<br />
Restated<br />
Actual Actual<br />
2007 2006<br />
Net interest income 117,146 106,492<br />
Operating income 61,472 55,933<br />
Total revenue 178,618 162,425<br />
Operating expenses 93,374 90,277<br />
Loan loss impairment 2,479 3,905<br />
Total expenses 95,853 94,182<br />
Net income attributable <strong>to</strong> <strong>the</strong> equity<br />
holders of <strong>the</strong> parent 65,181 52,787<br />
Loans and advances <strong>to</strong> cus<strong>to</strong>mers 1,683,234 1,475,887<br />
Cus<strong>to</strong>mer deposits 2,858,224 2,563,362<br />
Total assets 3,197,287 2,841,921<br />
Net income for <strong>the</strong> Barbados Operations amounted <strong>to</strong> $65.2 million, an increase<br />
over <strong>the</strong> prior year by $12.4 million (23%) and was driven mainly by <strong>the</strong> onshore<br />
business.<br />
Net interest income exceeded <strong>the</strong> prior year by $10.6 million (10%). Interest<br />
income was up year on year by $26.8 million (16%) with onshore accounting<br />
for $16.6 million and offshore for $10.2 million, both due <strong>to</strong> loan earnings and<br />
placements interest resulting mostly from higher volumes, but also higher yields.<br />
Interest expenses were also above <strong>the</strong> prior year by $16.1 million (25%) due <strong>to</strong><br />
both onshore of $12.0 million and offshore of $4.1 million, both due <strong>to</strong> higher<br />
deposit volumes and cost of funds.<br />
Operating income exceeded <strong>the</strong> prior year by $5.5 million (10%) due <strong>to</strong> <strong>the</strong><br />
onshore business resulting from higher foreign exchange earnings; card revenues;<br />
and equity brokerage fees.<br />
Operating expenses were above <strong>the</strong> prior year by $3.1 million (3%) with <strong>the</strong><br />
onshore business accounting for $2.7 million of <strong>the</strong> increase, driven mainly<br />
by higher software depreciation due <strong>to</strong> a change in policy; business taxes; and<br />
occupancy expenses; partially offset by lower benefit costs due <strong>to</strong> a change in<br />
health benefits resulting in a curtailment gain.<br />
Loan loss expenses were below <strong>the</strong> prior year by $1.4 million (37%) mainly in<br />
<strong>the</strong> onshore business, with non-performing loans <strong>to</strong> gross loans for <strong>the</strong> onshore<br />
operations standing at 6.0% compared with <strong>the</strong> prior year of 7.4% and for <strong>the</strong><br />
offshore operations standing at 0.9% compared with <strong>the</strong> prior year of 1.4%.<br />
Taxes exceeded <strong>the</strong> prior year by $2.2 million (14%) due mainly <strong>to</strong> higher net<br />
income before taxes.<br />
Jamaica Operations (All lines of business)<br />
The Group’s operations in Jamaica are mainly conducted in <strong>the</strong> Retail, Corporate<br />
and Capital Markets business segments. This geographic segment has shown<br />
significant growth year on year, as we have invested additional capital and<br />
expanded <strong>the</strong> overall network and operations in Jamaica.<br />
Jamaica Geographical Business Segment<br />
<strong>Financial</strong> Highlights (USD’000)<br />
Restated<br />
Actual Actual<br />
2007 2006<br />
Net interest income 38,254 33,711<br />
Operating income 10,043 7,551<br />
Total revenue 48,297 41,262<br />
Operating expenses 29,568 26,468<br />
Loan loss impairment 1,799 1,451<br />
Total expenses 31,367 27,919<br />
Net income attributable <strong>to</strong> <strong>the</strong> equity<br />
holders of <strong>the</strong> parent 11,356 9,054<br />
Loans and advances <strong>to</strong> cus<strong>to</strong>mers 445,373 363,310<br />
Cus<strong>to</strong>mer deposits 472,154 409,528<br />
Total assets 586,913 497,081<br />
27