Water System Master Plan
Water System Master Plan - City of Dover
Water System Master Plan - City of Dover

You also want an ePaper? Increase the reach of your titles
YUMPU automatically turns print PDFs into web optimized ePapers that Google loves.
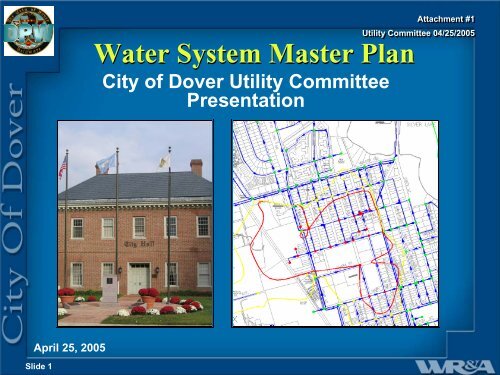
<strong>Water</strong> <strong>System</strong> <strong>Master</strong> <strong>Plan</strong><br />
City of Dover Utility Committee<br />
Presentation<br />
Attachment #1<br />
Utility Committee 04/25/2005<br />
April 25, 2005<br />
Slide 1
<strong>Water</strong> <strong>System</strong> <strong>Master</strong> <strong>Plan</strong><br />
• <strong>System</strong> Mapping and Demands<br />
• Update of Hydraulic Model<br />
• Distribution <strong>System</strong> Summary<br />
• Preliminary Capital Improvement Program –<br />
<strong>Water</strong> Supply, Storage and Distribution<br />
Slide 2
<strong>Water</strong> <strong>System</strong> Mapping<br />
Complete <strong>Water</strong> <strong>System</strong> Update<br />
by City<br />
Map Book Development<br />
Slide 3
<strong>Water</strong> <strong>System</strong> Demands<br />
Billing<br />
Data<br />
GIS<br />
Hydraulic<br />
Modeling<br />
Software<br />
• GIS software acts as a bridge to link textually<br />
based data to spatially based software.<br />
Slide 4
<strong>Water</strong> <strong>System</strong> Demand Distribution<br />
BEFORE<br />
AFTER<br />
Slide 5
<strong>Water</strong> <strong>System</strong> Demand Projections<br />
• <strong>Plan</strong>ned/Projected<br />
Growth<br />
• Annexation<br />
• Service Area<br />
Expansion<br />
• Bulk Customers<br />
• Flat Industrial Growth<br />
Slide 6
<strong>Water</strong> <strong>System</strong> Demand Projections<br />
• 2005 Average Day Demand:<br />
5.7 MGD<br />
• 2025 Average Day Demand:<br />
8.1 MGD<br />
• Maximum Day Factor: 1.7<br />
• 2025 Maximum Day Demand:<br />
10.0<br />
13.7 MGD<br />
9.0<br />
Avg. Day Demand w/Devel<br />
City of Dover <strong>Water</strong> <strong>Master</strong> <strong>Plan</strong><br />
Projected Annual Average Day Demands<br />
8.1 MGD<br />
8.0<br />
<strong>Water</strong> Use (MG)<br />
7.0<br />
6.0<br />
5.0<br />
4.0<br />
2005 2010 2015 2020 2025<br />
Fiscal Year<br />
Slide 7
Update of Hydraulic Model<br />
• Software<br />
– H2ONet (City-Owned,<br />
GIS-Compatible)<br />
• Model<br />
– Re-create model<br />
– Assign demand to<br />
pipe nodes via City<br />
billing record –<br />
County tax map link<br />
• Calibration<br />
– Flow and pressure<br />
testing<br />
– Compare system<br />
performance vs.<br />
model<br />
Slide 8
Distribution <strong>System</strong> Summary<br />
Pipe Size – <strong>Water</strong> Model<br />
Slide 9
Distribution <strong>System</strong> Summary<br />
Pipe Size<br />
Pipe Diameter Pipe Length (miles) Percent<br />
4" 11.34 6.44%<br />
6" 42.29 24.01%<br />
8" 59.09 33.55%<br />
10" 24.81 14.08%<br />
12" 32.41 18.40%<br />
14" 2.45 1.39%<br />
16" 3.67 2.08%<br />
20" 0.07 0.04%<br />
Total 176.13 100.00%<br />
12"<br />
14"<br />
16"<br />
20"<br />
4"<br />
6"<br />
10"<br />
8"<br />
Slide 10
Distribution <strong>System</strong> Summary<br />
Pipe Material<br />
Pipe Material Pipe Length (miles) Percent<br />
ACP 2.81 1.59%<br />
CIP 92.97 52.78%<br />
DIP 70.71 40.15%<br />
HDPE 0.13 0.07%<br />
PVC 9.52 5.40%<br />
Total 176.13 100.00%<br />
HDPE<br />
PVC<br />
ACP<br />
DIP<br />
CIP<br />
Slide 11
Distribution <strong>System</strong> Summary<br />
Pipe Material – Cast Iron Pipe<br />
Slide 12
Preliminary CIP - <strong>Water</strong> Supply<br />
• Maximum Day Demand<br />
• Permitted Daily Capacities:<br />
City of Dover <strong>Water</strong> <strong>Master</strong> <strong>Plan</strong><br />
Projected Maximum Day Demands<br />
- Deep Well: 11.96 MGD<br />
- WTP: 4.68 MGD<br />
16.0<br />
15.0<br />
14.0<br />
13.7 MGD<br />
• Actual Production<br />
Capacity: 13.15 MGD<br />
• Total Safe Production<br />
Capacity: 10.64 MGD<br />
<strong>Water</strong> Use (MG)<br />
13.0<br />
12.0<br />
11.0<br />
10.0<br />
9.0<br />
8.0<br />
7.0<br />
1 MGD<br />
Safe Production Capacity<br />
Max. Day Demand w/Devel.<br />
6.0<br />
2005 2010 2015 2020 2025<br />
Fiscal Year<br />
Slide 13
Preliminary CIP - <strong>Water</strong> Storage<br />
Capacity / Storage<br />
Needs:<br />
Equalization:<br />
- 0.15 * max day<br />
Fire Flow:<br />
- 5,000 gpm for 4 hours<br />
Emergency:<br />
- 0.10 * max day<br />
<strong>Water</strong> Storage Requirement (Million Gallons)<br />
Million Gallons<br />
5.00<br />
4.50<br />
4.00<br />
3.50<br />
3.00<br />
2.50<br />
2.00<br />
Storage Required<br />
Storage Required<br />
2005 2010 2015 2020 2025<br />
Year<br />
Current Storage<br />
Slide 14<br />
Year<br />
Avg. Day<br />
Demand<br />
w/Devel<br />
Max. Day<br />
Demand<br />
w/Devel.<br />
Equaliz:<br />
15% of<br />
Max.<br />
Day<br />
Fire Flow:<br />
5,000 gpm<br />
for 4 Hours<br />
Emerg:<br />
10% of<br />
Max. Day<br />
Storage<br />
Required<br />
2005 5.65 9.61 1.44 1.2 0.96 3.60<br />
2010 6.65 11.31 1.70 1.2 1.13 4.03<br />
2015 7.22 12.27 1.84 1.2 1.23 4.27<br />
2020 7.84 13.32 2.00 1.2 1.33 4.53<br />
2025 8.07 13.72 2.06 1.2 1.37 4.63
Slide 15<br />
Preliminary CIP - Distribution
Preliminary Capital<br />
Improvement Program<br />
Distribution<br />
$19.7 M<br />
Supply/Treatment<br />
$2.8 M<br />
Storage<br />
$4.0 M<br />
Total<br />
$26.2 M<br />
$0.0 M $5.0 M $10.0 M $15.0 M $20.0 M $25.0 M $30.0 M<br />
Cost ( in million dollars)<br />
Slide 16