The Art of Day-Trading: Table of Contents
The Art of Day-Trading: Table of Contents
The Art of Day-Trading: Table of Contents

Create successful ePaper yourself
Turn your PDF publications into a flip-book with our unique Google optimized e-Paper software.
How to find the right support and resistance<br />
How to find the right<br />
support and resistance<br />
My personal preference for day-trading and short-term trading is to<br />
buy dips and sell rallies.<br />
Two components are needed to make this strategy work. First, you<br />
have to be trading in the direction that gives you the best chance <strong>of</strong><br />
success. Second, you have to be able to identify potential support or<br />
resistance for that trading day. I'll discuss one technique from each<br />
<strong>of</strong> these two components that make up my day-trading approach.<br />
<strong>The</strong> first step is to determine which way the market is likely to go today -- in other words,<br />
is the trend up, down or sideways?<br />
One method to determine the market trend involves a couple <strong>of</strong> old standby technical<br />
indicators that are available on virtually any charting s<strong>of</strong>tware: the Moving Average<br />
Convergence Divergence (MACD) and the stochastic indicators. <strong>The</strong>se oldies but goodies<br />
really can be useful if used in the proper combination.<br />
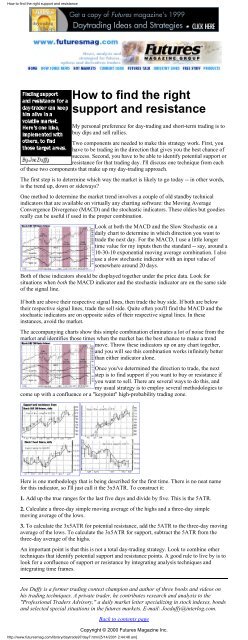
Look at both the MACD and the Slow Stochastic on a<br />
daily chart to determine in which direction you want to<br />
trade the next day. For the MACD, I use a little longer<br />
time value for my inputs then the standard -- say, around a<br />
10-30-10 exponential moving average combination. I also<br />
use a slow stochastic indicator with an input value <strong>of</strong><br />
somewhere around 20 days.<br />
Both <strong>of</strong> these indicators should be displayed together under the price data. Look for<br />
situations when both the MACD indicator and the stochastic indicator are on the same side<br />
<strong>of</strong> the signal line.<br />
If both are above their respective signal lines, then trade the buy side. If both are below<br />
their respective signal lines, trade the sell side. Quite <strong>of</strong>ten you'll find the MACD and the<br />
stochastic indicators are on opposite sides <strong>of</strong> their respective signal lines. In these<br />
instances, avoid the market.<br />
<strong>The</strong> accompanying charts show this simple combination eliminates a lot <strong>of</strong> noise from the<br />
market and identifies those times when the market has the best chance to make a trend<br />
move. Throw these indicators up on any chart together,<br />
and you will see this combination works infinitely better<br />
than either indicator alone.<br />
Once you've determined the direction to trade, the next<br />
step is to find support if you want to buy or resistance if<br />
you want to sell. <strong>The</strong>re are several ways to do this, and<br />
my usual strategy is to employ several methodologies to<br />
come up with a confluence or a "keypoint" high-probability trading zone.<br />
Here is one methodology that is being described for the first time. <strong>The</strong>re is no neat name<br />
for this indicator, so I'll just call it the 3x5ATR. To construct it:<br />
1. Add up the true ranges for the last five days and divide by five. This is the 5ATR.<br />
2. Calculate a three-day simple moving average <strong>of</strong> the highs and a three-day simple<br />
moving average <strong>of</strong> the lows.<br />
3. To calculate the 3x5ATR for potential resistance, add the 5ATR to the three-day moving<br />
average <strong>of</strong> the lows. To calculate the 3x5ATR for support, subtract the 5ATR from the<br />
three-day average <strong>of</strong> the highs.<br />
An important point is that this is not a total day-trading strategy. Look to combine other<br />
techniques that identify potential support and resistance points. A good rule to live by is to<br />
look for a confluence <strong>of</strong> support or resistance by integrating analysis techniques and<br />
integrating time frames.<br />
Joe Duffy is a former trading contest champion and author <strong>of</strong> three books and videos on<br />
his trading techniques. A private trader, he contributes research and analysis to the<br />
"Pr<strong>of</strong>essional Traders Advisory," a daily market letter specializing in stock indexes, bonds<br />
and selected special situations in the futures markets. E-mail: Joeduffy@interlog.com.<br />
Back to contents page<br />
Copyright © 2000 Futures Magazine Inc.<br />
http://www.futuresmag.com/library/daytrade97/day7.html [5/14/2001 2:44:48 am]