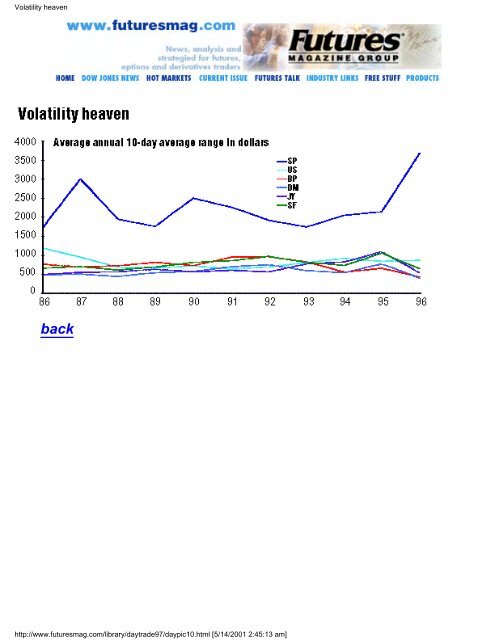
S&P day-trading systems:What works and what doesn't S&P day-trading systems:What works and what doesn't Of all the day-trading systems I've tested over the years, 90% <strong>of</strong> them trade the S&P 500. This is the market <strong>of</strong> choice for most day-traders because it affords enough potential to make it a worthwhile venture (see "Volatility heaven," below). By definition, day-trading means you exit at the end <strong>of</strong> the day, so your pr<strong>of</strong>its must at least cover your commissions and slippage. Although a key difference with the S&P systems I've tested is their approach to entering the market -- they have ranged from basic breakout systems to systems based on the phases <strong>of</strong> the moon -- the exit signals usually fall into four categories: protective stop, pr<strong>of</strong>it target, trailing stop and, <strong>of</strong> course, market on close. Many <strong>of</strong> the systems use a combination <strong>of</strong> these exits. Because the exit technique is as much or more important than the entry in day-trading the S&P 500, I'll demonstrate that different types <strong>of</strong> exits work with various types <strong>of</strong> systems. Over the past eight years I've <strong>of</strong>ten been asked which exit technique is the best. <strong>The</strong> answer is it depends on the system; there is no black or white answer. However, through research, I've found the success <strong>of</strong> these exit techniques usually depends upon the frequency <strong>of</strong> trades a system generates: More frequent trading systems need tighter exits whereas less frequent trading systems need looser exits. Volatility heaven To demonstrate the success or failure <strong>of</strong> protective stops, pr<strong>of</strong>it targets and trailing stops, I've created two systems and tested them over the past 11 years. <strong>The</strong>se systems use basically the same entry technique, except one trades about five times as much as the other. Buy and sell signals are calculated by adding/subtracting a certain percentage <strong>of</strong> the 10-day-average range to yesterday's close. In addition, today's range must be less than the 10-day-average range before a buy/sell signal can be placed. <strong>The</strong> only difference in the two systems is the percentage used to calculate the buy/sell signals. System A uses 50% and System B uses 120%. <strong>The</strong>se percentages were determined by the frequency <strong>of</strong> trades I was trying to attain. <strong>The</strong> systems were tested using five-minute bar data and deducting $100 commission/ slippage per trade. I ran three tests on each system, optimizing different dollar levels for each exit technique. None <strong>of</strong> the test results <strong>of</strong> these two systems includes any trades that took place during October 1987 and October 1989. Due to extremely high market volatility, these two time periods can skew performance data. Protective stop If a system has a high frequency <strong>of</strong> trades, tight stops usually work best. My definition <strong>of</strong> a tight stop is anywhere between $300 and $750. Systems that trade frequently are trying to make money almost on a daily basis. If the system takes a small loss, then there is always tomorrow; why take a major loss when you know a trade probably will be generated tomorrow? System A (see "Protective stop comparison," right) shows the performance <strong>of</strong> the system using several different protective stop levels. Notice that too tight <strong>of</strong> a stop also degrades performance. A protective stop, at the right level, can turn a losing system into a winner. A system that trades less frequently usually will need a larger stop. Unlike faster approaches, these systems are in the market for considerably less time and therefore need to make more money per trade. A larger stop prevents a premature loss due to market volatility. System B shows the performance <strong>of</strong> the slower system using different protective stop levels. As you can see, a larger stop is needed in this case. Pr<strong>of</strong>it targets Pure pr<strong>of</strong>it targets generally don't work. A good portion <strong>of</strong> the pr<strong>of</strong>it that is generated by an S&P day-trading system comes from those days when the S&P takes <strong>of</strong>f and keeps going in the same direction. If you limit these potential high-pr<strong>of</strong>it days, then you limit the overall pr<strong>of</strong>it <strong>of</strong> your system. System A (see "Variation in pr<strong>of</strong>it targets," right) shows terrible performance using tighter pr<strong>of</strong>it targets. Due to its frequency <strong>of</strong> trades, the risk reward ratio is out <strong>of</strong> whack. Are you willing to risk trading the S&P 500 on a daily basis in hopes <strong>of</strong> a $250 win? System B also shows degraded performance by using tight pr<strong>of</strong>it targets. This system trades so infrequently, it almost has to hit a home run on every trade. Trailing stops A trailing stop is a combination <strong>of</strong> a protective stop and pr<strong>of</strong>it target. This type <strong>of</strong> stop gives the market room to breath but at the same time tries to lock in pr<strong>of</strong>it. In this analysis, I trailed the high/low <strong>of</strong> the day by x-amount after a trade was initiated. <strong>The</strong> trailing stop did not help System A (see "Hitting the trailing stops," below, left) as much as the fixed protective stop. <strong>The</strong> pr<strong>of</strong>it target aspect <strong>of</strong> the trailing stop was too limiting on the big pr<strong>of</strong>it days. Nonetheless, the trailing stop turned a losing system into a winner. System B showed a slight increase in performance at the high end <strong>of</strong> the trailing stop. This re-emphasizes the need for a large protective stop and large pr<strong>of</strong>it target. All tests were done using static stop amounts. In today's market, $500 is totally different than it was in 1986. I have found, in almost all cases, that self-adjusting parameters create a much more robust system. An alternative to static dollar stops, would be to use volatility-based, self-adjusting stops. For example, instead <strong>of</strong> $500 fixed stop, use 10% <strong>of</strong> the past 10-day average range. This market-defined stop would change with market conditions. <strong>The</strong>re is no black or white answer to which type <strong>of</strong> stop is the best to use in a day-trading system. <strong>The</strong> results shown are consistent with my research; however, it is not a guarantee that all systems will follow suit. A large portion <strong>of</strong> S&P day-trading systems use a combination <strong>of</strong> these exits. I have seen systems that will use a protective stop early in the day and a trailing stop later in the afternoon. Whichever stop you pick, it should be based on thorough research. <strong>The</strong> longer time frame over which you can test, the more robust your parameter selection will be. We are fortunate to have so much intraday data at our disposal, yet at the same time the data is somewhat skewed. We basically have been in a bull market ever since the S&P 500 futures contract has been traded. Close to 100% <strong>of</strong> the symmetrical S&P day-trading systems (buy/sell signals are mirror images <strong>of</strong> each other) have shown much more pr<strong>of</strong>it on the long side. With this fact, the question "Why short the S&P?" always arises. And <strong>of</strong> course the answer always is: "Who knows when a major retracement or bear market is going to occur." <strong>The</strong> second question is: "Is it okay for a system to have a bullish bias?" In other words, should a system try to buy more <strong>of</strong>ten than it sells? Again, there really is no correct answer. <strong>The</strong>re won't be good answer until we have a good sample <strong>of</strong> bear market data on which to test. Let's look at some before and after performance numbers on System A and System B (see "Before and after," right). System A, without an exit, was a big loser. However, with a simple $500 protective stop, the system turns into a winner. System B was a mediocre winner without any type <strong>of</strong> stop, but with a $1,250 protective stop and a $3,000 pr<strong>of</strong>it target, the system's overall drawdown decreased by about 60%. Notice the pr<strong>of</strong>it/loss that came from the long and short positions. <strong>The</strong> changes we made look great, but I must warn you about curve fitting, which is when you historically back test to derive a parameter. Don't fool yourself into thinking you've found the holy grail, when in fact you had your 166 MHz computer run two weeks optimizing six parameters. You don't want history to have to repeat itself exactly for your system to make money. Never test the S&P with less than $100 commission/slippage; in fact real-time analysis has shown slippage to be well over $100. A system tested at $50 commission/slippage looks totally different than one tested at $100. <strong>The</strong> lack-luster performance <strong>of</strong> System A and System B may lead you to believe that day-trading the S&P 500 is not your cup <strong>of</strong> tea. I derived these systems for demonstration purposes only and didn't strive to make them pr<strong>of</strong>itable. Futures Truth monitors about 20 S&P day-trading systems, and about nine <strong>of</strong> them have shown a pr<strong>of</strong>it since they were released to the public (see "Top S&P day-trading systems," above). <strong>The</strong> best two systems, R-Breaker and R-Levels by Richard Saidenberg, have shown real-time performance similar to hypothetical performance (see "Top performers," below, left). <strong>The</strong>se systems were released to the public in July 1993. <strong>The</strong> equity curve after this date looks as good as the equity curve before. <strong>The</strong>se systems have been successful because <strong>of</strong> Saidenberg's countertrend approach to entry and his exit mechanisms. He incorporates a combination <strong>of</strong> the exit techniques discussed here. His two systems took advantage <strong>of</strong> the heightened volatility in 1996. In the 1980s, any simple breakout approach seemed to work in the S&P. But during the 1990s, other types <strong>of</strong> entry and exit techniques have excelled. Because no system wins all the time, exit techniques provide a form <strong>of</strong> insurance when the system is wrong. As with all trading, risk should be measured and taken into consideration before placing an order. Don't arbitrarily place some type <strong>of</strong> exit technique without knowing the mentality <strong>of</strong> the system. I've been told that 40% <strong>of</strong> research should be spent on the system and 60% should be spent on money management. In day-trading, your exit is your money management. George Pruitt is director <strong>of</strong> research <strong>of</strong> the independent system testing firm, Futures Truth Inc., in Hendersonville, N.C., which publishes a monthly review <strong>of</strong> the systems it tests. A top-10 system performance list can be found in Futures on a bi-monthly basis. Back to contents page Copyright © 2000 Futures Magazine Inc. http://www.futuresmag.com/library/daytrade97/day8.html [5/14/2001 2:45:09 am]
Volatility heaven back http://www.futuresmag.com/library/daytrade97/daypic10.html [5/14/2001 2:45:13 am]