HR DEPARTMENT BENCHMARKS AND ANALYSIS
a free sample! - Bloomberg BNA
a free sample! - Bloomberg BNA

Create successful ePaper yourself
Turn your PDF publications into a flip-book with our unique Google optimized e-Paper software.
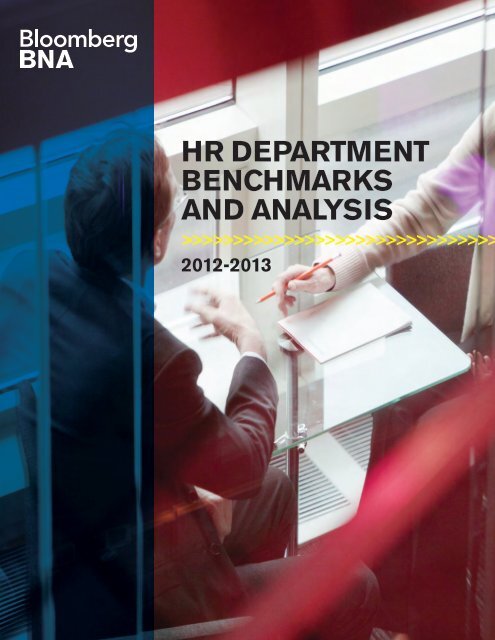
<strong>HR</strong> <strong>DEPARTMENT</strong><br />
<strong>BENCHMARKS</strong><br />
<strong>AND</strong> <strong>ANALYSIS</strong><br />
>>>>>>>>>>>>>>>>>>>>>>>>>>>>>>><br />
2012-2013
s Table of Contents<br />
Acknowledgements ..............................................................................................<br />
About the Authors ...............................................................................................<br />
Executive Summary .............................................................................................<br />
x<br />
xi<br />
xii<br />
Introduction: Guide to Using This Report<br />
Overview ......................................................................................................... 3<br />
Frequently-Used Terms ..................................................................................... 5<br />
Design, Methodology, and Presentation ............................................................ 7<br />
Profile of Participating Organizations ............................................................... 9<br />
Chapter 1: <strong>HR</strong> Department Staffing<br />
Overview ......................................................................................................... 13<br />
Highlights ........................................................................................................ 14<br />
How It’s Measured: The <strong>HR</strong> Staff Ratio ......................................................... 16<br />
How It’s Presented: <strong>HR</strong> Staff Ratios in Charts and Tables ............................. 18<br />
<strong>HR</strong> Staff Ratios: Trends and Analysis ................................................................ 19<br />
Staff Composition of the <strong>HR</strong> Department .......................................................... 25<br />
Specialists in Human Resources ....................................................................... 27<br />
Contingent Workers and Human Resources ...................................................... 30<br />
Perspectives on Challenges and Obstacles in Hiring Contingent<br />
Employees ................................................................................................ 32<br />
<strong>HR</strong> Activity Loads ............................................................................................ 34<br />
How It’s Measured: <strong>HR</strong> Activity Load Scale ................................................... 35<br />
Trends in <strong>HR</strong> Staff Levels: Cuts vs. Increases ................................................... 36<br />
Chapter 2: <strong>HR</strong> Expenditures and Budgets<br />
Overview ......................................................................................................... 41<br />
Highlights ........................................................................................................ 42<br />
How It’s Measured: <strong>HR</strong> Expenditures and Budgets ........................................ 44<br />
How It’s Presented: <strong>HR</strong> Costs per Capita in Charts and Tables ...................... 46<br />
<strong>HR</strong> Expenditures per Employee ......................................................................... 47<br />
2012 The Bureau of National Affairs, Inc. • Arlington, Virginia<br />
iii
<strong>HR</strong> Department Benchmarks and Analysis 2012-2013<br />
Budgeted Changes in <strong>HR</strong> Expenditures ............................................................. 52<br />
How It’s Measured: <strong>HR</strong> Budgets as a Percentage of Operating Costs ............. 54<br />
<strong>HR</strong> Budgets and Total Operating Costs ............................................................. 55<br />
Benchmarking <strong>HR</strong> Expenditures: Factors to Consider .................................... 59<br />
How It’s Measured: <strong>HR</strong> Salaries as a Percentage of Payroll<br />
(<strong>HR</strong> Salary Ratio) ..................................................................................... 60<br />
<strong>HR</strong> Salaries and Total Payroll Costs .................................................................. 61<br />
<strong>HR</strong> Staff Salaries ............................................................................................. 64<br />
Chapter 3: <strong>HR</strong> Measurement and Strategic Planning<br />
Overview ......................................................................................................... 67<br />
Highlights ........................................................................................................ 68<br />
Degree of Measurement and Planning in Key <strong>HR</strong> Areas ..................................... 69<br />
Perspectives on <strong>HR</strong>’s Use of Metrics ............................................................ 74<br />
<strong>HR</strong> Measurement and Planning Scale ............................................................... 76<br />
Top <strong>HR</strong> Priorities .............................................................................................. 78<br />
<strong>HR</strong> Involvement in Key Decisions ...................................................................... 82<br />
Perspectives on <strong>HR</strong>’s Role and Influence in Strategic Planning ...................... 86<br />
Chapter 4: <strong>HR</strong> Activities<br />
Overview ......................................................................................................... 91<br />
Highlights ........................................................................................................ 92<br />
Changes in <strong>HR</strong> Responsibilities ........................................................................ 94<br />
Employment and Recruiting ............................................................................. 96<br />
Strategic Planning ........................................................................................... 99<br />
Training and Development ................................................................................ 102<br />
Compensation .................................................................................................. 105<br />
Benefits .......................................................................................................... 108<br />
Employee Services .......................................................................................... 111<br />
Employee Relations ......................................................................................... 113<br />
External Relations ........................................................................................... 116<br />
Personnel/<strong>HR</strong> Records .................................................................................... 118<br />
Health and Safety ............................................................................................ 120<br />
iv<br />
2012 The Bureau of National Affairs, Inc. • Arlington, Virginia
Chapter 5: <strong>HR</strong> Outsourcing<br />
Overview ......................................................................................................... 125<br />
Highlights ........................................................................................................ 126<br />
Extent of Outsourcing ...................................................................................... 127<br />
The Outsourcing Decision ................................................................................ 133<br />
Outsourcing Outcomes ..................................................................................... 136<br />
Outsourcing Obstacles and Prospects .............................................................. 139<br />
2012 The Bureau of National Affairs, Inc. • Arlington, Virginia<br />
v
<strong>HR</strong> Department Benchmarks and Analysis 2012-2013<br />
s List of Figures<br />
Chapter 1—<strong>HR</strong> Department Staffing<br />
Figure 1-1—<strong>HR</strong> Staff Ratios: 2002-2012 .......................................................... 19<br />
Figure 1-2a—<strong>HR</strong> Staff Ratios for 2012 by Workforce Size ................................. 21<br />
Figure 1-2b—<strong>HR</strong> Staff Ratios for 2012 by Workforce Size ................................. 21<br />
Figure 1-3a—<strong>HR</strong> Staff Ratios for 2012 by Industry ........................................... 23<br />
Figure 1-3b—<strong>HR</strong> Staff Ratios for 2012 by Industry ........................................... 24<br />
Figure 1-4—Composition of <strong>HR</strong> Department Staff ............................................. 25<br />
Figure 1-5—<strong>HR</strong> Staff Composition by Workforce Size ........................................ 26<br />
Figure 1-6—Prevalence of Human Resource Specialists by Workforce<br />
Size .............................................................................................................. 27<br />
Figure 1-7—Prevalence of Human Resource Specialists by Area ........................ 29<br />
Figure 1-8—<strong>HR</strong>’s Role in Hiring Contingent Workers ......................................... 30<br />
Figure 1-9—Median <strong>HR</strong> Staff Ratios by <strong>HR</strong>’s Role in Hiring Contingent<br />
Workers........................................................................................................ 31<br />
Figure 1-10—<strong>HR</strong> Activity Load Scale ................................................................ 34<br />
Figure 1-11—Median <strong>HR</strong> Staff Ratios by Activity Load ...................................... 35<br />
Figure 1-12—Changes in <strong>HR</strong> Staff Levels: 2011-2012 ....................................... 36<br />
Figure 1-13—Changes in <strong>HR</strong> Staff Levels: 2000-2012 ....................................... 37<br />
Chapter 2—<strong>HR</strong> Expenditures and Budgets<br />
Figure 2-1a—Per Capita <strong>HR</strong> Expenditures Budgeted for 2012<br />
by Workforce Size ......................................................................................... 48<br />
Figure 2-1b—Per Capita <strong>HR</strong> Expenditures Budgeted for 2012<br />
by Workforce Size ......................................................................................... 48<br />
Figure 2-2a—Per Capita <strong>HR</strong> Expenditures Budgeted for 2012<br />
by Industry ................................................................................................... 50<br />
Figure 2-2b—Per Capita <strong>HR</strong> Expenditures Budgeted for 2012<br />
by Industry ................................................................................................... 51<br />
Figure 2-3—Median Budgeted Changes in Total <strong>HR</strong> Expenditures:<br />
2001-2012 ................................................................................................... 52<br />
Figure 2-4—Budgeted Changes in Total <strong>HR</strong> Expenditures: 2010 versus<br />
2012 ............................................................................................................ 53<br />
vi<br />
2012 The Bureau of National Affairs, Inc. • Arlington, Virginia
Figure 2-5—Budgeted Changes in Total <strong>HR</strong> Expenditures: 2010 versus<br />
2012 ............................................................................................................ 53<br />
Figure 2-6—<strong>HR</strong> Budget as a Percentage of Total Operating Costs:<br />
2001-2012 ................................................................................................... 55<br />
Figure 2-7a—<strong>HR</strong> Budget as a Percentage of Total Operating Costs by<br />
Workforce Size ............................................................................................. 56<br />
Figure 2-7b—<strong>HR</strong> Budget as a Percentage of Total Operating Costs by<br />
Workforce Size ............................................................................................. 57<br />
Figure 2-8—<strong>HR</strong> Budget as a Percentage of Total Operating Costs by<br />
Industry........................................................................................................ 58<br />
Figure 2-9—<strong>HR</strong> Salary Ratio versus <strong>HR</strong> Staff Ratio: 2001-2012 ........................ 61<br />
Figure 2-10—<strong>HR</strong> Staff Salaries as Percentage of Total Salaries by Workforce<br />
Size ..................................................................................................... 62<br />
Figure 2-11—<strong>HR</strong> Department Salaries as Percentage of Total Organization<br />
Payroll by Industry (2012)...................................................................... 63<br />
Figure 2-12—Median Budgeted Change in <strong>HR</strong> Staff Salaries:<br />
2001-2012 ................................................................................................... 64<br />
Chapter 3—<strong>HR</strong> Measurement and Strategic Planning<br />
Figure 3-1—Frequency of <strong>HR</strong> Measurement and Planning .................................. 71<br />
Figure 3-2—Frequency of <strong>HR</strong> Measurement and Planning<br />
by Workforce Size ......................................................................................... 73<br />
Figure 3-3—<strong>HR</strong> Measurement and Planning Scale ............................................. 76<br />
Figure 3-4—Number of Areas That <strong>HR</strong> Measures by Workforce Size ................... 77<br />
Figure 3-5—<strong>HR</strong> Priorities for 2012 ................................................................... 79<br />
Figure 3-6—<strong>HR</strong> Priorities for 2012 by Workforce Size ....................................... 81<br />
Figure 3-7—Reporting Relationships of <strong>HR</strong> Executives ...................................... 82<br />
Figure 3-8—Strategic Involvement of <strong>HR</strong> Within Organization ............................ 83<br />
Figure 3-9—<strong>HR</strong> Strategic Involvement by Reporting Relationship ..................... 84<br />
Figure 3-10—<strong>HR</strong> Strategic Involvement by Number of <strong>HR</strong> Measurement<br />
and Planning Activities.................................................................................. 85<br />
Chapter 4—<strong>HR</strong> Activities<br />
Figure 4-1— Changes in <strong>HR</strong> Responsibilities Within the Past Year ..................... 94<br />
Figure 4-2—Changes in <strong>HR</strong> Responsibilities: 2002-2012 ................................... 95<br />
2012 The Bureau of National Affairs, Inc. • Arlington, Virginia<br />
vii
<strong>HR</strong> Department Benchmarks and Analysis 2012-2013<br />
Figure 4-3—Employment and Recruiting - Who Handles It? ............................... 97<br />
Figure 4-4—Employment and Recruiting by Workforce Size .............................. 98<br />
Figure 4-5—Strategic Planning - Who Handles It? ............................................. 99<br />
Figure 4-6—Strategic Planning by Workforce Size ............................................ 101<br />
Figure 4-7—Training and Development - Who Handles It? .................................. 103<br />
Figure 4-8—Training and Development by Workforce Size .................................. 104<br />
Figure 4-9—Compensation - Who Handles It? ................................................... 105<br />
Figure 4-10—Compensation by Workforce Size ................................................. 107<br />
Figure 4-11—Benefits - Who Handles It? .......................................................... 109<br />
Figure 4-12—Benefits by Workforce Size .......................................................... 110<br />
Figure 4-13—Employee Services - Who Handles It? .......................................... 111<br />
Figure 4-14—Employee Services by Workforce Size .......................................... 112<br />
Figure 4-15—Employee Relations - Who Handles It? ......................................... 113<br />
Figure 4-16—Employee Relations by Workforce Size ......................................... 115<br />
Figure 4-17—External Relations - Who Handles It? ........................................... 116<br />
Figure 4-18—External Relations by Workforce Size ........................................... 117<br />
Figure 4-19—Personnel/<strong>HR</strong> Records - Who Handles It? .................................... 118<br />
Figure 4-20—Personnel/<strong>HR</strong> Records by Workforce Size .................................... 119<br />
Figure 4-21—Health and Safety - Who Handles It? ............................................ 120<br />
Figure 4-22—Health and Safety by Workforce Size ............................................ 121<br />
Chapter 5—<strong>HR</strong> Outsourcing<br />
Figure 5-1—Prevalence of <strong>HR</strong> Outsourcing: 2002 – 2012 .................................. 127<br />
Figure 5-2—Prevalence of <strong>HR</strong> Outsourcing by Industry Sector ........................... 129<br />
Figure 5-3—Most Prevalent Outsourced <strong>HR</strong> Activities ....................................... 130<br />
Figure 5-4—<strong>HR</strong> Outsourcing Prevalence by Workforce Size ............................... 131<br />
Figure 5-5—Most Prevalent Outsourced <strong>HR</strong> Activities, by Workforce<br />
Size .............................................................................................................. 132<br />
Figure 5-6—Who Initiated the Outsourcing Decision? ........................................ 133<br />
Figure 5-7—Top Factors in Choice of Outsourcing Provider ................................ 135<br />
Figure 5-8—Did Outsourcing Initiative Coincide with <strong>HR</strong> Staff Cuts? ................. 136<br />
Figure 5-9—Does <strong>HR</strong> Oversee the Relationship with the Vendor? ....................... 137<br />
Figure 5-10—Results of Outsourcing in Key Areas ............................................ 138<br />
viii<br />
2012 The Bureau of National Affairs, Inc. • Arlington, Virginia
Figure 5-11—Outsourced <strong>HR</strong> Activity Ever Brought Back in House? .................. 139<br />
Figure 5-12—Why Doesn’t the <strong>HR</strong> Department Outsource? ............................... 140<br />
Figure 5-13—New Outsourcing of <strong>HR</strong> Function(s) in Next 12 Months? .............. 141<br />
2012 The Bureau of National Affairs, Inc. • Arlington, Virginia<br />
ix
Introduction: Guide to Using this Report<br />
s Overview<br />
Technological advancements, the social media age, global financial instability, and<br />
a weak economic recovery have ramped up the uncertainties and challenges faced<br />
by employers. Companies that have thrived for decades are closing their doors,<br />
while new enterprises and products are creating and transforming markets.<br />
Moreover, a generational transition looms; as baby boomers reach retirement age,<br />
Generation X and Y will soon dominate the working population. Already, this next<br />
generation of employees is making their voices heard, with different expectations<br />
of their jobs and their employers.<br />
Human resource professionals and departments are right in the middle of it all, of<br />
course; virtually every workforce transition, economic development, and<br />
technological innovation has implications for the human resources function. Every<br />
<strong>HR</strong> department responsibility—employment, training, compensation, benefits,<br />
etc.—grows more sprawling and complex with each passing year.<br />
<strong>HR</strong> Department Benchmarks and Analysis 2012-2013 provides a comprehensive<br />
overview of the state of human resources—responsibilities and challenges, staffs<br />
and budgets, metrics and planning, historical, current, and projected. The<br />
statistics, analyses, and perspectives contained in this report provide tools through<br />
which <strong>HR</strong> professionals can examine their own departments’ resources, influence,<br />
duties, and performance, as well as compare their staffs, budgets, and<br />
responsibilities with those of other <strong>HR</strong> offices throughout the U.S.<br />
More specifically, the metrics and analyses in <strong>HR</strong> Department Benchmarks and<br />
Analysis 2012-2013 can help inform decisions and shed light on issues and<br />
inquiries such as:<br />
s What are ‘‘typical’’ or ‘‘normal’’ levels of funding and staff in human resources?<br />
How do those metrics vary by industrial classification or workforce<br />
size?<br />
s What levels of funding growth have <strong>HR</strong> departments seen over the past<br />
several years?<br />
s What is a typical duty roster for an <strong>HR</strong> department? Does it include payroll?<br />
Public relations?<br />
s Which activities and programs are most likely to be outsourced? What functions<br />
are usually kept in-house? Is outsourcing usually successful? How often<br />
are outsourced activities brought back inside <strong>HR</strong>?<br />
2012 The Bureau of National Affairs, Inc. • Arlington, Virginia 3
<strong>HR</strong> Department Benchmarks and Analysis 2012-2013<br />
s Does the head of <strong>HR</strong> typically report to the CEO or a mid-level VP? How<br />
involved is human resources in strategic planning and corporate decisions?<br />
The remaining sections of this chapter summarize frequently-used terms, study<br />
design and research methodology, and the demographic characteristics of<br />
participating employers.<br />
4 2012 The Bureau of National Affairs, Inc. • Arlington, Virginia
<strong>HR</strong> Department Benchmarks and Analysis 2012-2013<br />
s Executive Summary<br />
For nearly three decades, Bloomberg BNA has published its comprehensive<br />
annual report on the state of human resources function, <strong>HR</strong> Department<br />
Benchmarks and Analysis. The report has long been a widely-referenced,<br />
authoritative source of research and analysis on <strong>HR</strong> department responsibilities,<br />
staffing, expenditures and budgets, measurement and strategic planning, and<br />
outsourcing. Throughout the survey’s history, the questionnaire and report have<br />
undergone near-constant enhancement and refinement.<br />
In keeping with that tradition of continuing improvement, <strong>HR</strong> Department<br />
Benchmarks and Analysis 2012-2013 includes several significant enhancements.<br />
First, the timing and methodology of the survey have been adjusted to secure more<br />
timely staffing and expenditure information. Specifically, the survey was conducted<br />
in early 2012 (surveys in the recent past were conducted in the fourth quarter),<br />
allowing collection of actual staffing and spending data for 2011 and budgeted<br />
staff and expenditure information for 2012. The survey report also includes three<br />
‘‘perspective’’ pieces, which provide surveyed <strong>HR</strong> executives’ views and<br />
experiences on several key topics: the challenges of hiring contingent staff; the<br />
use of metrics and planning in human resources; and <strong>HR</strong>’s influence on strategic<br />
planning and corporate decisionmaking.<br />
This year’s report is based on responses from 571 human resource executives and<br />
professionals representing a broad cross-section of U.S. employers. (See ‘‘Profile<br />
of Participating Organizations’’ on page 9 for more details on the enterprises and<br />
institutions represented.) Most respondents are at or near the top of the <strong>HR</strong><br />
profession, heading up the human resources function at their facility, division, or<br />
organization.<br />
The challenges facing human resource professionals and their departments are in<br />
ample evidence throughout the survey findings. Year in and out, <strong>HR</strong> departments<br />
are far more likely to take on new duties than to relinquish any programs or<br />
activities. Human resources has gained greater influence on strategic planning<br />
and corporate decisions, but likely greater scrutiny and accountability in the<br />
bargain. And while human resource staff levels relative to employment have<br />
ticked slightly upward over the past decade, it seems a safe bet that increases in<br />
<strong>HR</strong>’s responsibilities have been as great or greater. Human resource budget<br />
adjustments for 2012 reflect some improvement from the last several years, but<br />
are still well short of levels observed before the recession.<br />
xii<br />
2012 The Bureau of National Affairs, Inc. • Arlington, Virginia
Key findings from this year’s survey are summarized by major topic:<br />
<strong>HR</strong> Department Staffing<br />
<strong>HR</strong> department staff levels have seen some reversal of fortune from the<br />
previous few years. Twenty-one percent of surveyed human resource offices<br />
gained staff positions between 2011 and 2012, while 11 percent experienced cuts.<br />
For 2009, nearly a third of respondents (32 percent) reported reductions-in-force<br />
within <strong>HR</strong>, with just 13 percent indicating gains in staff positions.<br />
<strong>HR</strong> Expenditures and Budgets<br />
Budgeted changes in <strong>HR</strong> outlays also indicate modest improvement in <strong>HR</strong><br />
departments’ fiscal situations. The median budgeted change in human resource<br />
department budgets for 2012 is an increase of 3.2 percent, up from 2011 (2.0<br />
percent) and 2010 (2.2 percent). Still, budget adjustments were substantially<br />
higher before the recession, peaking at a median increase of 7.2 percent for both<br />
2006 and 2007.<br />
<strong>HR</strong> Measurement, Strategic Planning, and Priorities<br />
Health care cost containment sits atop most <strong>HR</strong> department agendas.<br />
Stemming the tide of rising health benefit costs ranks as ‘‘extremely important’’<br />
(42 percent) or ‘‘very important’’ (39 percent) for more than four out of five<br />
surveyed <strong>HR</strong> executives, in line with results of previous Bloomberg BNA surveys.<br />
<strong>HR</strong> Activities<br />
As in years past, <strong>HR</strong> departments were far more likely to take on new<br />
functions in 2012 than to give up any duties. Among all responding <strong>HR</strong><br />
executives, 40 percent reported some change in their departments’ responsibilities<br />
within the past 12 months. Only 6 percent relinquished any activities, while more<br />
than a third (34 percent) took on at least one new initiative or program. This<br />
pattern has been consistent throughout the survey’s history.<br />
<strong>HR</strong> is firmly in charge of most employers’ EEO and affirmative action<br />
programs, as about eight in 10 employers (79 percent) assign all aspects of their<br />
EEO compliance and affirmative action to human resources.<br />
Outsourcing<br />
Outsourcing is a well-established aspect of doing business in <strong>HR</strong>. Roughly<br />
seven in 10 human resource offices (69 percent) outsourced at least one activity or<br />
program in 2012, little changed from reports for the past several years but down<br />
a bit from the mid-2000s (e.g., 79 percent in 2005).<br />
2012 The Bureau of National Affairs, Inc. • Arlington, Virginia<br />
xiii
Chapter 1: <strong>HR</strong> Department Staffing<br />
s Specialists in Human Resources<br />
The past several decades have seen a tremendous evolution—or perhaps even<br />
revolution—in the duties, challenges, and perceptions of the human resources<br />
function. Globalization, technology, laws and regulations, and the rise of metrics<br />
and analytics have all conspired to make human resources an infinitely more<br />
demanding and complex discipline, one that increasingly demands specialized<br />
skills and knowledge. Generalists remain, but specialists have risen to the fore in<br />
<strong>HR</strong>. Bloomberg BNA surveys give no indication of any reversal in this trend.<br />
Specialists—executive, professional or technical employees who handle only<br />
one or two areas of human resources—retain a solid foothold in most <strong>HR</strong> departments.<br />
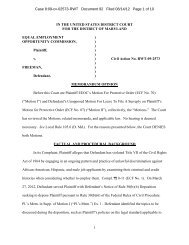
s Two-thirds of the surveyed human resource departments (66 percent) have<br />
at least one specialist on staff, perhaps reflecting a slight increase from last<br />
year (64 percent) and two years ago (62 percent).<br />
s More significantly, <strong>HR</strong> specialization is far more common than it was about<br />
a decade ago. For instance, just 47 percent of human resource departments<br />
surveyed in 2003 had specialists on staff.<br />
Figure 1-6<br />
Prevalence of Human Resource Specialists by Workforce Size<br />
Total<br />
66%<br />
Less than 250<br />
41%<br />
250–499<br />
71%<br />
500–999<br />
60%<br />
1,000–2,499<br />
80%<br />
2,500+<br />
83%<br />
0% 10% 20% 30% 40% 50% 60% 70% 80% 90% 100%<br />
A BNA Graphic/hrbc0106<br />
Specialization surges as the population served by <strong>HR</strong> increases. Or alternatively,<br />
<strong>HR</strong> departments in many small companies do not have the luxury of<br />
hiring specialists.<br />
s Barely two-fifths of organizations with fewer than 250 employees (41 percent)<br />
have an <strong>HR</strong> specialist on staff, as Figure 1-6 shows. <strong>HR</strong> specialization<br />
2012 The Bureau of National Affairs, Inc. • Arlington, Virginia 27
<strong>HR</strong> Department Benchmarks and Analysis 2012-2013<br />
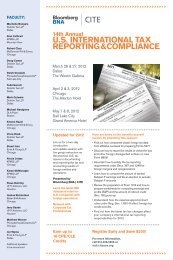
s <strong>HR</strong> Measurement and Planning Scale<br />
Bloomberg BNA’s <strong>HR</strong> Measurement and Planning Scale is a broad index of the<br />
extent of <strong>HR</strong> departments’ measurement and planning activities, based on survey<br />
respondents’ reports of regular evaluations in 10 key areas of human resources:<br />
compensation and benefits, staffing, training and development, cost-saving,<br />
employee relations, trend analysis, <strong>HR</strong> productivity, succession planning,<br />
workforce diversity planning, and balanced scorecard or dashboard presentations.<br />
Among employers responding for 2012, the median number of reported areas in<br />
which measurement and planning tools are routinely applied is 4.0, the same<br />
median figure in each of the previous two years of the survey.<br />
Though most <strong>HR</strong> departments regularly conduct formal measurement of<br />
some aspect of their performance, extensive use of metrics across a wide spectrum<br />
remains the exception.<br />
s At roughly one-fifth of the surveyed firms (22 percent), no more than one<br />
area of <strong>HR</strong> receives regular quantitative assessment. As Figure 3-3 shows,<br />
one-quarter indicated fairly extensive use of metrics, with six or more of the<br />
specified areas evaluated on a routine basis. Just 6 percent reported that all<br />
10 areas covered by the survey are subject to regular quantitative evaluation.<br />
s About one in five <strong>HR</strong> executives (21 percent) routinely measures performance<br />
in two to three areas covered by the survey, while 31 percent indicated<br />
that four to five <strong>HR</strong> parameters get regular quantitative scrutiny.<br />
Figure 3-3<br />
<strong>HR</strong> Measurement and Planning Scale:<br />
Number of Areas that <strong>HR</strong> Measures Regularly<br />
0–1 area<br />
22%<br />
2–3 areas<br />
21%<br />
4–5 areas<br />
31%<br />
6 or more areas<br />
25%<br />
0% 10% 20% 30%<br />
A BNA Graphic/hrbc0303<br />
76 2012 The Bureau of National Affairs, Inc. • Arlington, Virginia
Chapter 4: <strong>HR</strong> Activities<br />
s Employee Services<br />
In addition to traditional benefits discussed in the previous section, workers<br />
typically enjoy a number of services designed to help them plan, manage, and<br />
cope with their personal and professional lives. The prevalence of those services<br />
suggests that both employer and employee appreciate their value; the sensitivity<br />
of some (e.g., employee assistance and counseling) might have prompted their<br />
delegation to outside providers.<br />
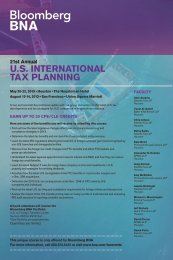
With one exception, employee services are managed by <strong>HR</strong> alone far more often<br />
than jointly with other offices. Outsourcing is far more common in this<br />
arena than in any other broad area of human resources.<br />
s Employee assistance plans and counseling are almost as likely to be outsourced<br />
(40 percent) as assigned solely to human resources (44 percent),<br />
and outplacement services are more often farmed out among the surveyed<br />
firms (23 percent) than given to <strong>HR</strong> alone (20 percent). Very few organizations<br />
ask other internal departments to take a role in their EAPs or outplacement<br />
programs, as Figure 4-13 shows.<br />
s Outsourcing of retirement preparation programs might be gaining traction,<br />
as 37 percent of employers reported that their pre-retirement counseling<br />
and retirement planning services are managed by outside vendors, up from<br />
29 percent last year and 28 percent two years ago.<br />
Figure 4-13<br />
Employee Services—Who Handles It?<br />
Employee assistance<br />
plan/counseling<br />
Relocation services<br />
31%<br />
44%<br />
1%<br />
10%<br />
9%<br />
2%<br />
16%<br />
40%<br />
Pre-retirement counseling/<br />
retirement planning<br />
30%<br />
7%<br />
2%<br />
37%<br />
Recreation/social programs<br />
26%<br />
54%<br />
10%<br />
1%<br />
Outplacement services<br />
20%<br />
5%<br />
1%<br />
23%<br />
0% 10% 20% 30% 40% 50% 60% 70% 80% 90% 100%<br />
<strong>HR</strong> Only<br />
<strong>HR</strong> and Other<br />
Departments<br />
Other Departments<br />
Only<br />
Outsourced<br />
A BNA Graphic/hrbc0413<br />
2012 The Bureau of National Affairs, Inc. • Arlington, Virginia 111
Chapter 5: <strong>HR</strong> Outsourcing<br />
s Outsourcing Obstacles and Prospects<br />
Disappointment with outsourcing is not unheard of. Nearly one in five <strong>HR</strong> officers<br />
reported cases in which a program or activity was returned to human<br />
resources.<br />
s Seventeen percent of respondents indicated that an activity assigned to an<br />
outside provider was eventually brought back in-house, presumably to human<br />
resources. (See Figure 5-11.) While not an insignificant figure, one<br />
would presume than <strong>HR</strong> departments have not been dissuaded by such experiences;<br />
the overall prevalence of outsourcing has been stable, and quite<br />
high, for a number of years.<br />
s Fifteen percent were not sure whether an outsourced activity had ever been<br />
reassigned to human resources, likely the result of some respondents’ short<br />
tenures with their organizations.<br />
Figure 5-11<br />
Outsourced <strong>HR</strong> Activity Ever Brought Back in House?<br />
15%<br />
17%<br />
Yes<br />
No<br />
Don't know<br />
69%<br />
A BNA Graphic/hrbc0511<br />
2012 The Bureau of National Affairs, Inc. • Arlington, Virginia 139